

Key Points
Functional characterization of 105 aHUS-associated FH variants reveals limitations of routinely used variant-classification methods.
Adapting prediction algorithms to FH domains markedly improves variant classification, and rarity in control databases can be misleading.

Abstract
Atypical hemolytic uremic syndrome (aHUS) is a life-threatening thrombotic microangiopathy that can progress, when untreated, to end-stage renal disease. Most frequently, aHUS is caused by complement dysregulation due to pathogenic variants in genes that encode complement components and regulators. Among these genes, the factor H (FH) gene, CFH, presents with the highest frequency (15% to 20%) of variants and is associated with the poorest prognosis. Correct classification of CFH variants as pathogenic or benign is essential to clinical care but remains challenging owing to the dearth of functional studies. As a result, significant numbers of variants are reported as variants of uncertain significance. To address this knowledge gap, we expressed and functionally characterized 105 aHUS-associated FH variants. All FH variants were categorized as pathogenic or benign and, for each, we fully documented the nature of the pathogenicity. Twenty-six previously characterized FH variants were used as controls to validate and confirm the robustness of the functional assays used. Of the remaining 79 uncharacterized variants, only 29 (36.7%) alter FH expression or function in vitro and, therefore, are proposed to be pathogenic. We show that rarity in control databases is not informative for variant classification, and we identify important limitations in applying prediction algorithms to FH variants. Based on structural and functional data, we suggest ways to circumvent these difficulties and, thereby, improve variant classification. Our work highlights the need for functional assays to interpret FH variants accurately if clinical care of patients with aHUS is to be individualized and optimized.
Introduction
Atypical hemolytic uremic syndrome (aHUS) is a severe potentially lethal disease that progresses, in most cases, to chronic kidney disease.1 Defined by the triad of nonimmune hemolytic anemia, thrombocytopenia, and acute kidney failure, criteria for its diagnosis have been described before.1 A cornerstone of clinical care is genetic testing, because pathogenic variants in complement components or regulatory proteins are associated with the development of aHUS in 50% to 60% of patients.2 These variants cause defective regulation of the alternative pathway (AP) on the endothelial cell surface, which triggers episodes of thrombotic microangiopathy in the renal microvasculature and other vital organs.3-9 Therefore, comprehensive genetic analysis serves to reinforce diagnosis and helps to guide clinical decisions, such as treatment with eculizumab or ravulizumab, both of which are humanized monoclonal antibodies that block C5 activation, thereby preventing the pathological consequences of complement dysregulation on endothelial cell surfaces.1
Over the past 20 years, genetic analyses of hundreds of patients with aHUS have shown loss-of-function variants in the CFH gene, which encodes factor H (FH), to be the most common (15% to 20%) aHUS-associated complement variants.2,10 This finding is not surprising given the role that FH plays as the key regulator of the AP of the complement system.11 It controls complement activation in the fluid phase and on cellular surfaces, preserving complement homeostasis and preventing uncontrolled deposition of C3b and resulting host tissue damage. Secreted as a single-chain glycoprotein of 155 kDa, FH is a relatively abundant plasma protein composed of 20 homologous domains of ∼60 aa called “short consensus repeats” (SCRs) that carry out its myriad functions. For example, the N-terminal region (SCR1-4) binds C3b and serves as a cofactor for FI-mediated cleavage of C3b (hereafter referred to as “FI cofactor activity”). It also accelerates the decay of the AP C3-convertase (C3bBb) (decay accelerating activity [DAA]). In comparison, the C-terminal region (SCR19-20) has polyanion (of which sialic acid is the crucial ligand) and C3b/C3d binding sites, which enable FH to bind to tissue surfaces and surface-bound C3b.12-15 The functional significance of the midregion of FH (SCR5-18) is less clear. These SCRs contain additional polyanion binding sites with the capacity to interact with surface ligands; however, their contribution to the regulatory activity of FH has not been formally established. It is believed that the midregion plays a structural role by enabling FH to bend and, therefore, bind simultaneously to different sites on C3b.16
Screening the CFH gene in patients with aHUS is particularly important because FH variants are associated with a poor prognosis.17,18 To optimize clinical care, identified variants must be classified based on their impact; however, differentiating between variants that do or do not alter FH expression or function is challenging. Functional studies are labor intensive and complicated; for these reasons, variant effect is typically inferred using pathogenicity prediction algorithms and allele frequency data. Both approaches have major limitations.19 In addition, the genetic variability of FH in the general population, as ascertained by population genetic resources, such as the Genome Aggregation Database (gnomAD),20 is such that, in aggregate, ∼2.3% of people are heterozygous for a missense variant of CFH that has an allele frequency <0.1%.20
As a major step toward addressing this knowledge gap, we report the functional characterization of 105 genetic variants of FH associated with aHUS. We used 26 previously characterized FH variants as controls to validate and confirm the robustness of the functional assays that we used; 79 variants were analyzed for the first time and unambiguously classified as pathogenic or benign. Our data provide a comprehensive analysis of FH genetic variability and its functional consequences in the context of aHUS. In addition, we identify the strengths and weaknesses of the current pathogenicity prediction algorithms and provide recommendations to aid in the appropriate classification of novel FH variants as they are identified.
Methods
Generation of recombinant FH variant and protein expression
Generation of the recombinant FH variants was performed at GeneArt, a division of Thermo Fisher Scientific (Regensburg, Germany). Briefly, the DNA coding region of C-terminal His-tagged FH variants was synthesized and cloned into a mammalian expression vector, plasmids were transfected into Expi 293 cells, and the resulting FH protein was directly purified from the culture supernatants using Ni2+ columns. After purification, all proteins were adjusted to 1 mg/mL in phosphate buffered saline and stored at −80°C until use.
FH variant characterization assays
Functional characterization of FH variants was performed by testing each expressed mutant using 4 assays, as described in detail in supplemental Materials and outlined in supplemental Figure 1 (available on the Blood web site). The first assay measured overall AP complement regulatory capacity using a modified guinea pig erythrocyte hemolytic assay. The second and third assays used sheep erythrocyte hemolysis to test cofactor activity and DAA, respectively. The final assay was a plate assay to test binding of FH to immobilized C3b. For all 4 assays, data were normalized to the activity of ≥3 wild-type FH protein tests.
Variant pathogenicity determination
FH variants were considered pathogenic if (1) they failed to express in vitro (as measured by western blot) or presented as weak FH bands in sodium dodecyl sulfate-polyacrylamide gel electrophoresis (SDS-PAGE) under nonreducing conditions and/or (2) ≥1 functional assay was abnormal. The exceptions were 4 FH variants that had isolated borderline C3b-binding values (<7% excess of protein as compared to WT protein needed to provide 50% C3b-binding [BD50]) and were regarded as benign. The supplemental Datasheets provide a detailed illustration of each FH variant that includes SDS-PAGE bands and graphic displays of all 4 assays, as well as variant localization in the protein structure.
Prediction of pathogenicity
We tested the performance of currently used computational pathogenicity predictions using Combined Annotation Dependent Depletion (CADD) version 1.6, which integrates multiple annotations into 1 metric as the variant prediction algorithm (https://cadd.gs.washington.edu/info).21,22 The PHRED-scaled C-score ranking was selected; variants with CADD scores >15 were considered “likely pathogenic.”
Statistical analysis
Statistical analyses were performed with SPSS software, version 21 (SPSS Inc, Chicago, IL). The Student t test for independent samples was used to compare the functional activities of the different FH variants with those of wild-type FH. A value of P < .05 was considered statistically significant.
Results
Selection of FH variants, expression, and purification
In total, 105 FH aHUS-associated variants were included in these studies. Variants to be studied were identified from published data and from the private aHUS/C3G database available at the Center for Biological Research-Margarita Salas (Madrid, Spain) and in the Molecular Otolaryngology and Renal Research Laboratories in Iowa City. Clinical and laboratory data from aHUS patients carrying these FH variants are provided in supplemental Tables 1 and 2. Seventy-nine FH variants, all with allele frequencies < 1% in any population (gnomAD),20 lack any previously reported in vitro functional or expression data and are analyzed here for the first time (Table 1). The remaining 26 variants have been characterized previously and were included as controls for our assays (Table 2). Among the previously characterized FH variants are several common polymorphisms, including p.Val62Ile, p.His402Tyr, p.Gln950His, p.Thr956Met, and p.Asn1050Tyr.
Functional analysis of new (noncharacterized) FH variants
| Transcript | Protein | Expression | GP hemolysis HR50 (0.71-1.29)* | C3b binding BD50 (0.33-1.67)* | DAA (<12.5)* | FI cofactor activity (<2.5)* | Functional- and expression-based classification |
|---|---|---|---|---|---|---|---|
| c.5G>C | R2T | N | 1.07 | 1.17 | 7.3 | 1.2 | Benign |
| c.32T>C | M11T | N | 1.19 | 1.32 | 7.2 | 1.4 | Benign |
| c.220C>T | L74F | N | 1.08 | 1.39 | 9.6 | 1.9 | Benign |
| c.242A>C | Q81P | N | 4.64 | 2.21 | 51.4 | 21.5 | Pathogenic |
| c.245A>G | K82R | N | 1.11 | 0.87 | 9.4 | 1.7 | Benign |
| c.272C>G | T91S | N | 1.03 | 1.74 | 8.8 | 1.6 | Benign |
| c.332T>A | V111E | N | 1.29 | 1.65 | 8.8 | 1.5 | Benign |
| c.400T>C | W134R | W | >8 | 2.40 | 73.1 | 87.3 | Pathogenic |
| c.451G>A | A151T | N | 1.26 | 0.82 | 9 | 2.2 | Benign |
| c.472G>A | V158I | N | 0.96 | 1.67 | 7.1 | 1.4 | Benign |
| c.476G>A | S159N | N | 1.18 | 1.12 | 10.6 | 1.8 | Benign |
| c.481G>T | A161S | N | 0.98 | 1.03 | 10.8 | 2.1 | Benign |
| c.484A>G | M162V | N | 0.79 | 0.69 | 7.3 | 1.7 | Benign |
| c.497G>T | R166L | N | 1.03 | 0.68 | 11.4 | 6.1 | Pathogenic |
| c.560A>T | D187V | N | 0.94 | 1.36 | 10.8 | 2.1 | Benign |
| c.592T>C | W198R | N | 3.66 | 3.16 | 33.3 | 56.9 | Pathogenic |
| c.595A>G | S199G | N | 1.81 | 3.17 | 17.8 | 7.1 | Pathogenic |
| c.647T>C | I216T | N | 1.18 | 1.35 | 7.9 | 1.7 | Benign |
| c.661A>G | I221V | N | 0.66 | 0.78 | 2.2 | 1.3 | Benign |
| c.773C>T | P258L | N | 1.72 | 2.71 | 17.8 | 4 | Pathogenic |
| c.908G>A | R303Q | N | 1.04 | 0.84 | 3.6 | 1.3 | Benign |
| c.974G>A | C325Y | W | 1.27 | — | 29 | 4.6 | Pathogenic |
| c.1022G>A | R341H | N | 0.86 | 1.27 | 9.5 | 1.8 | Benign |
| c.1064A>C | Y355S | W | 0.77 | — | 30.7 | 4.9 | Pathogenic |
| c.1507C>G | P503A | N | 0.94 | 0.83 | 2.3 | 1.2 | Benign |
| c.1548T>A | N516K | N | 1.15 | 1.72 | 9.8 | 2.2 | Benign |
| c.1565A>G | D522G | N | 0.96 | 1.41 | 6.7 | 2 | Benign |
| c.1591A>G | T531A | N | 1.22 | 1.25 | 9.1 | 2.1 | Benign |
| c.1652T>C | I551T | N | 1.26 | 1.29 | 8.7 | 1.5 | Benign |
| c.1745G>A | R582H | N | 0.80 | 1.17 | 11 | 2.3 | Benign |
| c.1825G>A | V609I | N | 0.86 | 1.03 | 7.1 | 1.8 | Benign |
| c.1922T>C | V641A | N | 1.09 | 1.22 | 10.1 | 1.5 | Benign |
| c.1949G>T | G650V | N | 1.14 | 0.94 | 9.8 | 2.5 | Benign |
| c.2056G>A | V686M | N | 1.01 | 1.20 | 8.4 | 1.9 | Benign |
| c.2120C>T | P707L | N | 1.01 | 1.78 | 8 | 1.9 | Benign |
| c.2461C>T | H821Y | N | 1.02 | 0.96 | 5.6 | 1.4 | Benign |
| c.2503G>T | V835L | N | 0.70 | 1.31 | 8.9 | 2 | Benign |
| c.2650T>C | S884P | N | 0.52 | 0.88 | 7.2 | 1.2 | Benign |
| c.2851T>C | Y951H | N | 0.89 | 1.33 | 11.5 | 2.1 | Benign |
| c.2879T>C | F960S | N | 1.05 | 0.95 | 2.5 | 1.2 | Benign |
| c.3050C>T | T1017I | N | 0.79 | 0.95 | 9.1 | 1.5 | Benign |
| c.3062A>T | Y1021F | N | 1.05 | 1.64 | 8.1 | 1.8 | Benign |
| c.3079G>C | A1027P | N | 0.87 | 0.89 | 3.1 | 1.3 | Benign |
| c.3160G>A | V1054I | N | 1.14 | 0.97 | 9.9 | 1.3 | Benign |
| c.3172T>C | Y1058H | N | 0.91 | 1.64 | 5.4 | 1.4 | Benign |
| c.3176T>C | I1059T | N | 1.00 | 0.87 | 6.1 | 1.6 | Benign |
| c.3178G>C | V1060L | N | 1.04 | 0.65 | 5.9 | 1.6 | Benign |
| c.3179T>C | V1060A | N | 1.03 | 1.32 | 7.4 | 1.4 | Benign |
| c.3181T>C | S1061P | N | 0.90 | 0.76 | 8.8 | 1.9 | Benign |
| c.3226C>G | Q1076E | N | 1.05 | 1.21 | 7.8 | 1.8 | Benign |
| c.3234G>T | R1078S | N | 0.95 | 1.01 | 3.9 | 1.3 | Benign |
| c.3264A>C | E1088D | N | 1.09 | 1.13 | 11.1 | 1.4 | Benign |
| c.3357C>G | D1119E | N | 2.34 | 2.18 | 21.9 | 9.5 | Pathogenic |
| c.3389C>T | P1130L | N | 1.05 | 0.89 | 11.5 | 2 | Benign |
| c.3405G>C | E1135D | N | 0.82 | 0.85 | 7.7 | 1.7 | Benign |
| c.3410A>T | Q1137L | N | 3.24 | 4.49 | 28.8 | 8.4 | Pathogenic |
| c.3427C>G | Q1143E | N | 0.96 | 1.55 | 9.8 | 1.8 | Benign |
| c.3469T>C | W1157R | F | — | — | — | — | Pathogenic |
| c.3481C>A | P1161T | W | 3.04 | 2.47 | 34.1 | 5.4 | Pathogenic |
| c.3489C>G | C1163W | F | — | — | — | — | Pathogenic |
| c.3493C>T | H1165Y | F | — | — | — | — | Pathogenic |
| c.3503T>C | V1168A | F | — | — | — | — | Pathogenic |
| c.3505A>C | I1169L | N | 1.82 | 1.27 | 26.1 | 8.9 | Pathogenic |
| c.3530A>G | I1177C | N | 2.15 | 1.97 | 24.9 | 13 | Pathogenic |
| c.3547T>A | W1183R | N | 6.65 | 2.52 | 45.9 | 38.8 | Pathogenic |
| c.3549G>T | W1183C | N | 2.51 | 4.37 | 52 | 75.3 | Pathogenic |
| c.3550A>G | T1184A | N | 2.27 | 1.73 | 28.1 | 7.8 | Pathogenic |
| c.3550A>C | T1184P | N | 2.52 | 2.57 | 29 | 37.5 | Pathogenic |
| c.3551C>G | T1184R | N | 1.12 | 0.65 | 11.5 | 1.8 | Benign |
| c.3557A>C | K1186T | N | 1.90 | 2.14 | 13.3 | 2.3 | Pathogenic |
| c.3566T>C | L1189P | N | 3.25 | 1.82 | 41.3 | 47.8 | Pathogenic |
| c.3566T>A | L1189H | N | 1.27 | 0.60 | 27.7 | 18.1 | Pathogenic |
| c.3572C>G | S1191W | N | 3.07 | 1.25 | 49.5 | 67.5 | Pathogenic |
| c.3581G>A | G1194D | W | 2.24 | 4.98 | 44.2 | 16.5 | Pathogenic |
| c.3593A>T | E1198V | W | 2.60 | 0.98 | 43.8 | 49.8 | Pathogenic |
| c.3595T>C | F1199L | F | — | — | — | — | Pathogenic |
| c.3598G>T | V1200L | N | 0.78 | 0.98 | 10.8 | 1.6 | Benign |
| c.3607C>T | R1203W | N | 1.11 | 0.78 | 12.5 | 1.7 | Benign |
| c.3616C>T | R1206C | N | 1.92 | 3.93 | 11.2 | 2.2 | Pathogenic |
Abnormal values are shown in bold type.
F, failed to express in vitro; GP, guinea pig; N, normal; W, weak (decreased) intensity of band corresponding to FH in nonreducing SDS-PAGE; –, not performed or not saturable binding (see “Individual variant datasheets” for details).
Normal ranges are in parentheses. HR50 refers to the concentration fold of FH mutant needed to confer 50% protection from lysis compared with the wild-type FH protein in the guinea pig hemolysis assay; BD50 refers to the concentration fold of FH mutant needed to confer similar binding to C3b compared with the wild-type FH protein (see “Methods” for details).
Functional analysis in previously characterized FH variants (n = 26)
| Transcript | Protein | Expression | GP hemolysis HR50 (0.71-1.29)* | C3b binding BD50 (0.33-1.67)* | DAA (<12.5)* | FI cofactor activity (<2.5)* | Classification (this study) | Classification (previously reported) | Reference |
|---|---|---|---|---|---|---|---|---|---|
| c.157C>T | R53C | N | 2.46 | 1.14 | 32.9 | 1.7 | Pathogenic | Pathogenic | 31 |
| c.184G>A | V62I | N | 0.91 | 1.04 | 4.2 | 1.2 | Benign | Polymorphism | 32 |
| c.232A>G | R78G | N | 3.36 | 1.68 | 36.6 | 19.7 | Pathogenic | Pathogenic | 33 |
| c.524G>C | R175P | N | > 8 | 2.49 | 46.6 | 72.6 | Pathogenic | Pathogenic | 34 |
| c.653G>A | G218E | N | 7.33 | 8.10 | 43.6 | 47.5 | Pathogenic | Nonexpressed | 35 |
| c.1189G>A | G397R | W | 1.12 | — | 20.5 | 2.3 | Pathogenic | Nonexpressed | 36 |
| c.1198C>A | Q400K† | N | 0.94 | 1.18 | 8.1 | 1.9 | Benign | Nonexpressed | 22 |
| c.1204C>A | H402Y | N | 1.22 | 1.00 | 5.6 | 1.7 | Benign | Polymorphism | — |
| c.1231T>A | S411T | N | 1.00 | 0.98 | 7.9 | 1.8 | Benign | Benign | 5 |
| c.1292G>A | C431Y | W | 1.12 | 1.54 | 12.9 | 2.6 | Pathogenic | Nonexpressed | 36 |
| c.1343G>A | C448Y | W | 1.09 | 1.32 | 6.8 | 1.8 | Pathogenic | Nonexpressed | 37 |
| c.1424A>C | Y475S† | N | 0.93 | 1.02 | 6.4 | 1.7 | Benign | Nonexpressed | 38 |
| c.2695T>G | Y899D | W | 0.70 | 0.83 | 4.1 | 1.5 | Pathogenic | Nonexpressed | 39 |
| c.2850G>T | Q950H | N | 1.14 | 1.52 | 9.7 | 1.6 | Benign | Polymorphism | 40 |
| c.2867C>T | T956M | N | 1.19 | 0.81 | 7.7 | 1.9 | Benign | Polymorphism | 31 |
| c.2918G>A | C973Y | W | 1.11 | 0.80 | 6.5 | 1.9 | Pathogenic | Nonexpressed | 41 |
| c.3148A>T | N1050Y | N | 1.07 | 1.77 | 7.8 | 1.6 | Benign | Polymorphism | 42 |
| c.3231T>G | C1077W | W | 1.20 | 1.11 | 11.1 | 3.9 | Pathogenic | Nonexpressed | 43 |
| c.3355G>A | D1119N | N | 3.07 | 1.09 | 42.3 | 53.6 | Pathogenic | Pathogenic | 31 |
| c.3356A>G | D1119G | N | 2.71 | 0.78 | 37.1 | 27.8 | Pathogenic | Pathogenic | 44 |
| c.3425A>G | Y1142C | N | 5.03 | 8.78 | 60.3 | 73.7 | Pathogenic | Pathogenic | 45 |
| c.3454T>A | C1152S | F | — | — | — | — | Pathogenic | Nonexpressed | 46 |
| c.3497C>T | P1166L | N | 2.71 | 6.93 | 48.3 | 32.9 | Pathogenic | Pathogenic | 31 |
| c.3572C>T | S1191L | N | 1.13 | 1.08 | 25.6 | 18.8 | Pathogenic | Pathogenic | 47 |
| c.3628C>T | R1210C | N | 1.51 | 1.20 | 8.8 | 2.1 | Pathogenic | Pathogenic | 8 |
| c.3644G>A | R1215Q | N | 4.75 | 1.79 | 38.1 | 18.3 | Pathogenic | Pathogenic | 16,48 |
Abnormal values are shown in bold type.
F, failed to express in vitro; GP, guinea pig; N, normal; W, weak (decreased) intensity of band corresponding to FH in nonreducing SDS-PAGE; –, not performed or not saturable binding (see “Individual variant datasheets” for details).
Normal ranges are in parenthesis. HR50 refers to the concentration fold of FH mutant needed to confer 50% protection from lysis compared with the wild-type FH protein in the guinea pig hemolysis assay; BD50 refers to the concentration fold of FH mutant needed to confer similar binding to C3b compared with the wild-type FH protein (see “Methods” for details).
FH variants that associate with quantitative deficiencies in patients but express normally in vitro and are functionally undistinguishable from the wild-type FH in vitro.
Eighteen of the 105 FH variants tested failed to express in vitro (n = 6) or presented as weak FH bands in SDS-PAGE under nonreducing conditions (n = 12). Some of the variants presented with higher molecular weight bands, suggesting aggregation of partially denatured proteins. Lower molecular weight bands were also observed for some of the variants, which may indicate protein degradation (Figure 1; supplemental Datasheets; supplemental Table 3). Included in this list of 18 variants were 7 of the 10 variants previously known to be associated with decreased serum levels of FH (p.Gly397Arg, p.Cys431Tyr, p.Cys448Tyr, p.Tyr899Asp, p.Cys973Tyr, p.Cys1077Trp, and p.Cys1152Ser). p.Gly218Glu, p.Gln400Lys, and p.Tyr475Ser have also been associated with decreased plasma levels23 but expressed similarly to the wild-type control as a recombinant protein in vitro. Based on functional testing, the recombinant p.Gln400Lys and p.Tyr475Ser proteins also behaved similarly to the wild-type control (Table 2; supplemental Datasheets). There are several possible explanations for the discrepancies between our findings and the reports demonstrating nonexpression of these 3 FH variants in vivo. One that likely applies to p.Gln400Lys is the presence of an intronic variation in linkage disequilibrium with this variant that leads to lack of expression of FH and may not be assayed in this study because complementary DNA–containing plasmids were used for transfection. In the case of p.Gly218Glu and p.Tyr475Ser, affecting critical residues that are conserved in all FH SCRs (supplemental Figure 2), the explanation may involve differences in the stability of a potentially misfolded protein in the culture supernatant compared with plasma. The remaining previously characterized FH variants with normal expression in plasma expressed normally in vitro (Table 2).
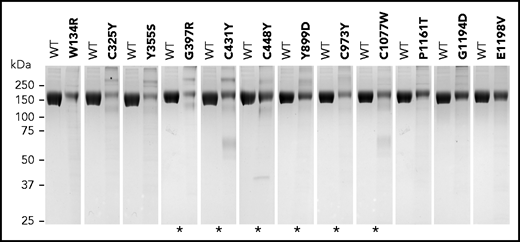
Variants showing weak FH bands under nonreducing SDS-PAGE. Coomassie-stained gels showing each FH variant compared with equal amounts of wild-type (WT) FH protein (measured as optical density at absorbance at 280 nm). Asterisks indicate FH variants that were previously described to be associated with no-expression alleles or decreased FH plasma levels (see supplemental Table 3). Differences in expression levels were confirmed in all cases by enzyme-linked immunosorbent assay measurements.
Variants showing weak FH bands under nonreducing SDS-PAGE. Coomassie-stained gels showing each FH variant compared with equal amounts of wild-type (WT) FH protein (measured as optical density at absorbance at 280 nm). Asterisks indicate FH variants that were previously described to be associated with no-expression alleles or decreased FH plasma levels (see supplemental Table 3). Differences in expression levels were confirmed in all cases by enzyme-linked immunosorbent assay measurements.
Of the 79 uncharacterized FH variants, 5 failed to express in vitro (p.Trp1157Arg, p.Cys1163Trp, p.His1165Tyr, p.Val1168Ala, p.Phe1199Leu), and 6 demonstrated weak FH bands in SDS-PAGE under nonreducing conditions (p.Trp134Arg, p.Cys325Tyr, p.Tyr355Ser, p.Pro1161Thr, p.Gly1194Asp, p.Glu1198Val) (Figure 1; Table 1; supplemental Datasheets; supplemental Table 3). Based on the data obtained for the previously characterized FH variants that cause FH deficiencies in vivo and demonstrated weak FH bands in SDS-PAGE under nonreducing conditions (see above), we considered these 11 variants to be likely associated with low FH plasma levels in vivo and, therefore, classified them as pathogenic.
With the exception of the 6 proteins that completely failed to express in vitro (p.Cys1152Ser, p.Trp1157Arg, p.Cys1163Trp, p.His1165Tyr, p.Val1168Ala, and p.Phe1199Leu), all FH variants (n = 99) were functionally characterized using 4 assays (see Methods).
Functional analysis of previously characterized FH variants
Table 2 illustrates the validation of our 4 functional assays in the analysis of the FH variants previously characterized and reported to express normally. All 5 polymorphisms (p.Val62Ile, p.His402Tyr, p.Gln950His, p.Thr956Met, and p.Asn1050Tyr) and the rare FH variant p.Ser411Thr were classified as benign in our assays. Similarly, we classified as pathogenic all of the FH variants labeled as pathogenic and reported to express normally in earlier studies (full list of references in Table 2).
Ten of the previously characterized variants were reported to have reduced or no expression. Of these variants, we found that 1 variant failed to express (p.Cys1152Ser) and that 6 variants showed weak FH bands in SDS-PAGE under nonreducing conditions (p.Gly347Arg, p.Cys431Tyr, p.Cys448Tyr, p.Tyr899Asp, p.Cys973Tyr, p.Cys1077Trp). Notably, the functional assays of these variants were similar to the wild-type control. Similarly, the p.Gln400Lys and p.Tyr475Ser variants that were reported to have reduced or no expression and expressed normally in vitro, were functionally normal in our assays.
Our validation studies confirm the previous classification of 24 of the 26 FH variants and illustrate the potential for artifacts associated with the in vitro expression of FH variants. Structurally altered proteins that would have been rapidly cleared from the plasma in vivo remain in the culture supernatants and can be purified by the Ni2+ columns. In the case of p.Gln400Lys, p.Cys431Tyr, p.Cys448Tyr, p.Tyr475Ser, p.Tyr899Asp, p.Cys973Tyr, and p.Cys1077Trp, the postulated structural modifications involve SCRs in the midregion of FH; because these structural modifications do not affect the N-terminal or C-terminal regions, functional values in our assays are expected to be normal. These data indicate the necessity of precise measurements of FH in the plasma of patients for the accurate classification of variant effect. For example, accurate plasma FH levels are particularly important to rule out the possible effect of linked intron or promoter mutations.
The p.Arg1210Cys variant deserves a comment. For this variant, which showed a normal size of 150 kDa in nonreducing SDS-PAGE (supplemental Datasheets), pathogenicity arises from the ability of the free cysteine residue to form covalently linked high molecular heterodimers with serum albumin. These heterodimers, which are evident in nonreducing SDS-PAGE analysis of patient plasma,8 are absent in the recombinant p.Arg1210Cys protein.
Functional analysis of new (noncharacterized) FH variants
Table 1 summarizes the functional assays for the FH variants that have not been studied (see also supplemental Datasheets). It also includes the FH variants that failed to produce a recombinant FH protein. Of the 79 FH variants characterized here for the first time, 35 (44.3%) are novel and not reported in gnomAD.20 Importantly, all FH variants that demonstrated weak FH bands in SDS-PAGE under nonreducing conditions (p.Trp134Arg, p.Cys325Tyr, p.Tyr355Ser, p.Gly1194Asp, p.Glu1198Val, p.Pro1161Thr) as a result of poor expression in vitro were clearly functionally impaired. Fifty (74%) of the 68 uncharacterized FH variants that expressed normally do not show evidence of pathogenicity, with functional data in all assays indistinguishable from wild-type FH protein (Table 1).
The remaining 18 FH variants were classified as pathogenic. Most showed abnormal complement regulatory activity in all functional assays (Table 1; supplemental Datasheets) with 4 exceptions (p.Ile1169Leu, p.Leu1189His, p.Ser1191Trp, p.Glu1198Val) that showed binding to C3b similar to wild-type control, despite alterations in the other functional assays. These 4 variants are all in the C-terminal region within the sialic acid binding site (Figure 2), which justifies their normal binding to C3b and weak impact in the guinea pig erythrocyte hemolysis assay. The well-known p.Ser1191Leu variant, which has been characterized previously and specifically impairs binding to sialic acid,24,25 behaved in a similar fashion and was classified as pathogenic (Table 2).
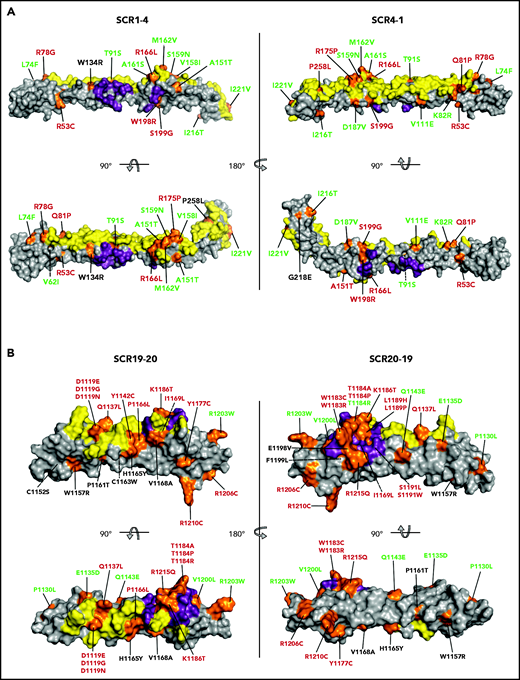
Mapping of the tested FH variants. FH N-terminal (A) and C-terminal (B) crystal structure. The surfaces that interact with C3b (N terminus) and C3d (C terminus) are depicted in yellow. The FI-interacting surface in the N terminus and the sialic acid binding site in the C terminus are depicted in purple. The position of all variants is indicated in orange. FH variant classification codes are based on functional assay results: benign (green), nonexpressed (black), and functionally impaired (red).
Mapping of the tested FH variants. FH N-terminal (A) and C-terminal (B) crystal structure. The surfaces that interact with C3b (N terminus) and C3d (C terminus) are depicted in yellow. The FI-interacting surface in the N terminus and the sialic acid binding site in the C terminus are depicted in purple. The position of all variants is indicated in orange. FH variant classification codes are based on functional assay results: benign (green), nonexpressed (black), and functionally impaired (red).
Structural analyses
The 79 noncharacterized CFH variants included in these analyses were scattered along the entire FH amino acid sequence, but variants are not evenly distributed in different regions of the FH molecule. Twenty of these 79 variants are in the N-terminal region (averaging 5 variants per SCR), 32 are in the midregion (2.3 variants per SCR), and 27 are in the C-terminal region (13.5 variants per SCR) (Tables 1 and 3). Figure 2 depicts mapping of all 105 tested FH variants on a 3-dimensional structural model of the N-terminal and C-terminal regions of wild-type FH. At the N-terminal region, 2 large surfaces are involved in the interaction with C3b and FI, and pathogenic FH variants tend to locate in these regions.26,27 The C-terminal region of FH includes a large surface that interacts with the thioester domain of C3b (C3d) and a sialic acid binding site that is critical for complement regulation on host endothelial surfaces.13-16 aHUS-associated pathogenic FH variants cluster in the FH C terminus and are mainly located on the surface, interacting with the thioester domain of C3b, and in the sialic acid binding site (Figure 2).
To more precisely appreciate the association of FH variants with their location and structural and/or functional impact, we depicted all FH variants (n = 105) in a linear sequence (Figure 3A). In this representation, we labeled the FH amino acids “SCR consensus” amino acids, corresponding to residues that are conserved in all FH SCRs (supplemental Figure 2), and “functionally relevant” amino acids, or amino acids that make contact with C3b, C3d, and FI or are involved in sialic acid binding. Using these amino acid categories, we found that 85% (17/20) of the nonexpressed FH variants (including p.Gln400Lys and p.Tyr475Ser) involve SCR consensus residues and that 46% (13/28) of FH variants showing functional impairment alter functionally relevant amino acids. Importantly, most benign FH variants (84%; 46/55) are located in residues that are neither SCR consensus nor functionally relevant.
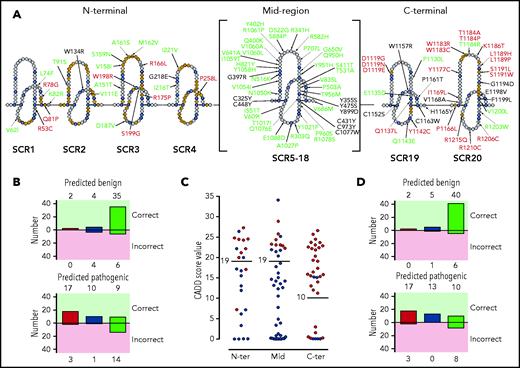
Distribution of the tested FH variants in the FH sequence. (A) Schematic representation of the amino acid sequence of the 20 FH SCRs. Amino acids corresponding to the SCR consensus sequence are depicted in black, those functionally relevant are in yellow, and all other amino acids are in gray. FH variant classification codes are based on functional assay results: benign (green), nonexpressed (black), and functionally impaired (red). (B) Breakdown of CADD computational predictions using a default score value cutoff of 15: benign predictions (upper panel) and pathogenic predictions (lower panel). Residue types from left to right are “SCR consensus,” “functionally relevant,” and “other.” (C) Distribution of FH classified experimentally as pathogenic (red dots) or benign (green dots) according to CADD scores. Horizontal lines indicate the selected cutoff for each FH region. (D) Breakdown of CADD computational predictions using adjusted score value cutoff according to functional domain: benign predictions (upper panel) and pathogenic predictions (lower panel). Residue types from left to right are “SCR consensus,” “functionally relevant,” and “other.”
Distribution of the tested FH variants in the FH sequence. (A) Schematic representation of the amino acid sequence of the 20 FH SCRs. Amino acids corresponding to the SCR consensus sequence are depicted in black, those functionally relevant are in yellow, and all other amino acids are in gray. FH variant classification codes are based on functional assay results: benign (green), nonexpressed (black), and functionally impaired (red). (B) Breakdown of CADD computational predictions using a default score value cutoff of 15: benign predictions (upper panel) and pathogenic predictions (lower panel). Residue types from left to right are “SCR consensus,” “functionally relevant,” and “other.” (C) Distribution of FH classified experimentally as pathogenic (red dots) or benign (green dots) according to CADD scores. Horizontal lines indicate the selected cutoff for each FH region. (D) Breakdown of CADD computational predictions using adjusted score value cutoff according to functional domain: benign predictions (upper panel) and pathogenic predictions (lower panel). Residue types from left to right are “SCR consensus,” “functionally relevant,” and “other.”
Prediction of pathogenicity
Variant pathogenicity was computationally predicted using CADD (see "Methods"). We found that pathogenicity was predicted correctly for 73% (77/105) of FH variants. A breakdown of computational predictions by CADD according to their value and correctness, as well as the kind of residue (SCR consensus, functionally relevant, or other, as defined above) is given in Figure 3B. The prediction performed better for SCR consensus and functionally relevant residues (80%; 33/41) than for other residues (69%; 44/64). A detailed analysis of the distribution of CADD scores for FH variants experimentally classified as pathogenic or benign illustrates that adjusting the CADD score threshold for pathogenicity to >19 for the N terminus and midregion and to >10 for the C terminus substantially improves overall predictions to 83% (87/105) (Figure 3C; Table 3). Pathogenicity prediction is improved for FH variants in SCR consensus and functionally relevant residues (90%; 37/41), as well as in other residues (78%; 50/64) (Figure 3D).
Pathogenicity predictions for FH variants and their classification based on expression and functional data
| Transcript | Protein | FH domain | CADD score | Classification | Discrepancy | AF (gnomAD) | |
|---|---|---|---|---|---|---|---|
| Predicted | Observed | ||||||
| N-terminal region (CADD score cutoff = 19) | |||||||
| c.5G>C | R2T | SP | 6.11 | Benign | Benign | No | 2 × 10⁻⁵ |
| c.32T>C | M11T | SP | 15.48 | Benign | Benign | No | NP |
| c.157C>T | R53C* | SCR1 | 24.4 | Pathogenic | Pathogenic | No | 2 × 10⁻⁵ |
| c.184G>A | V62I* | SCR1 | 7.108 | Benign | Benign | No | 3 × 10⁻¹ |
| c.220C>T | L74F | SCR1 | 13.00 | Benign | Benign | No | 4 × 10⁻⁶ |
| c.232A>G | R78G* | SCR1 | 19.92 | Pathogenic | Pathogenic | No | NP |
| c.242A>C | Q81P | SCR1 | 22.1 | Pathogenic | Pathogenic | No | NP |
| c.245A>G | K82R | SCR2 | 22.1 | Pathogenic | Benign | Yes† | 2 × 10⁻⁵ |
| c.272C>G | T91S | SCR2 | 19.90 | Pathogenic | Benign | Yes† | 8 × 10⁻⁶ |
| c.332T>A | V111E | SCR2 | 26.3 | Pathogenic | Benign | Yes† | 1 × 10⁻⁴ |
| c.400T>C | W134R | SCR2 | 27.2 | Pathogenic | Pathogenic‡ | No | NP |
| c.451G>A | A151T | SCR3 | 3.283 | Benign | Benign | No | 4 × 10⁻⁶ |
| c.472G>A | V158I | SCR3 | 0.001 | Benign | Benign | No | 1 × 10⁻⁴ |
| c.476G>A | S159N | SCR3 | 16.65 | Benign | Benign | No | 4 × 10⁻⁵ |
| c.481G>T | A161S | SCR3 | 11.90 | Benign | Benign | No | 9 × 10⁻⁵ |
| c.484A>G | M162V | SCR3 | 0.017 | Benign | Benign | No | 3 × 10⁻⁵ |
| c.497G>T | R166L | SCR3 | 17.01 | Benign | Pathogenic | Yes§ | 7 × 10⁻⁶ |
| c.524G>C | R175P* | SCR3 | 7.153 | Benign | Pathogenic | Yes§ | 4 × 10⁻⁶ |
| c.560A>T | D187V | SCR3 | 17.14 | Benign | Benign | No | NP |
| c.592T>C | W198R | SCR3 | 24.2 | Pathogenic | Pathogenic | No | NP |
| c.595A>G | S199G | SCR3 | 24.5 | Pathogenic | Pathogenic | No | NP |
| c.647T>C | I216T | SCR4 | 0.001 | Benign | Benign | No | 1 × 10⁻⁴ |
| c.653G>A | G218E* | SCR4 | 24.7 | Pathogenic | Pathogenic‡ | No | NP |
| c.661A>G | I221V | SCR4 | 0.001 | Benign | Benign | No | 2 × 10⁻⁵ |
| c.773C>T | P258L | SCR4 | 21.1 | Pathogenic | Pathogenic | No | 4 × 10⁻⁶ |
| Midregion (CADD score cutoff = 19) | |||||||
| c.908G>A | R303Q | SCR5 | 0.169 | Benign | Benign | No | 2 × 10⁻⁵ |
| c.974G>A | C325Y | SCR6 | 25.7 | Pathogenic | Pathogenic‡ | No | NP |
| c.1022G>A | R341H | SCR6 | 7.702 | Benign | Benign | No | 4 × 10⁻⁵ |
| c.1064A>C | Y355S | SCR6 | 22.2 | Pathogenic | Pathogenic‡ | No | NP |
| c.1189G>A | G397R* | SCR7 | 28.8 | Pathogenic | Pathogenic‡ | No | NP |
| c.1198C>A | Q400K* | SCR7 | 0.019 | Benign | Benign‡ | No | 1 × 10⁻⁴ |
| c.1204C>A | H402Y* | SCR7 | 0.001 | Benign | Benign | No | 7 × 10⁻¹ |
| c.1231T>A | S411T* | SCR7 | 0.158 | Benign | Benign | No | NP |
| c.1292G>A | C431Y* | SCR7 | 24.3 | Pathogenic | Pathogenic‡ | No | NP |
| c.1343G>A | C448Y* | SCR8 | 23.0 | Pathogenic | Pathogenic‡ | No | NP |
| c.1424A>C | Y475S* | SCR8 | 20.3 | Pathogenic | Benign‡ | Yes† | NP |
| c.1507C>G | P503A | SCR8 | 21.9 | Pathogenic | Benign | Yes† | 2 × 10⁻⁵ |
| c.1548T>A | N516K | SCR9 | 21.7 | Pathogenic | Benign | Yes† | 3 × 10⁻⁴ |
| c.1565A>G | D522G | SCR9 | 13.10 | Benign | Benign | No | NP |
| c.1591A>G | T531A | SCR9 | 0.029 | Benign | Benign | No | 8 × 10⁻⁶ |
| c.1652T>C | I551T | SCR9 | 21.4 | Pathogenic | Benign | Yes† | 5 × 10⁻³ |
| c.1745G>A | R582H | SCR10 | 17.71 | Benign | Benign | No | 2 × 10⁻⁵ |
| c.1825G>A | V609I | SCR10 | 0.768 | Benign | Benign | No | 2 × 10⁻⁴ |
| c.1922T>C | V641A | SCR11 | 13.51 | Benign | Benign | No | 5 × 10⁻⁵ |
| c.1949G>T | G650V | SCR11 | 0.184 | Benign | Benign | No | 2 × 10⁻⁴ |
| c.2056G>A | V686M | SCR11 | 34 | Pathogenic | Benign | Yes† | NP |
| c.2120C>T | P707L | SCR12 | 25.1 | Pathogenic | Benign | Yes† | NP |
| c.2461C>T | H821Y | SCR14 | 0.107 | Benign | Benign | No | 9 × 10⁻⁵ |
| c.2503G>T | V835L | SCR14 | 0.460 | Benign | Benign | No | 1 × 10⁻⁵ |
| c.2650T>C | S884P | SCR15 | 12.28 | Benign | Benign | No | 3 × 10⁻⁵ |
| c.2695T>G | Y899D* | SCR15 | 23 | Pathogenic | Pathogenic‡ | No | NP |
| c.2850G>T | Q950H* | SCR16 | 14.17 | Benign | Benign | No | 3 × 10⁻³ |
| c.2851T>C | Y951H | SCR16 | 14.6 | Benign | Benign | No | 1 × 10⁻⁵ |
| c.2867C>T | T956M* | SCR16 | 14.99 | Benign | Benign | No | 1 × 10⁻³ |
| c.2879T>C | F960S | SCR16 | 0.012 | Benign | Benign | No | 6 × 10⁻⁵ |
| c.2918G>A | C973Y* | SCR16 | 22.8 | Pathogenic | Pathogenic‡ | No | NP |
| c.3050C>T | T1017I | SCR17 | 10.49 | Benign | Benign | No | 1 × 10⁻³ |
| c.3062A>T | Y1021F | SCR17 | 0.842 | Benign | Benign | No | NP |
| c.3079G>C | A1027P | SCR17 | 0.004 | Benign | Benign | No | 6 × 10⁻⁵ |
| c.3148A>T | N1050Y* | SCR18 | 14.17 | Benign | Benign | No | 1 × 10⁻² |
| c.3160G>A | V1054I | SCR18 | 16.12 | Benign | Benign | No | 5 × 10⁻⁵ |
| c.3172T>C | Y1058H | SCR18 | 0.001 | Benign | Benign | No | 6 × 10⁻⁴ |
| c.3176T>C | I1059T | SCR18 | 12.6 | Benign | Benign | No | 7 × 10⁻³ |
| c.3178G>C | V1060L | SCR18 | 0.019 | Benign | Benign | No | 5 × 10⁻⁴ |
| c.3179T>C | V1060A | SCR18 | 1.253 | Benign | Benign | No | NP |
| c.3181T>C | S1061P | SCR18 | 4.836 | Benign | Benign | No | NP |
| c.3226C>G | Q1076E | SCR18 | 3.884 | Benign | Benign | No | 3 × 10⁻⁴ |
| c.3231T>G | C1077W* | SCR18 | 23.2 | Pathogenic | Pathogenic‡ | No | NP |
| c.3234G>T | R1078S | SCR18 | 3.369 | Benign | Benign | No | 7 × 10⁻⁵ |
| c.3264A>C | E1088D | SCR18 | 18.53 | Benign | Benign | No | NP |
| C-terminal region (CADD score cutoff: 10) | |||||||
| c.3355G>A | D1119N* | SCR19 | 24.4 | Pathogenic | Pathogenic | No | NP |
| c.3356A>G | D1119G* | SCR19 | 23 | Pathogenic | Pathogenic | No | 4 × 10⁻⁶ |
| c.3357C>G | D1119E | SCR19 | 11.94 | Pathogenic | Pathogenic | No | 1 × 10⁻⁵ |
| c.3389C>T | P1130L | SCR19 | 15.04 | Pathogenic | Benign | Yes† | NP |
| c.3405G>C | E1135D | SCR19 | 15.16 | Pathogenic | Benign | Yes† | 4 × 10⁻⁶ |
| c.3410A>T | Q1137L | SCR19 | 16.39 | Pathogenic | Pathogenic | No | NP |
| c.3425A>G | Y1142C* | SCR19 | 22.1 | Pathogenic | Pathogenic | No | NP |
| c.3427C>G | Q1143E | SCR19 | 0.001 | Benign | Benign | No | 9 × 10⁻³ |
| c.3454T>A | C1152S* | SCR19 | 23.6 | Pathogenic | Pathogenic‡ | No | 4 × 10⁻⁶ |
| c.3469T>C | W1157R | SCR19 | 26.5 | Pathogenic | Pathogenic‡ | No | NP |
| c.3481C>A | P1161T | SCR19 | 23.6 | Pathogenic | Pathogenic‡ | No | NP |
| c.3489C>G | C1163W | SCR19 | 25.6 | Pathogenic | Pathogenic‡ | No | NP |
| c.3493C>T | H1165Y | SCR19 | 11.20 | Pathogenic | Pathogenic‡ | No | 2 × 10⁻⁵ |
| c.3497C>T | P1166L* | SCR20 | 13.96 | Pathogenic | Pathogenic | No | NP |
| c.3503T>C | V1168A | SCR20 | 19.03 | Pathogenic | Pathogenic‡ | No | NP |
| c.3505A>C | I1169L | SCR20 | 15.43 | Pathogenic | Pathogenic | No | NP |
| c.3530A>G | Y1177C | SCR20 | 22.8 | Pathogenic | Pathogenic | No | NP |
| c.3547T>A | W1183R | SCR20 | 19.26 | Pathogenic | Pathogenic | No | NP |
| c.3549G>T | W1183C | SCR20 | 22.5 | Pathogenic | Pathogenic | No | NP |
| c.3550A>G | T1184A | SCR20 | 0.502 | Benign | Pathogenic | Yes§ | NP |
| c.3550A>C | T1184P | SCR20 | 1.498 | Benign | Pathogenic | Yes§ | NP |
| c.3551C>G | T1184R | SCR20 | 0.001 | Benign | Benign | No | NP |
| c.3557A>C | K1186T | SCR20 | 0.255 | Benign | Pathogenic | Yes§ | 4 × 10⁻⁶ |
| c.3566T>C | L1189P | SCR20 | 15.81 | Pathogenic | Pathogenic | No | NP |
| c.3566T>A | L1189H | SCR20 | 20.3 | Pathogenic | Pathogenic | No | NP |
| c.3572C>T | S1191L* | SCR20 | 12.98 | Pathogenic | Pathogenic | No | NP |
| c.3572C>G | S1191W | SCR20 | 17.31 | Pathogenic | Pathogenic | No | NP |
| c.3581G>A | G1194D | SCR20 | 15.28 | Pathogenic | Pathogenic‡ | No | 1 × 10⁻⁵ |
| c.3593A>T | E1198V | SCR20 | 22.3 | Pathogenic | Pathogenic‡ | No | NP |
| c.3595T>C | F1199L | SCR20 | 21.8 | Pathogenic | Pathogenic‡ | No | NP |
| c.3598G>T | V1200L | SCR20 | 0.001 | Benign | Benign | No | NP |
| c.3607C>T | R1203W | SCR20 | 0.005 | Benign | Benign | No | 4 × 10⁻⁵ |
| c.3616C>T | R1206C | SCR20 | 0.144 | Benign | Pathogenic | Yes§ | NP |
| c.3628C>T | R1210C* | SCR20 | 2.952 | Benign | Pathogenic | Yes§ | 1 × 10⁻⁴ |
| c.3644G>A | R1215Q* | SCR20 | 15.74 | Pathogenic | Pathogenic | No | NP |
FH variants with allele frequency >.0001 in whole gnomAD are in bold type.
NP, not present.
FH variant that was characterized in a previous study.
Predicted pathogenic and found benign.
Variant that is not expressed or likely not expressed in vivo.
Predicted benign and found pathogenic.
Using these thresholds, 5 of 25 (20%) FH variants at the N terminus were predicted erroneously; overall predictions were even better in the midregion, with only 6 discrepancies in 45 FH variants (11%). We used a CADD threshold of 10 for the C terminus, which minimized discrepancies with experimental data to 20% (7/35) of the FH variants in this region (Figure 3C; Table 3).
Discussion
Testing for genetic variants in complement genes is becoming increasingly recognized as standard of care in the diagnosis and treatment of aHUS.1 The identification of a pathogenic, or likely pathogenic, variant helps to confirm diagnosis, and it can also guide short- and long-term patient management. However, variant classification is not trivial; for many diseases, including aHUS, it is a barrier to the optimal medical use of genetic information. To address this challenge, generalized guidelines for variant interpretation have been established by many organizations, including joint consensus recommendations released by the American College of Medical Genetics and Genomics (ACMG) and the Association for Molecular Pathology (AMP) (ACMG/AMP)28; the AMP, American Society of Clinical Oncology, and College of American Pathologists29; and the European Society for Human Genetics.30 Of the available guidelines, those proposed by the ACMG/AMP have been the most widely adopted.
Included in these guidelines are many metrics by which to grade a variant so that it can be classified as benign, likely benign, of uncertain significance, likely pathogenic, or pathogenic. Variant-specific functional studies that have been validated and shown to be reproducible and robust in clinical diagnostic laboratories provide strong evidence of pathogenicity (ACMG criterion PS3, strong evidence of pathogenicity28), but these types of studies are seldom available because they are costly, time consuming, and not reimbursable. As a surrogate, computational methods and allele frequency are routinely used to score variants, although the level of evidence that they provide is not as strong (ACMG criterion PP3, supporting evidence of pathogenicity28).
In this study, we address the dearth of functional studies for aHUS-associated genetic variants in the CFH gene by expressing and functionally characterizing 105 missense variants in the FH protein, with the goal of improving variant classification and, thereby, patient care. Our results clearly demonstrate the value of functional analyses of FH variants while simultaneously highlighting the limitations of prediction algorithms and allele frequency as surrogate indices of pathogenicity.
Of the 79 previously unstudied aHUS-associated FH variants, a surprisingly high number (50/79; 63%) were functionally undistinguishable from wild-type FH protein; therefore, we classified these variants as benign, following the variant interpretation guidelines from the ACMG and the ACMG/AMP28 (criterion BS3, strong evidence of no pathogenicity). Most of these benign variants are located in the N terminus and midregion of FH. Notably, the midregion of FH is enriched for benign variants (30/32; 94%), supporting the concept that this portion of the protein acts primarily as a spacer between the N-terminal and C-terminal SCRs and, therefore, can tolerate substantial sequence variability. Although the proportion of benign variants at the N terminus is also remarkably high (14/20; 70%), it decreases to only 22% (6/27) at the C terminus. This distribution reflects the well-known critical role played by the C-terminal region of FH in the pathogenesis of aHUS31 and provides strong support for the concept that most variants outside the C-terminal region of FH are likely to be ultrarare polymorphisms unrelated to the pathogenesis of aHUS.
Our data also show that allele frequency is not a useful indicator of pathogenicity when the CFH gene is considered. For example, we found that 77% (36/47) of pathogenic variants and 24% (14/58) of benign variants in this study are absent in gnomAD, making the application of ACMG criterion PM2 (moderate evidence of pathogenicity28) questionable for CFH. Applying prediction algorithms is also of limited value (ACMG criterion PP3, supporting evidence of pathogenicity28). CADD, adjusted with standard settings for genome-wide variant prioritization, was unsatisfactory and incorrectly classified 28 of 105 (27%) of the missense variants that we tested (Figure 3B). Errors were more evident at the N-terminal and C-terminal regions of the FH molecule, where CADD predictions tended to overestimate the number of pathogenic and benign variants, respectively (Figure 3C).
We hypothesized that FH domain–specific metrics would improve CADD performance and used a distribution plot of CADD scores to optimize thresholds for predicting pathogenicity (Figure 3C). By adjusting the CADD threshold to 19 for the N terminus and midregion of FH and by adjusting it to 10 for the C-terminal region, we minimized errors and reduced the number of discrepancies between the predictions and functional data to 17% (Figure 3D). With these CADD adjustments, only 5 discrepancies were found at the N-terminal region. p.Lys82Arg, p.Thr91Ser, and p.Val111Glu were predicted to be pathogenic but, experimentally, we demonstrated normal function, a result that is consistent with the surface-exposed location of these residues, remote from the C3b- and FI-interacting surfaces (Figure 2). The opposite is true for the p.Arg166Leu and p.Arg175Pro variants, which were predicted to be benign but were functionally pathogenic. These variants remove a positively charged amino acid in the middle of the C3b-interacting surface (Figure 2).
In the midregion, all FH variants that were functionally pathogenic (n = 8) were also predicted to be pathogenic and are variants that do not express in vivo (Table 3). However, of the remaining variants in this region, all of which were experimentally benign (n = 37), 6 were erroneously predicted to be pathogenic (Table 3). While we reduced discrepancies between the predicted effect and the observed functional results from 20% (9/45) to 13% (6/45) by raising the CADD threshold to 19, the number of true discrepancies may be smaller. As noted in the “Results,” among our control pathogenic FH variants in the midregion of FH are ones that impair FH expression in vivo; however, in vitro, they are expressed and function normally as recombinant proteins. As such, we cannot exclude the possibility that for these 6 variants, the experimental data reflect only our ability to achieve in vitro expression. In this respect, measurements of plasma levels in carriers of FH variants should be performed routinely to determine whether a FH variant is associated with decreased plasma expression. Whenever possible, a direct measurement of the FH produced by the mutated CFH allele should be obtained and/or FH measurements should be confirmed in asymptomatic relatives, as described previously.32
At the C terminus, adjusting the CADD threshold to 10 reduced prediction discrepancies from 31% (11/35) to 20% (7/35). Two variants, p.Pro1130Leu and p.Glu1135Asp, were predicted to be pathogenic but were functionally normal, consistent with their location on the surface of SCR19, remote from the C3d-interacting region (Figure 2). In contrast, 5 variants were predicted to be benign but were functionally pathogenic. p.Arg1206Cys, like p.Arg1210Cys, generates a free cysteine residue that may form covalent linkages with other serum proteins, as shown previously.8 The 3 other variants (p.Thr1184Ala, p.Thr1184Pro, p.Lys1186Thr) are located within the sialic acid binding site in SCR20. These variants are extremely interesting because binding of FH to sialic acids is critical for the regulatory activity of FH on host surfaces. Failure to bind to sialic acid is a prototypical FH defect in aHUS,10 suggesting that Thr1184 and Lys1186 contribute to the architecture of the sialic acid binding pocket in SCR20. The relevance of the sialic acid binding site by FH in the recognition of host surfaces warrants further experiments to characterize the functional consequences of these variants, as well as those described earlier (p.Ile1169Leu, p.Leu1189Pro, p.Leu1189His, p.Ser1191Trp, p.Glu1198Val), in relation to the binding to sialic acids.
A comparison of the clinical and laboratory data from aHUS patients carrying benign (supplemental Table 1) and pathogenic (supplemental Table 2) FH variants illustrates that, overall, carriers of pathogenic FH variants presented more severe phenotypes than did those carrying benign FH variants. Average age at onset for carriers of pathogenic variants was 17.6 years, with 38% presenting at younger than age 2 years; for carriers of benign variants, average age at onset was 29 years, and only 6% presenting at younger than age 2 years. The likelihood of complete remission also skewed to favor carriers of benign variants (18% vs 27% for pathogenic vs benign variants). Carriers of benign variants also have fewer recurrences (24% vs 71% for pathogenic variants) and were more likely to segregate other genetic risk factors associated with aHUS (49% vs 33%, respectively). Finally, it is noteworthy that FH plasma levels in the carriers of pathogenic FH variants identified 13 variants that were associated with FH quantitative deficiencies; 11 of these 13 variants were difficult to express in vitro in this study.
In summary, we provide detailed functional analysis of 105 FH variants, highlighting the value of these experimental assays in the appropriate classification of FH variants. We show that allele frequency and pathogenicity prediction algorithms, although valuable, should be used circumspectly. For uncharacterized FH variants, we recommend applying specific CADD thresholds to the different domains of FH. This recommendation still has limitations because it only improves the correct classification from 73% to 83% and should be validated with additional studies. Importantly, these in silico predictions must be complemented with precise measurements of plasma FH levels. In the absence of well-characterized functional studies, these steps should allow for correct classification of most novel CFH variants identified in patients with aHUS (supplemental Figure 1). As a whole, this work represents a significant step toward a more complete functional understanding of FH genetic variation in the context of aHUS predisposition.
Acknowledgments
The authors thank Jeffrey Hunter, Keith Bouchard, and Jonathan Mathias (Alexion Pharmaceuticals, Inc) for editorial review of the manuscript.
Conception, design, data collection, and analysis, as well as writing of the manuscript, was performed with support from Alexion Pharmaceuticals, Inc. Editorial support, also funded by Alexion Pharmaceuticals Inc, was provided by Oxford PharmaGenesis (Oxford, United Kingdom). S.R.d.C. was supported by grants from the Spanish Ministerio de Economía y Competitividad–FEDER (Spanish Federation of Rare Diseases) (PID2019-104912RB-I00) and Autonomous Region of Madrid (S2017/BMD-3673). R.J.H.S. was supported, in part, by a grant from National Institutes of Health, National Institute of Diabetes and Digestive and Kidney Diseases (R01 110023).
Authorship
Contribution: H.M.M., Y.Z., R.J.H.S., and S.R.d.C. designed experiments; H.M.M., Y.Z., E.A., R.G., E.G.-R., and M.M. performed research and collected data; H.M.M., Y.Z., E.A., G.d.A., R.G., E.G.-R., R.-R.J., M.M., R.J.H.S., and S.R.d.C. analyzed data; and S.R.d.C. and R.J.H.S. wrote the manuscript, which was revised by the other authors.
Conflict-of-interest disclosure: S.R.d.C. and R.J.H.S. have received honoraria from Alexion Pharmaceuticals for giving lectures and participating in advisory boards. G.d.A. is an employee and shareholder of Alexion Pharmaceuticals, Inc. R.-R.J. is a former employee and shareholder of Alexion Pharmaceuticals, Inc. The remaining authors declare no competing financial interests.
Correspondence: Santiago Rodríguez de Córdoba, Centro de Investigaciones Biológicas Margarita Salas, Ramiro de Maeztu 9, 28040 Madrid, Spain; e-mail: srdecordoba@cib.csic.es; and Richard J. H. Smith, Molecular Otolaryngology and Renal Research Laboratories, Carver College of Medicine, University of Iowa, 285 Newton Rd, 5270 CBRB, Iowa City, IA 52242; e-mail: richard-smith@uiowa.edu.
Data sharing requests should be sent to Santiago Rodríguez de Córdoba (srdecordoba@cib.csic.es).
The online version of this article contains a data supplement.
The publication costs of this article were defrayed in part by page charge payment. Therefore, and solely to indicate this fact, this article is hereby marked “advertisement” in accordance with 18 USC section 1734.

This feature is available to Subscribers Only
Sign In or Create an Account Close Modal