

Key Points
miR-130b induces a Mll-AF4+ mixed/BCP/myeloid lineage acute leukemia propagated by LMPPs.
miR-128a induces a Mll-AF4+ pro-B ALL propagated by Il7r+ckit+ leukemic blasts and maintained by miR-130b.

Abstract
t(4;11) MLL-AF4 acute leukemia is one of the most aggressive malignancies in the infant and pediatric population, yet we have little information on the molecular mechanisms responsible for disease progression. This impairs the development of therapeutic regimens that can address the aggressive phenotype and lineage plasticity of MLL-AF4–driven leukemogenesis. This study highlights novel mechanisms of disease development by focusing on 2 microRNAs (miRNAs) upregulated in leukemic blasts from primary patient samples: miR-130b and miR-128a. We show that miR-130b and miR-128a are downstream targets of MLL-AF4 and can individually drive the transition from a pre-leukemic stage to an acute leukemia in an entirely murine Mll-AF4 in vivo model. They are also required to maintain the disease phenotype. Interestingly, miR-130b overexpression led to a mixed/B-cell precursor (BCP)/myeloid leukemia, propagated by the lymphoid-primed multipotent progenitor (LMPP) population, whereas miR-128a overexpression resulted in a pro-B acute lymphoblastic leukemia (ALL), maintained by a highly expanded Il7r+c-Kit+ blast population. Molecular and phenotypic changes induced by these two miRNAs fully recapitulate the human disease, including central nervous system infiltration and activation of an MLL-AF4 expression signature. Furthermore, we identified 2 downstream targets of these miRNAs, NR2F6 and SGMS1, which in extensive validation studies are confirmed as novel tumor suppressors of MLL-AF4+ leukemia. Our integrative approach thus provides a platform for the identification of essential co-drivers of MLL-rearranged leukemias, in which the preleukemia to leukemia transition and lineage plasticity can be dissected and new therapeutic approaches can be tested.
Introduction
Acute lymphoblastic leukemia (ALL) is one of the most frequent sporadic cancers in the pediatric population.1 The majority of patients respond well to current therapeutic regimens, but patients with t(4;11) MLL-AF4 have a dismal prognosis.2 The development of better treatments relies on extensive knowledge of the molecular mechanisms underlying leukemogenesis. MLL-AF4+ ALL is associated with widespread epigenetic changes, driven and maintained by the MLL-AF4 fusion gene, which lead to the acquisition of stem cell–like features and a survival advantage.3-7 There are few/no cooperating mutations, suggesting that MLL-AF4 alone is sufficient to drive the complete leukemogenesis process.8
Strong evidence supports an in utero origin of the disease9,10; yet, the recapitulation of the human disease in a syngeneic mouse model has proven challenging.11-13 Given the prenatal origin of the disease, it is important to create a model that expresses MLL-AF4 in the physiological and genomic context of embryonic development to understand how MLL-AF4 subverts fetal hematopoiesis, as this is necessary to design new therapies specific to the aggressive infant/pediatric disease. We recently described an MLL-AF4 pre-leukemia mouse model that showed a higher self-renewal and B-lymphoid bias in the Lineage-Sca1+c-Kit+ (LSK) compartment of the fetal liver (FL), but was missing additional factors that would allow development of a full-blown leukemia.14-16
MicroRNAs (miRNAs) are essential regulators of gene expression and key modulators of hematopoiesis and leukemogenesis, but their roles in MLL-AF4–driven leukemogenesis remain elusive.17-19 This study focuses on miR-130b and miR-128a, which we found to be upregulated in the leukemic blasts of MLL-AF4+ ALL patients, but which had not previously been linked to MLL-AF4+ ALL. Both are downstream targets of MLL-AF4. The overexpression of miR-130b in FL Mll-AF4+ LSK pre-leukemic cells caused a mixed/B-cell precursor (BCP)/myeloid leukemia, whereas miR-128a induced a pro-B ALL characterized by the expansion of Il7r+c-Kit+ cells. Both leukemias carried the MLL-AF4 gene-expression signature, became highly penetrant and aggressive upon serial transplantation, and showed central nervous system (CNS) infiltration, a hallmark of the pediatric disease,20 but were propagated by different cell populations. Finally, we identified 2 direct targets of miR-130b and miR-128a that are downregulated in MLL-AF4+ patients (NR2F6 and SGMS1) and determined that they act as tumor suppressor genes. This study provides a novel, clinically relevant syngeneic mouse model and is an important step forward in understanding the etiology and lineage plasticity of t(4;11) MLL-AF4 leukemia.
Methods
miRNA profiling of patients
Primary hematological malignancy samples were provided by the Blood Cancer UK Childhood Leukaemia Cell Bank. Leukemic blasts (CD19+CD10−) were separated into 3 fractions (NG2+CD34+, NG2−CD34+, and CD34−) along with the nonblast population (CD19−CD10−). The staining and sorting procedures are described in the supplemental Materials and methods (available on the Blood Web site). Quantitative reverse transcription-polymerase chain reaction (qRT-PCR) for miRNA was performed with the TaqMan MicroRNA Reverse Transcription Kit and TaqMan Universal Master Mix II, no UNG, according to the manufacturer’s instructions (4366596 and 4440047; ThermoFisher). For the miRNA expression profiling of patients, we used the TaqMan Human Array MicroRNA Cards A+B set v3.0 (4444913; ThermoFisher). Data were acquired on the 7900HT Fast Real-Time PCR System. Differential expression was analyzed with the quantitative high-throughput PCR (HTqPCR) package in R, as described in the supplemental Materials and methods.21
Sorting of human FL hematopoietic cells
Anonymized human FLs from morphologically normal 10- to 20-week-old fetuses were collected after elective medical termination of pregnancy at the Royal Infirmary of Edinburgh after informed written consent was obtained (approved by the Lothian Research Ethics Committee, reference 08/S1101/1). The dissociation, staining, and sorting strategies are described in the supplemental Materials and methods. The following gating strategy was used for human hematopoietic stem and progenitor cells and committed hematopoietic cells: HSC (Lin− CD34+ CD38− CD19− CD45RA− CD90+), MPP (Lin− CD34+ CD38− CD19− CD45RA− CD90−), LMPP (Lin− CD34+ CD38− CD19− CD45RA+), pre-pro-B (Lin− CD34+ CD38+/low CD10− CD19+), pro-B (Lin− CD34+ CD38+/low CD10+ CD19+), B-lymphoid cells (CD34− CD20+), NK cells (CD34− CD56+), T-lymphoid cells (CD34− CD3+), and myeloid cells (CD34− CD33+). miRNA expression was assessed by using the same method as was used for assessing patient blasts.
ATAC-Seq of human and mouse FL LMPP
The Assay for Transposase Accessible Chromatin Sequencing (ATAC-Seq) library generation was performed, with adjustments for human and murine cells. A detailed protocol is included in the supplemental Material and methods. All libraries were sequenced on an Illumina Hi-Seq X Ten to generate 100-bp paired-end reads, and the data were analyzed as described in the supplemental Material and methods. Previously published ATAC-Seq data were obtained from the Gene Expression Omnibus (GEO) accession GSE11786522 for SEM cell replicates 1 and 2, and previously published ChIP-Seq data were obtained from GEO accession GSE84116.13
Mice
All animal work was conducted according to the regulations of the UK Home Office. The inducible Mll-AF4 invertor line23 and the VEC-Cre line24 were crossed to induce Mll-AF4 expression in definitive hematopoietic cells, as described previously.14 The genotyping protocols are included in the supplemental Material and methods. Males and females were mated to obtain embryonic day 14 (E14) embryos, with the day of plug detection being counted as day 0 of embryonic development.
Cell lines
RS4;11 (ATCC CRL-1873), SEM (DSMZ ACC 546), Nalm6 (ATCC CRL-3273), MV4;11 (ATCC CRL-9591), MOLM-13 (DSMZ ACC 554), THP1 (ATCC TIB-202), NOMO1 (DSMZ ACC 542), and Kasumi1 (ATCC CRL-2724) cells were maintained in 20% fetal calf serum (FCS) in RPMI 1640 containing 1% penicillin/streptomycin (P/S) and 1% l-glutamine (cells kindly provided by Mark Dawson and Brian Huntly). Cytogenetics are MLL-AF4+ (RS4;11, SEM, and MV4;11), MLL-AF9+ (MOLM-13, THP1, and NOMO1), ETV6-PDGFRβ (Nalm6), and RUNX1-ETO (Kasumi-1). HEK293T cells (ATCC CRL-3216) were maintained in 10% FCS, 1% P/S, and 1% l-glutamine in Dulbecco’s modified Eagle’s medium.
Sorting of E14 FL hematopoietic cell populations
The extraction, staining, and sorting of E14 FL LSK, E-SLAM HSCs, ckit+ CD34+, and CD45+ CD34− cells are described in the supplemental Materials and methods. We used the following gating strategy for mouse hematopoietic stem and progenitor cells: LSK (Lin− B220− CD19− CD45+ Sca1+ ckit+), HSC/MPP (Lin− B220− CD19− CD45+ Sca1+ ckit+ IL7R− Flt3−), LMPP (Lin− B220− CD19− CD45+ Sca1+ ckit+ Flt3+), and E-SLAM HSC (Lin− CD45+ CD48− CD150+ EPCR+).
Lentivirus production in 293T cells and transduction experiments
For the transduction of leukemia cell lines, filtered supernatant was added directly to the cells, along with polybrene at a final concentration of 4 μg/mL (sc-134220; Santa Cruz Biotechnology). For the transduction of FL LSK or GFP+ mouse leukemic cells, filtered supernatant was added on a nontreated plate coated with RetroNectin Recombinant Human Fibronectin Fragment, according to the manufacturer’s instructions (T100A; Takara Bio Inc). FL LSK and GFP+ mouse leukemic cells were maintained in StemPro-34 serum-free medium (1×; 10639011; ThermoFisher) supplemented with 100 ng/mL stem cell factor, 100 ng/mL TPO, and 50 ng/mL Flt3 (315-14-10, 250-03-10, and 250-31L-10; PeproTech EC Ltd) and transduced twice with a 24-hour interval. After 4 to 6 days in culture, LSK cells were collected and sorted based on their GFP expression. For GFP+ mouse leukemic cells (rescue experiment), nontransduced cells were eliminated through a puromycin treatment. In all cases, lentivirus was removed 48 hours after the initial transduction.
Electroporation of SEM cells with siRNA
Transfection of SEM cells with small interfering RNA (siRNA) against MLL-AF4, miR-128a, and miR-130b, and the negative control was performed as described in the supplemental Materials and methods. The following siRNAs were used: mirVANA miRNA inhibitor (4464076, MH11746, and MH10446; Life Technologies), siRNA control for MA6 (sense, 5′-AAAAGCUGACCUUCUCCAAUG-3′; antisense, 5′-CAUUGGAGAAGGUCAGCUUUUCU-3′), and siMA6 against MLL-AF4 (sense, 5′-AAGAAAAGCAGACCUACUCCA-3′; antisense, 5′-UGGAGUAGGUCUGCUUUUCUUUU-3′).25
Western blot analysis
Protein extraction; gel preparation; and migration, protein transfer, antibody incubation, and detection are described in the supplemental Materials and methods. Image analysis and quantification were performed in Image Lab Software for PC (v6.1; SOFT-LIT-170-9690-ILSPC-V-6-1; BioRad) as described in the supplemental Materials and methods.
Apoptosis assay
Apoptotic cells were detected by double staining with phycoerythrin-annexin V (640907; Biolegend) and SYTOX Blue Dead Cell Stain (S34857; ThermoFisher) in annexin V binding buffer, according to the manufacturer’s instructions (556454; BD Biosciences). Data were acquired on an LSRFortessa (BD Biosciences).
Cell cycle assays of leukemia cell lines
Leukemia cells were fixed and stained in propidium iodide staining solution for 30 to 60 minutes at 37°C (P3566; ThermoFisher). Data were acquired on an LSRFortessa (BD Biosciences).
Transplantation of SEM leukemic cells into NSG mice and flow cytometry
SEM leukemic cells, which express pmiRZip-scramble, pmiRZip-128a, and pmiRZip-130b, were sorted based on GFP expression and injected via tail vein into nonirradiated NSG mice. Cells were injected for latency (5000 cells in 250 μL) and lineage (80 000 cells in 250 μL) studies. More details on the flow cytometry analysis can be found in the supplemental Materials and methods.
Cell cycle assay of transduced E14 FL LSK cells
GFP+ LSK cells were collected in flow cytometry staining buffer and an equivalent volume of 5 μg/mL 4′,6-diamidino-2-phenylindole and 1% IGEPAL (D9542 and CA-630; Sigma-Aldrich) solution was added. Data were acquired on an LSRFortessa (BD Biosciences).
Transplantation of GFP+ FL LSK or GFP+ mouse rescue leukemic cells and flow cytometry analysis of recipients
Transplantation recipients (CD45.1/2 mice aged 8-12 weeks) were irradiated with a total dose of 9.2 Gy (2 doses of 4.6 Gy, 3 hours apart with a split adaptor). GFP+ CD45.2/2 FL LSK cells were transplanted in a volume of 250 μL through tail-vein injection into irradiated CD45.1/2 recipients, along with 20 000 helper bone marrow cells (CD45.1/1). After transplantation, the mice were given antibiotics in their drinking water (0.1 mg/mL enrofloxacin in 10% Batyril solution; Bayer), and blood was collected monthly. Blood counts were measured on a Celltac MEK-6500K (Nihon Kohden). A detailed description of the flow cytometry analysis can be found in the supplemental Materials and methods.
Transplantation of total bone marrow, HSC/MPP, LMPP, LK/CLP, and LSK IL7R+ of sick and control mice
Femur/tibia from sick and control mice were crushed, filtered, and resuspended in 2% FCS/phosphate-buffered saline for injection. For total bone marrow transplants, we injected the equivalent of 2 × 10⁶ cells for an 85% repopulation level in the primary recipient. GFP+ HSC/MPP, LMPP, LK/CLP, and LSK IL7R+ Flt3− were sorted according to the supplemental Materials and methods. Sorted cells were injected in a volume of 250 μL, together with 20 000 bone marrow cells from CD45.1/1 mice, into CD45.1/2 mice (8-12 weeks old) that were irradiated (2 doses of 4.6 Gy, 3 hours apart with a split adaptor).
CFU-C assays
Myeloid and lymphoid CFU-C assays were performed with MethoCult GF M3434 and MethoCult M3630 (03434 and 03630; Stemcell Technologies), respectively. Transduced GFP+ LSK (and FL cells) and bone marrow GFP+ cells from sick mice were plated for 14 or 21 days, respectively. For lymphoid CFU-C assays, the following cytokines were added: Flt3 ligand (20 ng/mL) and stem cell factor (25 ng/mL).
qPCR for mRNA
RNA extraction and reverse transcription were performed with the RNeasy Micro Kit (74004; Qiagen) and the iScript Ready-to-Use cDNA Supermix of iScript Advanced cDNA Synthesis Kit for qRT-PCR (1708841 or 1725037; Bio-Rad Laboratories Ltd) according to the manufacturer’s instructions. Primer sequences can be found in supplemental Table 8. We used the Brilliant III Ultra-Fast SYBR Green qPCR Master Mix according to the manufacturer’s instructions (600883; Agilent). Data were acquired on a QuantStudio 7 Flex Real-Time PCR System (ThermoFisher).
Cytology and CNS Histology
A rapid Romanowsky stain pack was used according to the manufacturer’s instructions (HS705; TCS Bioscience) to stain the peripheral blood smears and cytospins (bone marrow and spleen). Images were acquired on an Inverted Widefield Live Imaging Zeiss Observer with a 20× objective. For CNS histology, murine heads were stripped of soft tissues, fixed in 10% neutral buffered formalin (CellPath, Powys, United Kingdom), and decalcified in Hilleman and Lee EDTA solution (5.5% EDTA in 10% formalin) for 2 to 3 weeks. Samples were then processed on a Tissue-Tek VIP processor with a routine overnight 17.5-hour cycle. After paraffin wax embedding, 2.5-mm sections were cut onto poly-l-silane–coated slides. Sections were stained with Gill’s hematoxylin and Putts eosin (both made in-house). Slides were scanned with a Hamamatsu Nanozoomer Digital Pathology Slide Scanner, and CNS infiltration was assessed and graded by digital slide management/image analysis software from Slidepath (Dublin, Ireland): grade 1, low level leukemic infiltrate; grade 2, low-moderate infiltrate; grade 3, moderate-heavy infiltrate; and grade 4, heavy infiltrate, as previously described.26
Luciferase assay
The cDNA and 3′-untranslated region of NR2F6 and SGMS1 were cloned according to the supplemental Materials and methods. On the day of the transfection, HEK293T cells were seeded in Dulbecco’s modified Eagle’s medium, containing 10% FCS, 1% P/S, and 1% l-glutamine at a concentration of 100 000 cells per well in a 96-well solid white plate (10022561; Fisher Scientific), and the transfection mix was added. Forty-eight hours after transfection, the Firefly and Renilla luciferase activities were measured with the Dual-Glo Luciferase Assay System (E2920; Promega) and a GloMax Discover MicroPlate Reader (GM3000; Promega), according to the manufacturer’s instructions.
miRNA target prediction and data analysis
TargetScan27 and PicTar28 were used to generate a list of in silico target genes for miR-130b and miR-128a in human and mouse. Graphs were generated with Prism 6 (GraphPad) with statistical tests specified in the figure legends. A Gehan-Breslow-Wilcoxon test was used to compare survival curves (Figures 1, 3, 6, and 7). miRNA expression profiling was analyzed with the HTqPCR package in R, with a limma test and normalization of the geometric mean. Heat maps were generated using Heatmapper.29
Results
miR-130b and miR-128a are upregulated in patient blasts and have tumorigenic functions in MLL-AF4+ B-ALL cells
We obtained bone marrow (BM) aspirates of 6 infant/pediatric t(4;11) MLL-AF4 BCP ALL patients at diagnosis and remission (supplemental Table 1) and compared the expression profile of 754 miRNAs in all MLL-AF4+ leukemic blasts at diagnosis (CD19+CD10−CD34+/−NG2+/−) to that of nonblast cells at remission (CD19−CD10−) (Figure 1A; supplemental Figure 1A).21 According to published studies, this nonblast population contains mostly T cells, some natural killer (NK) cells and hematopoietic stem/progenitor cells (HSPCs), and few myeloid cells.30,31 We included CD34 and NG2 in our sorting strategy as they are expressed on MLL-AF4+ patient blasts and leukemia-propagating cells.32,33 We identified 66 miRNAs that are upregulated and 19 that are downregulated in patient blasts (Figure 1B; supplemental Table 2). In support of our experimental strategy, miR-196b, which has been linked to MLL-AF4+ leukemia, showed the second highest upregulation (supplemental Figure 1B; supplemental Table 2).34 Among the miRNAs significantly upregulated were miR-130b and miR-128a (Figure 1C-D), which have not been studied in MLL-AF4–driven leukemogenesis.
![MiR-130b and miR-128a are upregulated in patient blasts and have tumorigenic functions in MLL-AF4+ B-ALL cells. (A) Experimental approach and sorting strategy of BM cells from patients. (B) Differential expression analysis of miRNAs in blasts at diagnosis (CD19+CD10−NG2+CD34+, CD19+CD10−NG2−CD34+ and CD19+CD10−CD34−) vs nonblasts at remission (CD19−CD10−). Data were compared using a limma test. Expression of (C) miR-130b and (D) miR-128a in patients’ leukemic blasts (diagnosis), nonblasts (remission), and human FL (huFL) hematopoietic cells (10-20 weeks postconception [wpc]). (E) ATAC-Seq profiles of human FL LMPP derived from 10 to 20 wpc (n = 2) and SEM cells (GSE117865) alongside FLAG-MLL-Af4 chromatin immunoprecipitation (ChIP) sequencing (ChIP-Seq) profiles of miR-130b and miR-128a loci in MLL-Af4 human leukemic blasts (GSE84116). The gray box highlights the promoter that regulates each miRNA. Arrows indicate an open chromatin region or a chromatin region with MLL-AF4 binding. Expression of MLL-AF4, MEIS1, HOXA9, CDK6, BCL2, miR-130b, and miR-128a in SEM cells transfected with siRNA against MLL-AF4 (siMA6) after (F) 48 hours and (G) 72 hours. The log2-fold change (LOG2FC) is calculated using SEM sicontrol as a reference. (H) Proliferation after 72 hours in culture (initial cell concentration, 105 cells per milliliter) and (I) apoptosis assay in SEM cells when the activity of miR-130b and/or miR-128a is inhibited (pmiRZip-130b/128a). pmiRZip-scramble was used as a control. (J) Survival curve of SEM pmiRZip-scramble–, pmiRZip-130b– and pmiRZip-128a–engrafted NSG recipients. MiRNA inhibition in leukemic cells was achieved through lentiviral transduction and monitored with GFP. Unless stated otherwise, data were compared using a Mann-Whitney U test: *P < .05; **P < .01; ***P < .001; ****P < .0001. Experiments were conducted in triplicate or more. Graphs are presented as mean ± standard error of the mean. NS, not significant; snRNA, small nuclear RNA.](https://ash.silverchair-cdn.com/ash/content_public/journal/blood/138/21/10.1182_blood.2020006610/5/m_bloodbld2020006610f1a.png?Expires=1764975089&Signature=Zg6oTruvzbTDxwDpH~F8CYbHFcFo5qvTxtbMv2G2Byj56mOuWm5dSaiKZcRGt95XAC~0nCe6d9yyjCUG6bBfkzFgQOB~FsraEXJ98SthZoTViyW41lUw~LhBUIsdr7b0U0KGDP3Hicv5Hnd-Elg67OZYSY6v7ViVuGy-GzIFaAor4CVY9VPzlcZXYnjX~ZBm3~tIZpZC4-22LaJSXPk5xPHvSazJqhE7e3vQIWxq1lUAHUltFJLJoiiSllN3lhhtgcL3ZC4L2Sbx0fMnwr1gBZigRlQAiUo3DY3e7csot5GnLJsXuRDztr44LFeVAVJqwiMwYmScl1T-3t7nz~217Q__&Key-Pair-Id=APKAIE5G5CRDK6RD3PGA)
![MiR-130b and miR-128a are upregulated in patient blasts and have tumorigenic functions in MLL-AF4+ B-ALL cells. (A) Experimental approach and sorting strategy of BM cells from patients. (B) Differential expression analysis of miRNAs in blasts at diagnosis (CD19+CD10−NG2+CD34+, CD19+CD10−NG2−CD34+ and CD19+CD10−CD34−) vs nonblasts at remission (CD19−CD10−). Data were compared using a limma test. Expression of (C) miR-130b and (D) miR-128a in patients’ leukemic blasts (diagnosis), nonblasts (remission), and human FL (huFL) hematopoietic cells (10-20 weeks postconception [wpc]). (E) ATAC-Seq profiles of human FL LMPP derived from 10 to 20 wpc (n = 2) and SEM cells (GSE117865) alongside FLAG-MLL-Af4 chromatin immunoprecipitation (ChIP) sequencing (ChIP-Seq) profiles of miR-130b and miR-128a loci in MLL-Af4 human leukemic blasts (GSE84116). The gray box highlights the promoter that regulates each miRNA. Arrows indicate an open chromatin region or a chromatin region with MLL-AF4 binding. Expression of MLL-AF4, MEIS1, HOXA9, CDK6, BCL2, miR-130b, and miR-128a in SEM cells transfected with siRNA against MLL-AF4 (siMA6) after (F) 48 hours and (G) 72 hours. The log2-fold change (LOG2FC) is calculated using SEM sicontrol as a reference. (H) Proliferation after 72 hours in culture (initial cell concentration, 105 cells per milliliter) and (I) apoptosis assay in SEM cells when the activity of miR-130b and/or miR-128a is inhibited (pmiRZip-130b/128a). pmiRZip-scramble was used as a control. (J) Survival curve of SEM pmiRZip-scramble–, pmiRZip-130b– and pmiRZip-128a–engrafted NSG recipients. MiRNA inhibition in leukemic cells was achieved through lentiviral transduction and monitored with GFP. Unless stated otherwise, data were compared using a Mann-Whitney U test: *P < .05; **P < .01; ***P < .001; ****P < .0001. Experiments were conducted in triplicate or more. Graphs are presented as mean ± standard error of the mean. NS, not significant; snRNA, small nuclear RNA.](https://ash.silverchair-cdn.com/ash/content_public/journal/blood/138/21/10.1182_blood.2020006610/5/m_bloodbld2020006610f1b.png?Expires=1764975089&Signature=cxK5Tf-cx1mCOfDjSHofkRm3W6O0s093mcclg71RtCcdZusca9wyvUWhMFSK8h1Enrn0wQNDygcOgU0iZ4TVtBSNV6mfKfeW4XN8vgVHNAZS29fLFAs9qb1kzxR1TNVzTQpEdv5Dxltqf8mNMikWUMD8I07GCbhVBMVuUxG13a~V2O7OjMOGWpbiLdnaMvUkTlir7I6WDdU9eBF9Si~Wsw65HyO2IWpSMyVu7ujpDcivqTO3w2Q0jD9hjHywIdD-GMH4wlFzdNlAUdjU~WKXKG4QchY2bHHr7y7onRR76Tikh9i4emzFpClqy6cEDcxNdP-q-BRT0cFQTd0jgBxWQA__&Key-Pair-Id=APKAIE5G5CRDK6RD3PGA)
MiR-130b and miR-128a are upregulated in patient blasts and have tumorigenic functions in MLL-AF4+ B-ALL cells. (A) Experimental approach and sorting strategy of BM cells from patients. (B) Differential expression analysis of miRNAs in blasts at diagnosis (CD19+CD10−NG2+CD34+, CD19+CD10−NG2−CD34+ and CD19+CD10−CD34−) vs nonblasts at remission (CD19−CD10−). Data were compared using a limma test. Expression of (C) miR-130b and (D) miR-128a in patients’ leukemic blasts (diagnosis), nonblasts (remission), and human FL (huFL) hematopoietic cells (10-20 weeks postconception [wpc]). (E) ATAC-Seq profiles of human FL LMPP derived from 10 to 20 wpc (n = 2) and SEM cells (GSE117865) alongside FLAG-MLL-Af4 chromatin immunoprecipitation (ChIP) sequencing (ChIP-Seq) profiles of miR-130b and miR-128a loci in MLL-Af4 human leukemic blasts (GSE84116). The gray box highlights the promoter that regulates each miRNA. Arrows indicate an open chromatin region or a chromatin region with MLL-AF4 binding. Expression of MLL-AF4, MEIS1, HOXA9, CDK6, BCL2, miR-130b, and miR-128a in SEM cells transfected with siRNA against MLL-AF4 (siMA6) after (F) 48 hours and (G) 72 hours. The log2-fold change (LOG2FC) is calculated using SEM sicontrol as a reference. (H) Proliferation after 72 hours in culture (initial cell concentration, 105 cells per milliliter) and (I) apoptosis assay in SEM cells when the activity of miR-130b and/or miR-128a is inhibited (pmiRZip-130b/128a). pmiRZip-scramble was used as a control. (J) Survival curve of SEM pmiRZip-scramble–, pmiRZip-130b– and pmiRZip-128a–engrafted NSG recipients. MiRNA inhibition in leukemic cells was achieved through lentiviral transduction and monitored with GFP. Unless stated otherwise, data were compared using a Mann-Whitney U test: *P < .05; **P < .01; ***P < .001; ****P < .0001. Experiments were conducted in triplicate or more. Graphs are presented as mean ± standard error of the mean. NS, not significant; snRNA, small nuclear RNA.
MiR-130b and miR-128a are upregulated in patient blasts and have tumorigenic functions in MLL-AF4+ B-ALL cells. (A) Experimental approach and sorting strategy of BM cells from patients. (B) Differential expression analysis of miRNAs in blasts at diagnosis (CD19+CD10−NG2+CD34+, CD19+CD10−NG2−CD34+ and CD19+CD10−CD34−) vs nonblasts at remission (CD19−CD10−). Data were compared using a limma test. Expression of (C) miR-130b and (D) miR-128a in patients’ leukemic blasts (diagnosis), nonblasts (remission), and human FL (huFL) hematopoietic cells (10-20 weeks postconception [wpc]). (E) ATAC-Seq profiles of human FL LMPP derived from 10 to 20 wpc (n = 2) and SEM cells (GSE117865) alongside FLAG-MLL-Af4 chromatin immunoprecipitation (ChIP) sequencing (ChIP-Seq) profiles of miR-130b and miR-128a loci in MLL-Af4 human leukemic blasts (GSE84116). The gray box highlights the promoter that regulates each miRNA. Arrows indicate an open chromatin region or a chromatin region with MLL-AF4 binding. Expression of MLL-AF4, MEIS1, HOXA9, CDK6, BCL2, miR-130b, and miR-128a in SEM cells transfected with siRNA against MLL-AF4 (siMA6) after (F) 48 hours and (G) 72 hours. The log2-fold change (LOG2FC) is calculated using SEM sicontrol as a reference. (H) Proliferation after 72 hours in culture (initial cell concentration, 105 cells per milliliter) and (I) apoptosis assay in SEM cells when the activity of miR-130b and/or miR-128a is inhibited (pmiRZip-130b/128a). pmiRZip-scramble was used as a control. (J) Survival curve of SEM pmiRZip-scramble–, pmiRZip-130b– and pmiRZip-128a–engrafted NSG recipients. MiRNA inhibition in leukemic cells was achieved through lentiviral transduction and monitored with GFP. Unless stated otherwise, data were compared using a Mann-Whitney U test: *P < .05; **P < .01; ***P < .001; ****P < .0001. Experiments were conducted in triplicate or more. Graphs are presented as mean ± standard error of the mean. NS, not significant; snRNA, small nuclear RNA.
We assessed miR-130b and miR-128a expression in human hematopoietic cells (hematopoietic stem cells [HSCs], multipotent progenitors [MPPs], lymphoid-primed multipotent progenitors [LMPPs], pre-pro-B, pro-B, B/T/NK lymphoid cells, M/myeloid cells) and CD34− cells derived from 10- to 20-week postconception FL (supplemental Table 3). miR-130b expression was significantly higher in MLL-AF4+ patient blasts compared with human FL LMPP, pro-B, B, T, and NK cells (Figure 1C), whereas miR-128a expression was low/absent in all FL hematopoietic cells (Figure 1D). In patient blasts, miR-128a expression was generally higher than that of miR-130b and positively correlated with a younger age of onset and a lower white blood cell count (supplemental Figure 1B-D). miR-130b upregulation was confined to the NG2+CD34+ and NG2−CD34+ populations (supplemental Figure 1E), whereas miR-128a was similar between all 3 blast subtypes (supplemental Figure 1F). In mouse tissues, miR-130b and miR-128a expression is low in normal E14 FL hematopoietic cells and in fetal and adult HSCs compared with miR-126, a known HSC regulator35 (supplemental Figure 1G-H). This suggests that MLL-AF4+ leukemic blasts have a high expression of miR-130b and miR-128a compared with normal hematopoietic cells.
We assessed miR-130b and miR-128a promoter accessibility in one of the candidate cells-of-origin of MLL-AF4–driven leukemogenesis: human FL LMPP. Using ATAC-Seq, we revealed that miR-301b/miR-130b and miR-128a (R3HDM1 host gene) promoters are accessible in human FL LMPPs. This region is also open in MLL-AF4+ leukemic SEM cells36 and coincides with MLL-Af4 binding in B-cell ALL (B-ALL) blasts13 (Figure 1E; supplemental Figure 10) and MLL-AF4 in SEM cells7 (data not shown). miR-130b and miR-128a showed a significantly higher expression in RS4;11 and SEM MLL-AF4+ ALL cells compared with non-MLL-rearranged Nalm6 ALL and MLL/non-MLL-rearranged myeloid leukemia cell lines (supplemental Figure 2A-B). Upon MLL-AF4 inhibition in SEM cells by a specific small interfering RNA (siRNA; siMA6) that decelerates their proliferation25 (supplemental Figure 2C-D), we observed a significant downregulation of MLL-AF4 and its transcriptional targets (MEIS1, HOXA9, CDK6, BCL2), as well as miR-130b and miR-128a (Figure 1F-G). These results highlight 2 new MLL-AF4 target genes: miR-130b and miR-128a.
To gain an initial insight into their importance in MLL-AF4+ leukemia, we stably inhibited the activity of miR-130b and miR-128a in human leukemia cell lines using commercially available short hairpin RNA (pmiRZip). miR-130b or miR-128a single inhibition reduced SEM and RS4;11 cell proliferation (Figure 1H; supplemental Figure 2E). Strikingly, miR-130b and miR-128a dual inhibition led to a massive increase in SEM cell death (Figure 1I), whereas RS4;11 cells were more sensitive to miR-130b single inhibition (supplemental Figure 2F).
We also verified the disease-propagating potential of SEM cells transplanted into NSG mice upon miRNA inhibition. SEM pmiRZip-130b-engrafted NSG mice had a significantly longer survival (81 days) compared with SEM control- or pmiRZip-128a–engrafted NSG mice (58 days) (Figure 1J). This striking difference could be partly due to the long-term and maintained downregulation of miR-128a in SEM pmiRZip-130b cells (supplemental Figure 2G), whereas SEM control and pmiRZip-128a cells have similar expression of miR-130b (supplemental Figure 2H). SEM pmiRZip-130b–engrafted NSG mice had diminished splenohepatomegaly and engraftment in peripheral blood and liver (supplemental Figure 2I-J). Finally, miR-130b inhibition decreased the proportion of SEM cells that express the CD33 myeloid marker whereas miR-128a inhibition increased CD33 positivity (supplemental Figure 2L). These data suggest that miR-130b and miR-128a affect the survival and lineage plasticity of B-ALL leukemia cells and led us to investigate their role in MLL-AF4+ leukemogenesis, starting at the pre-leukemia stage in our mouse model.14
miR-130b and miR-128a promote B-lymphoid bias of FL Mll-AF4+ preleukemic cells
We detected low/intermediate expression of miR-130b and miR-128a in murine FL HSCs/MPPs and LMPPs (Figure 2A), from which MLL-AF4+ leukemia is thought to originate.14,15,37 This expression pattern remains stable upon Mll-AF4 induction, suggesting that the overexpression seen in patients is not recapitulated in pre-leukemic mice. We investigated chromatin accessibility in mouse FL LMPPs (wild type [WT] and Mll-AF4+ VEC-Cre+) by ATAC-Seq (Figure 2B) and revealed that the miR-301b/miR-130b and miR-128a (R3hdm1 host gene) promoters displayed similar accessibility to that seen in human cells (Figure 1E); however, the accessibility of these promoters decreased upon Mll-AF4 expression. This is in line with the absence of Mll-AF4–induced upregulation of miR-130b and miR-128a expression in mouse FL cells (Figure 2A). Thus, we overexpressed each miRNA individually in FL LSK cells, which contain HSC/MPPs and LMPPs, from control (Mll-AF4− VEC-Cre+) and Mll-AF4+ (Mll-AF4+ VEC-Cre+) mice and carried out functional validation (Figure 2C-E). In colony-forming assays, miR-130b overexpression maintained the myeloid clonogenic potential of Mll-AF4+ FL LSK whereas miR-128a decreased it (Figure 2F). Both miRNAs increased the B-lymphoid clonogenic potential (Figure 2G). MiR-130b also increased cell proliferation in myeloid conditions, whereas miR-128a increased proliferation in B-lymphoid conditions (Figure 2H). These effects were specific to Mll-AF4+ cells, but did not lead to immortalization in vitro (supplemental Figure 2M-N). These results indicate that miR-130b and miR-128a enhance the Mll-AF4–mediated hematopoietic clonogenic potential in vitro, especially of the B-lymphoid lineage.
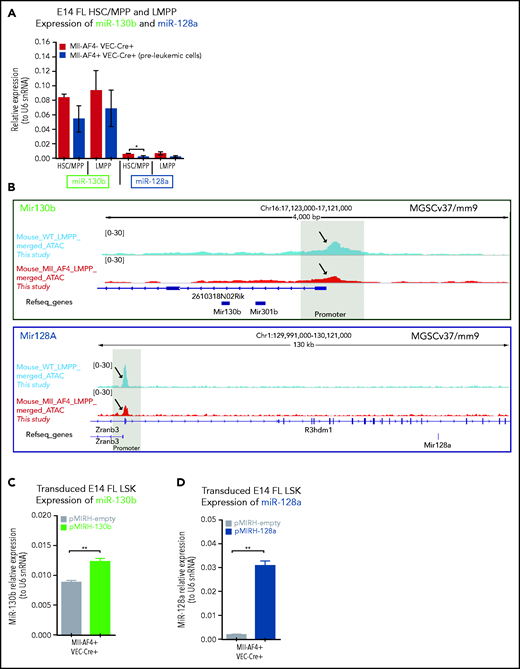
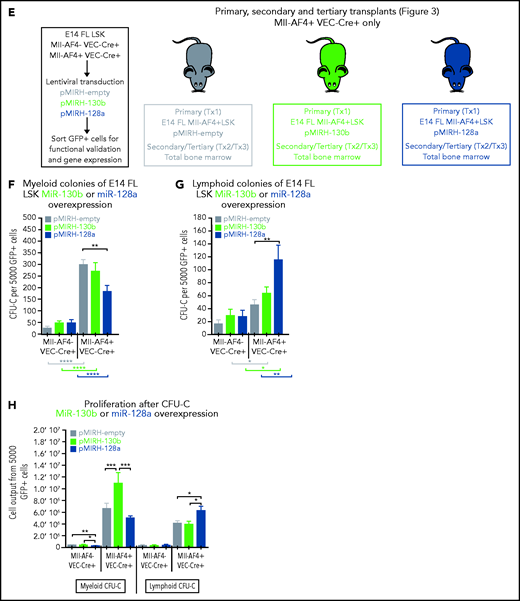
MiR-130b and miR-128a promote the B-lymphoid bias of FL Mll-AF4+ preleukemic cells. (A) Expression of miR-130b and miR-128a in E14 FL HSCs/MPPs and LMPPs from Mll-AF4- VEC-Cre+ and Mll-AF4+ VEC-Cre+ embryos. (B) ATAC-Seq of mouse E14.5 FL LMPPs (WT and Mll-AF4+ VEC-Cre+). Each trace represents a pool of 4 biological replicates. The gray box highlights the promoter that regulates each miRNA. Arrows indicate an open chromatin region. (C) Expression of miR-130b or (D) miR-128a in transduced FL Mll-AF4+ LSK. (C) Expression of miR-130b or (D) miR-128a in transduced FL Mll-AF4+ LSK. (E) Experimental approach for the lentiviral transduction of FL Mll-AF4+ LSK and functional validation. Transduced cells were monitored with GFP expression. Clonogenic potential of transduced LSK in (F) myeloid and (G) B-lymphoid conditions. (H) Proliferation of myeloid and lymphoid cells in colony-forming assays. Data were compared using a Mann-Whitney U test: *P < .05; **P < .01; ***P < .001; ****P < .0001. Experiments were conducted in triplicate or more. Graphs are presented as mean ± standard error of the mean. CFU-C, colony-forming unit cell.
MiR-130b and miR-128a promote the B-lymphoid bias of FL Mll-AF4+ preleukemic cells. (A) Expression of miR-130b and miR-128a in E14 FL HSCs/MPPs and LMPPs from Mll-AF4- VEC-Cre+ and Mll-AF4+ VEC-Cre+ embryos. (B) ATAC-Seq of mouse E14.5 FL LMPPs (WT and Mll-AF4+ VEC-Cre+). Each trace represents a pool of 4 biological replicates. The gray box highlights the promoter that regulates each miRNA. Arrows indicate an open chromatin region. (C) Expression of miR-130b or (D) miR-128a in transduced FL Mll-AF4+ LSK. (C) Expression of miR-130b or (D) miR-128a in transduced FL Mll-AF4+ LSK. (E) Experimental approach for the lentiviral transduction of FL Mll-AF4+ LSK and functional validation. Transduced cells were monitored with GFP expression. Clonogenic potential of transduced LSK in (F) myeloid and (G) B-lymphoid conditions. (H) Proliferation of myeloid and lymphoid cells in colony-forming assays. Data were compared using a Mann-Whitney U test: *P < .05; **P < .01; ***P < .001; ****P < .0001. Experiments were conducted in triplicate or more. Graphs are presented as mean ± standard error of the mean. CFU-C, colony-forming unit cell.
The overexpression of miR-130b and miR-128a in Mll-AF4+ FL LSK leads to a mixed/BCP/myeloid or pro-B lymphoblastic acute leukemia, respectively
To assess the consequences of miR-130b or miR-128a overexpression in MLL-AF4–driven leukemogenesis, we transplanted transduced/GFP+ FL Mll-AF4+ LSK and monitored primary recipients for 18 months (Figure 3A). Detailed postmortem analysis is included (supplemental Tables 4 and 5). Only 1 of 15 primary recipients from the control cohort (FL Mll-AF4+ LSK pMIRH/pmiRZip-scramble) developed a hematological malignancy with enlarged spleen and an expansion of mature B-lymphoid cells, but the green fluorescent protein (GFP) chimerism decreased upon serial transplantation (supplemental Figure 3A-B). Similar to previous studies, this suggests an incomplete transformation.14-16 Five of 7 FL Mll-AF4+ LSK pMIRH-130b primary recipients and 5 of 9 FL Mll-AF4+ LSK pMIRH-128a primary recipients developed a hematological malignancy with splenohepatomegaly and pale bones (Figure 3B-C; supplemental Table 4).


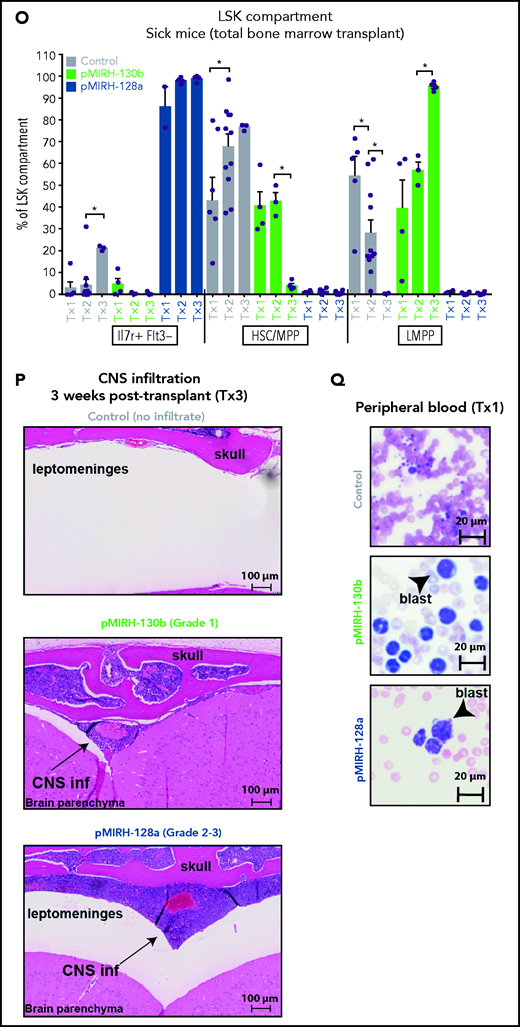
The overexpression of miR-130b and miR-128a in Mll-AF4+ FL LSK leads to a mixed/BCP/myeloid or lymphoblastic acute leukemia, respectively. (A) Experimental design. All mice received Mll-AF4–expressing cells. (B-C) Survival curve of primary, secondary, and tertiary recipients of the Mll-AF4+ pMIRH-130b (B) and Mll-AF4+ pMIRH-128a (C) cohorts. Total BM from 1 to 2 primary recipients was used for secondary transplants. Total BM from 2 to 3 recipients was used for tertiary transplants. Positive event = hematological malignancy linked to donor cells. A Gehan-Breslow-Wilcoxon test was used to compare survival curves. (D) Types of malignancies in Mll-AF4+ control, Mll-AF4+ pMIRH-130b, and Mll-AF4+ pMIRH-128a primary recipients. A χ2 test was used to compare the distribution of sick and non-sick mice. (E) Postmortem pictures of sick mice from the Mll-AF4+ control, Mll-AF4+ pMIRH-130b, and Mll-AF4+ pMIRH-128a cohorts. (F-G)) Spleen (F) and liver (G) weights. (H) GFP chimerism in the BM. (I) White blood cell (WBC) counts in Mll-AF4+ control and sick mice. (J-N) Proportion of myeloid cells (J), mixed lineage cells (K), B-lymphoid cells (L), c-Kit+ cells (M), and IgM+ and Il7r+ cells (N) in the GFP+ fraction of the BM of Mll-AF4+ control and sick mice (Mll-AF4+ pMIRH-130b or Mll-AF4+ pMIRH-128a). (O) Proportion of LSK Il7r+Flt3−, HSCs/MPPs (LSK Il7r− Flt3−), and LMPPs (LSK Flt3+) in the LSK compartment of control and sick mice. (P) CNS infiltration in Mll-AF4+ control, Mll-AF4+ pMIRH-130b, and Mll-AF4+ pMIRH-128a mice. The level of infiltration is described in “Methods.” (Q) Romanowsky staining of peripheral blood smears; scale bars, 20 μm. Data were compared using a Mann-Whitney U test. *P < .05; **P < .01; ***P < .001; ****P < .0001. Graphs are presented as mean ± standard error of the mean (1 dot = 1 mouse).
The overexpression of miR-130b and miR-128a in Mll-AF4+ FL LSK leads to a mixed/BCP/myeloid or lymphoblastic acute leukemia, respectively. (A) Experimental design. All mice received Mll-AF4–expressing cells. (B-C) Survival curve of primary, secondary, and tertiary recipients of the Mll-AF4+ pMIRH-130b (B) and Mll-AF4+ pMIRH-128a (C) cohorts. Total BM from 1 to 2 primary recipients was used for secondary transplants. Total BM from 2 to 3 recipients was used for tertiary transplants. Positive event = hematological malignancy linked to donor cells. A Gehan-Breslow-Wilcoxon test was used to compare survival curves. (D) Types of malignancies in Mll-AF4+ control, Mll-AF4+ pMIRH-130b, and Mll-AF4+ pMIRH-128a primary recipients. A χ2 test was used to compare the distribution of sick and non-sick mice. (E) Postmortem pictures of sick mice from the Mll-AF4+ control, Mll-AF4+ pMIRH-130b, and Mll-AF4+ pMIRH-128a cohorts. (F-G)) Spleen (F) and liver (G) weights. (H) GFP chimerism in the BM. (I) White blood cell (WBC) counts in Mll-AF4+ control and sick mice. (J-N) Proportion of myeloid cells (J), mixed lineage cells (K), B-lymphoid cells (L), c-Kit+ cells (M), and IgM+ and Il7r+ cells (N) in the GFP+ fraction of the BM of Mll-AF4+ control and sick mice (Mll-AF4+ pMIRH-130b or Mll-AF4+ pMIRH-128a). (O) Proportion of LSK Il7r+Flt3−, HSCs/MPPs (LSK Il7r− Flt3−), and LMPPs (LSK Flt3+) in the LSK compartment of control and sick mice. (P) CNS infiltration in Mll-AF4+ control, Mll-AF4+ pMIRH-130b, and Mll-AF4+ pMIRH-128a mice. The level of infiltration is described in “Methods.” (Q) Romanowsky staining of peripheral blood smears; scale bars, 20 μm. Data were compared using a Mann-Whitney U test. *P < .05; **P < .01; ***P < .001; ****P < .0001. Graphs are presented as mean ± standard error of the mean (1 dot = 1 mouse).
To assess the transformation of GFP+ cells of pMIRH-130b and pMIHR-128a sick mice, we performed secondary/tertiary transplantations of total BM from sick mice that harbored an immature B-lymphoid phenotype (mixed/BCP/myeloid or pro-B) (Figure 3D). Mice with a myeloid disease showed weak transformation through serial transplantation as the vast majority of recipients remained disease-free (data not shown), which corroborates with MLL-AF4 being more potent in a B-lymphoid context.13,38 All secondary/tertiary recipients in pMIRH-130b and pMIRH-128a cohorts developed a hematological malignancy (Figure 3B-C). The latency became significantly shorter, suggesting progressing aggressiveness. Sick mice suffered from splenohepatomegaly, pale bones, and their BM contained close to 100% GFP+ cells (Figure 3E-H). pMIRH-130b sick mice also presented with an elevated white blood cell count (Figure 3I) and decreased platelet/red blood cell counts (supplemental Figure 3C-D). GFP+ cells also invaded the peripheral blood, spleen, liver, and lung (supplemental Figure 3F-I).
We next analyzed the cell-surface phenotype of GFP+ cells in the BM. In addition to a slight increase in B220−CD11b+Gr1+ myeloid cells, pMIRH-130b sick mice showed a striking expansion of mixed lineage cells (Figure 3J-K). These populations were absent in pMIRH-128a sick mice. pMIRH-130b sick mice had expanded B220+CD19− immature B cells at the expense of B220+CD19+ B-cells, which were also lost in pMIRH-128a sick mice (Figure 3L). The T-cell compartment was reduced/absent in pMIRH-128a sick mice (supplemental Figure 3E). Hence, miR-128a arrested the maturation of all blood lineages and all GFP+ cells were ckit+IgM-Il7r+ (Figure 3M-N). All hematopoietic phenotypes were recapitulated in the peripheral blood, spleen, liver, and lung (supplemental Figure 3F-I). Finally, we detected an increase in Flt3+ and Sca1+ cells in pMIRH-130b and pMIRH-128a sick mice, respectively (supplemental Figure 3J-K). This increased the LSK and Lin-ckit+/common lymphoid progenitor (LK/CLP) compartments in pMIRH-128a sick mice, suggesting that GFP+ cells maintained their stem cell phenotype and were completely blocked at the pro-B stage (supplemental Figure 3L-M). Although the LSK compartment in pMIRH-128a sick mice was almost 100% Il7r+Flt3− in all recipients, we observed an increase in the LMPP fraction upon serial transplantation in pMIRH-130b sick mice (Figure 3O).
One of the hallmarks of t(4;11) MLL-AF4 BCP-ALL is infiltration of the CNS by leukemic blasts.20,26 This was absent in control mice, but pMIRH-130b and especially pMIRH-128a sick mice showed significant blast infiltration in the leptomeninges (Figure 3P). We detected cells with a blast appearance in the peripheral blood, BM, and spleen of pMIRH-130b and pMIRH-128a sick mice (Figure 3Q; supplemental Figure 3N). Overall, the individual overexpression of miR-130b or miR-128a in Mll-AF4+ FL LSK caused hematological malignancies with all of the phenotypic features seen in MLL-AF4+ leukemia patients.
Mll-AF4+ pMIRH-130b/pMIRH-128a+ cells display a gene-expression profile similar to MLL-AF4+ patient blasts
To further characterize the phenotype, we conducted gene-expression analyses of key players in MLL-AF4+ leukemogenesis (supplemental Table 6) in pre-leukemia cells (transduced/GFP+ FL Mll-AF4+ LSK pre-transplantation) and Mll-AF4+ BM cells (control/pMIRH, pMIRH-130b/128a sick mice).15,39-41 At the pre-leukemia stage, miR-130b and miR-128a overexpression led to an upregulation of Mll-AF4 (Figure 4A) and components of the Mll-AF4 transcriptional machinery (Mll, Af4, Ledgf, Ccnt1, Zfp64, Brd4), resulting in a significant upregulation of Flt3, Hoxa9, and Lmo2 (Figure 4B-C). E2a was also upregulated, which partly explains the increased B-lymphoid clonogenic potential (Figures 2G and 4B-C). Cdk9 was upregulated in the presence of miR-130b, whereas miR-128a caused downregulation of Gsk3b and upregulation of Cdk6 and Pax5 (Figure 4B-C).
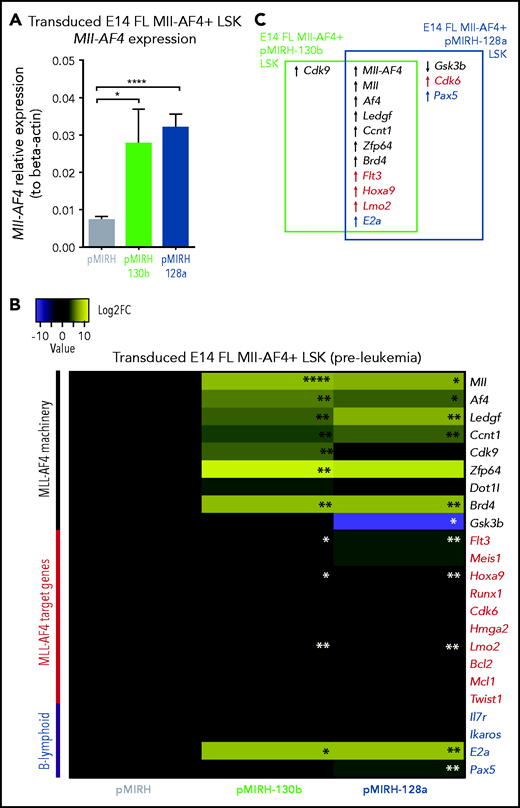
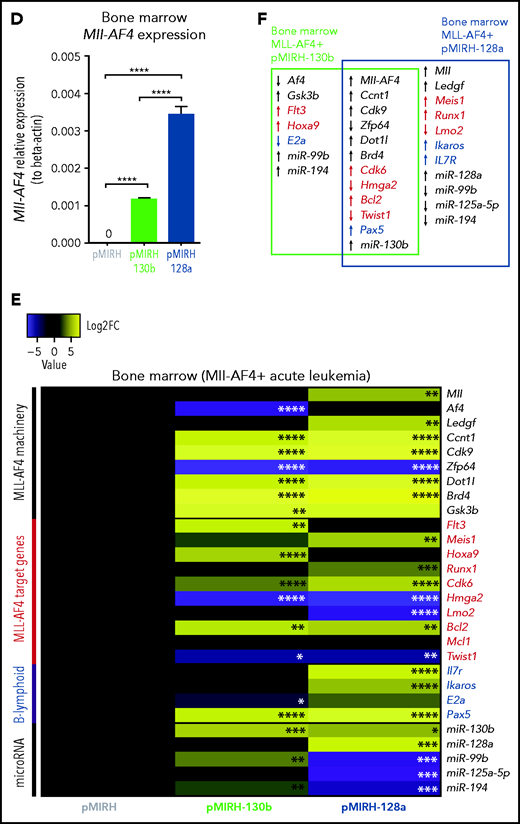
Mll-AF4+ pMIRH-130b/pMIRH-128a+ cells display a gene expression profile similar to MLL-AF4+ patient blasts. (A) Mll-AF4 expression in transduced/GFP+ E14 FL Mll-AF4+ LSK (preleukemia and pretransplantation). (B) Heatmap of gene expression in transduced E14 FL Mll-AF4+ LSK. (C) Summary of the gene expression results of transduced E14 FL Mll-AF4+ LSK. (D) Mll-AF4 expression in total BM cells of control and leukemic mice. (E) Heatmap of gene expression in total BM cells. (F) Summary of the gene-expression results of total BM cells. Data were compared using a Mann-Whitney U test. *P < .05; **P < .01; ***P < .001; ****P < .0001. Experiments were conducted in triplicate or more. Heatmaps present the log2 fold change (log2FC) of gene expression, using Mll-AF4+ pMIRH (Control) as a reference.
Mll-AF4+ pMIRH-130b/pMIRH-128a+ cells display a gene expression profile similar to MLL-AF4+ patient blasts. (A) Mll-AF4 expression in transduced/GFP+ E14 FL Mll-AF4+ LSK (preleukemia and pretransplantation). (B) Heatmap of gene expression in transduced E14 FL Mll-AF4+ LSK. (C) Summary of the gene expression results of transduced E14 FL Mll-AF4+ LSK. (D) Mll-AF4 expression in total BM cells of control and leukemic mice. (E) Heatmap of gene expression in total BM cells. (F) Summary of the gene-expression results of total BM cells. Data were compared using a Mann-Whitney U test. *P < .05; **P < .01; ***P < .001; ****P < .0001. Experiments were conducted in triplicate or more. Heatmaps present the log2 fold change (log2FC) of gene expression, using Mll-AF4+ pMIRH (Control) as a reference.
Mll-AF4 was detected in pMIRH-130b and pMIRH-128a sick mice, but no longer in control mice (Figure 4D). As disease progressed, BM cells of all sick mice maintained a significantly higher expression of Ccnt1, Cdk9, Dot1l, and Brd4, and decreased expression of Zfp64 (Figure 4E,F). pMIRH-130b sick mice upregulated Flt3, Hoxa9, Cdk6, and Bcl2, whereas pMIRH-128a sick mice upregulated Meis1, Runx1, Cdk6, and Bcl2 (Figure 4E-F). This suggests that both miRNAs promote the expression of essential components of the Mll-AF4 transcriptional machinery and their target genes. Other B-lineage–associated genes (Pax5, Il7r, Ikaros) were also upregulated in sick mice, which correlates with the lineage association of the hematological malignancies (Figures 3 and 4E-F).
We also confirmed the expression of miR-130b and miR-128a in sick mice, and 3 miRNAs downregulated in patients (miR-99b, miR-125a-5p, miR-194) (Figure 4E-F; supplemental Table 2). pMIRH-130b sick mice showed an overexpression of miR-130b, miR-99b, and miR-194, whereas pMIRH-128a sick mice had an miRNA expression profile more similar to patient leukemic blasts: miR-130b and miR-128a upregulation; miR-99b, miR-125a-5p, and miR-194 downregulation.
Finally, we verified the expression of miR-130b and miR-128a target genes linked to leukemogenesis and/or B-cell development. miR-130b and miR-128a expression led to an upregulation of Creb1, Marcks, Jarid2, and Lcor at the pre-leukemia stage (supplemental Figure 4A-B). miR-128a also caused an upregulation of Mllt10, which interacts with DOT1L to mediate H3K79 dimethylation (supplemental Figure 4A-B).42 With the establishment of the disease and similar to patients, Brwd1, Creb1, and E2f3 became upregulated in pMIRH-130b and pMIRH-128a sick mice, as well as Bmi1, Brwd3, Mllt10, and Pten in pMIRH-128a sick mice (supplemental Figure 4C-D). Brwd1 promotes B lymphopoiesis through RAG recruitment,43 whereas BMI1 is important for MLL-rearranged leukemia maintenance.44 Finally, in line with the bortezomib sensitivity of MLL-AF4+ leukemic cells, miR-130b led to a significant downregulation of Marcks, a protein kinase C substrate associated with bortezomib resistance (supplemental Figure 4C-D).45,46 Overall, 35 of 40 genes (88%) had an expression pattern similar between infant/pediatric patients and sick mice. Therefore, the expression pattern observed in sick mice largely recapitulates that of MLL-AF4+ BCP ALL.
miR-130b+ and miR-128a+ Mll-AF4+ leukemia is propagated by different LSCs
Our previous studies have pointed to the FL LMPP as the most likely cell-of-origin of t(4;11) MLL-AF4 ALL.14,15 pMIRH-130b sick mice also showed an increased LMPP compartment upon serial transplantation (Figure 3). To determine which population contains leukemia-propagating/stem cells, we individually transplanted HSC/MPPs, LMPPs, LK/CLPs, and LSK Il7r+ (pMIRH-128a only) from the BM of sick mice to assess their ability to transfer the disease (Figure 5A). Two of 3 mice that received 100 LMPPs from pMIRH-130b primary/sick mouse showed engraftment and overt disease after a latency of only 41 days, whereas there was no contribution from injected HSCs/MPPs and LK/CLPs (Figure 5B). As the disease became more aggressive with serial transplants, a low number of HSCs/MPPs or LMPPs (and high number of LK/CLP) from pMIRH-130b secondary/sick mice was sufficient to phenocopy the leukemia in tertiary recipients (Figure 5C).
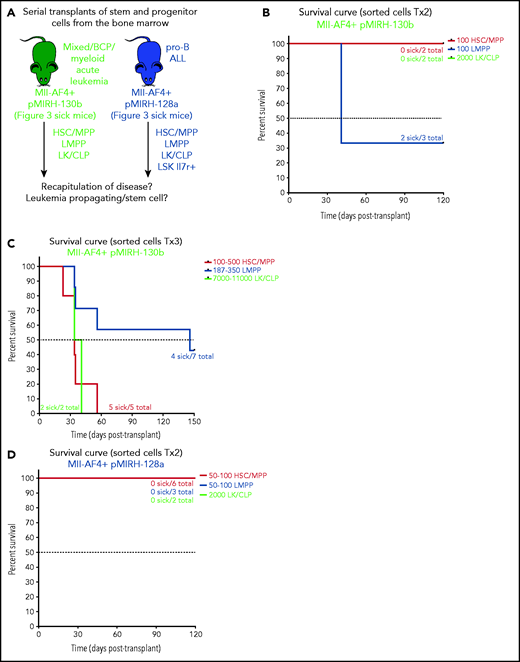
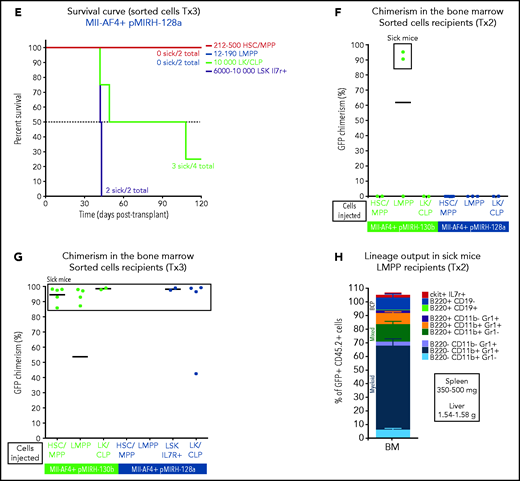
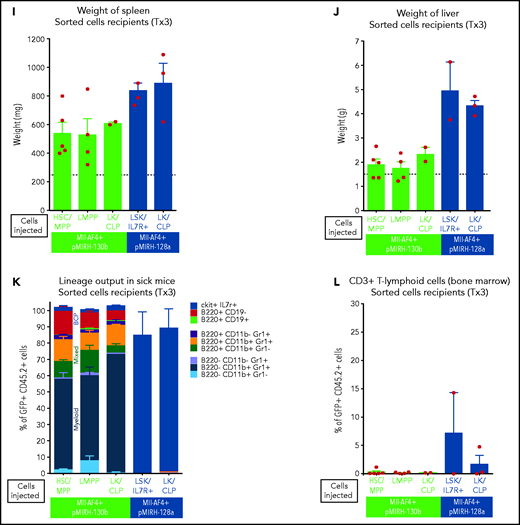

Mll-AF4+ pMIRH-130b and Mll-AF4+ pMIRH-128a leukemia are propagated by different leukemic stem cells. (A) Experimental design. All sorted cells were retrieved from recipients originally transplanted with total BM cells. Secondary recipients received cells retrieved from the BM of FL Mll-AF4+ LSK primary recipients. Tertiary recipients received cells from the BM of total BM secondary recipients. Survival curves of (B) secondary and (C) tertiary transplants of mice that received sorted HSCs/MPPs (LSK Il7r− Flt3−), LMPPs (LSK Flt3+), or LK/CLPs (Lineage-Sca1low/-ckit+) from the BM of Mll-AF4+ pMIRH-130b sick mice. Survival curves of (D) secondary and (E) tertiary transplants of mice that received sorted HSCs/MPPs, LMPPs, LK/CLPs, or LSK Il7r+ from the BM of Mll-AF4+ pMIRH-128a sick mice. GFP chimerism in the BM of (F) secondary and (G) tertiary recipients. (H) Proportion of hematopoietic cells in secondary recipients of LMPPs from Mll-AF4+ pMIRH-130b sick mice. Spleen and liver weight are also indicated. (I) Spleen and (J) liver weight of sick tertiary recipients that received sorted HSCs/MPPs, LMPPs, LK/CLPs, or LSK Il7r+ from the BM of Mll-AF4+ pMIRH-130b or Mll-AF4+ pMIRH-128a sick mice. (K) Proportion of myeloid cells, mixed lineage cells, B-lymphoid cells, and ckit+ Il7r+ cells. (L) T-lymphoid cells in the BM of tertiary recipients of sorted cells from Mll-AF4+ pMIRH-130b or Mll-AF4+ pMIRH-128a sick mice. Proportion of (M) ckit+ cells and (N) HSCs/MPPs, LMPPs, and LSK Il7r+ cells in the BM LSK compartment of tertiary recipients of sorted cells from Mll-AF4+ pMIRH-130b sick mice. Graphs are presented as mean ± standard error of the mean (1 dot = 1 mouse).
Mll-AF4+ pMIRH-130b and Mll-AF4+ pMIRH-128a leukemia are propagated by different leukemic stem cells. (A) Experimental design. All sorted cells were retrieved from recipients originally transplanted with total BM cells. Secondary recipients received cells retrieved from the BM of FL Mll-AF4+ LSK primary recipients. Tertiary recipients received cells from the BM of total BM secondary recipients. Survival curves of (B) secondary and (C) tertiary transplants of mice that received sorted HSCs/MPPs (LSK Il7r− Flt3−), LMPPs (LSK Flt3+), or LK/CLPs (Lineage-Sca1low/-ckit+) from the BM of Mll-AF4+ pMIRH-130b sick mice. Survival curves of (D) secondary and (E) tertiary transplants of mice that received sorted HSCs/MPPs, LMPPs, LK/CLPs, or LSK Il7r+ from the BM of Mll-AF4+ pMIRH-128a sick mice. GFP chimerism in the BM of (F) secondary and (G) tertiary recipients. (H) Proportion of hematopoietic cells in secondary recipients of LMPPs from Mll-AF4+ pMIRH-130b sick mice. Spleen and liver weight are also indicated. (I) Spleen and (J) liver weight of sick tertiary recipients that received sorted HSCs/MPPs, LMPPs, LK/CLPs, or LSK Il7r+ from the BM of Mll-AF4+ pMIRH-130b or Mll-AF4+ pMIRH-128a sick mice. (K) Proportion of myeloid cells, mixed lineage cells, B-lymphoid cells, and ckit+ Il7r+ cells. (L) T-lymphoid cells in the BM of tertiary recipients of sorted cells from Mll-AF4+ pMIRH-130b or Mll-AF4+ pMIRH-128a sick mice. Proportion of (M) ckit+ cells and (N) HSCs/MPPs, LMPPs, and LSK Il7r+ cells in the BM LSK compartment of tertiary recipients of sorted cells from Mll-AF4+ pMIRH-130b sick mice. Graphs are presented as mean ± standard error of the mean (1 dot = 1 mouse).
Interestingly, we did not observe an engraftment from the few retrieved HSCs/MPPs and LMPPs from primary/sick or secondary/sick pMIRH-128a mice. Leukemia-propagating ability was restricted to the blast populations (LK/CLP and LSK Il7r+ fractions) in pMIRH-128a sick mice (Figure 5D-E). The GFP chimerism in the BM of secondary and tertiary recipients was >85% in sick mice (Figure 5F-G)
Secondary/sick recipients of LMPP from pMIRH-130b primary/sick mice showed splenohepatomegaly, pale bones, and a mixed/BCP/myeloid lineage phenotype (Figure 5H-I; supplemental Table 4). Faithful disease propagation was also confirmed in tertiary recipients of both pMIRH-130b and pMIRH-128a sorted cells (Figure 5I-M; supplemental Figure 5). The LSK compartment of pMIRH-130b tertiary/sick mice was largely dominated by the LMPP population, whether mice received HSCs/MPPs or LMPPs (Figure 5N). This confirms that LMPPs propagate the mixed/BCP/myeloid lineage acute leukemia observed in pMIRH-130b mice, whereas the Lineage-Sca1+/−Il7r+c-Kit+ blast population maintains the pro-B ALL in pMIRH-128a mice.
NR2F6 and SGMS1, 2 targets of miR-130b and miR-128a, have tumor-suppressor activity
To identify the downstream mechanisms of miR-130b and miR-128a, we intersected the differentially expressed genes that are common between pediatric and infant MLL-AF4+ leukemia with predicted targets of miR-130b and miR-128a (Figure 6A).28,41,47 We selected NR2F6 (miR-128a target) and SGMS1 (miR-130b and miR-128a target) for functional validation given their unknown role in MLL-AF4+ leukemia. NR2F6 is a transcriptional repressor with predicted DNA-binding sites in the MLL promoter, whereas SGMS1 synthesizes sphingomyelin, which is an essential component of the plasma membrane.48 Both genes are downregulated in MLL-AF4+ leukemia patients (Figure 6B-C; supplemental Figure 6A-D) and in MLL-rearranged leukemia cell lines compared with Nalm6 cells (supplemental Figure 6E-F). We also observed their downregulation in pMIRH-130b and pMIRH-128a leukemic mice (Figure 6D-E).
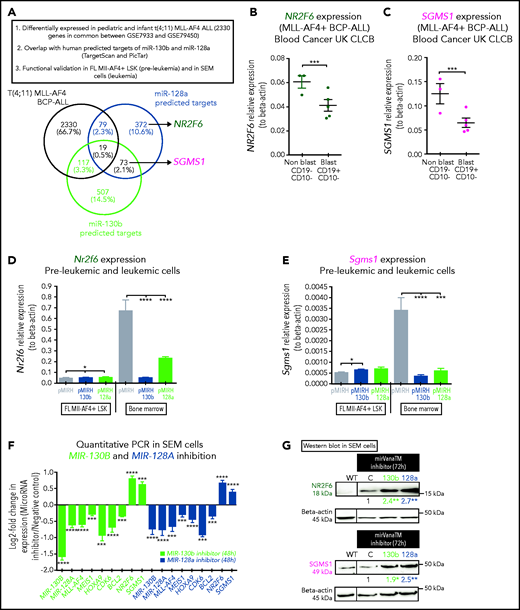

NR2F6 and SGMS1, two targets of miR-130b and miR-128a, have tumor-suppressive activity in MLL-AF4–driven leukemogenesis. (A) Overlap of deregulated genes in GSE79533 and GSE79450 data sets (black), predicted targets of miR-130b (green) or miR-128a (blue) using TargetScan and PicTar. (B) NR2F6 and (C) SGMS1 expression in t(4;11) MLL-AF4 pediatric leukemia blasts and nonblasts from our cohort. (D) Nr2f6 and (E) Sgms1 expression in FL Mll-AF4+ LSK (pre-leukemic) and BM (leukemic) of Mll-AF4+ pMIRH control mice and of Mll-AF4+ pMIRH-130b and Mll-AF4+ pMIRH-128a sick mice. (F) qRT-PCR of miR-130b, miR-128a, MLL-AF4, MEIS1, HOXA9, CDK6, BCL2, NR2F6, and SGMS1 in SEM cells transfected with a negative inhibitor control, miR-130b inhibitor, or miR-128a inhibitor. The log2 fold change (LOG2FC) is calculated using the negative inhibitor control as a reference. (G) Western blot against NR2F6 and SGMS1 in SEM cells transfected with a negative inhibitor control, miR-130b inhibitor, or miR-128a inhibitor. The brightness was adjusted manually in ImageJ to uniform the background, and each lane came from the same membrane. The WT lane was not directly next to the siRNA lane and is separated by a vertical line. Relative quantification for all 3 proteins was calculated by Image Laboratory using the sicontrol as a reference. The quantification presented for NR2F6 and SGMS1 is adjusted with the relative quantification of the β-actin signal intensity. The β-actin signal comes from the same membrane as the NR2F6/SGMS1 signal (n = 4). (H) Apoptosis and (I) proliferation of SEM leukemic cells upon NR2F6 and SGMS1 overexpression. (J) Expression of MLL-AF4 and its target genes (MEIS1, HOXA9, CDK6, BCL2, miR-130b, and miR-128a) and SGMS1 in SEM leukemic cells upon NR2F6 overexpression. The log2 fold change (LOG2FC) is calculated using SEM pCDH cells as a reference. (K) Survival curve of NSG mice transplanted with SEM control (pCDH-empty) and overexpressing NR2F6 (pCDH-NR2F6). NSG mice were culled 64 days after transplant due to facility concerns. This experiment could not be performed with SGMS1 due to the high amount of cell death in SEM cells. The overexpression of NR2F6 and SGMS1 in leukemic cells was achieved by lentiviral transduction, and transduced cells were monitored with GFP. A Gehan-Breslow-Wilcoxon test was used to compare survival curves. Unless stated otherwise, data were compared using a Mann-Whitney U test: *P < .05; **P < .01; ***P < .001; ****P < .0001. Graphs are presented as mean ± standard error of the mean. Blood Cancer UK CLCB, Childhoood Leukaemia Cell Bank.
NR2F6 and SGMS1, two targets of miR-130b and miR-128a, have tumor-suppressive activity in MLL-AF4–driven leukemogenesis. (A) Overlap of deregulated genes in GSE79533 and GSE79450 data sets (black), predicted targets of miR-130b (green) or miR-128a (blue) using TargetScan and PicTar. (B) NR2F6 and (C) SGMS1 expression in t(4;11) MLL-AF4 pediatric leukemia blasts and nonblasts from our cohort. (D) Nr2f6 and (E) Sgms1 expression in FL Mll-AF4+ LSK (pre-leukemic) and BM (leukemic) of Mll-AF4+ pMIRH control mice and of Mll-AF4+ pMIRH-130b and Mll-AF4+ pMIRH-128a sick mice. (F) qRT-PCR of miR-130b, miR-128a, MLL-AF4, MEIS1, HOXA9, CDK6, BCL2, NR2F6, and SGMS1 in SEM cells transfected with a negative inhibitor control, miR-130b inhibitor, or miR-128a inhibitor. The log2 fold change (LOG2FC) is calculated using the negative inhibitor control as a reference. (G) Western blot against NR2F6 and SGMS1 in SEM cells transfected with a negative inhibitor control, miR-130b inhibitor, or miR-128a inhibitor. The brightness was adjusted manually in ImageJ to uniform the background, and each lane came from the same membrane. The WT lane was not directly next to the siRNA lane and is separated by a vertical line. Relative quantification for all 3 proteins was calculated by Image Laboratory using the sicontrol as a reference. The quantification presented for NR2F6 and SGMS1 is adjusted with the relative quantification of the β-actin signal intensity. The β-actin signal comes from the same membrane as the NR2F6/SGMS1 signal (n = 4). (H) Apoptosis and (I) proliferation of SEM leukemic cells upon NR2F6 and SGMS1 overexpression. (J) Expression of MLL-AF4 and its target genes (MEIS1, HOXA9, CDK6, BCL2, miR-130b, and miR-128a) and SGMS1 in SEM leukemic cells upon NR2F6 overexpression. The log2 fold change (LOG2FC) is calculated using SEM pCDH cells as a reference. (K) Survival curve of NSG mice transplanted with SEM control (pCDH-empty) and overexpressing NR2F6 (pCDH-NR2F6). NSG mice were culled 64 days after transplant due to facility concerns. This experiment could not be performed with SGMS1 due to the high amount of cell death in SEM cells. The overexpression of NR2F6 and SGMS1 in leukemic cells was achieved by lentiviral transduction, and transduced cells were monitored with GFP. A Gehan-Breslow-Wilcoxon test was used to compare survival curves. Unless stated otherwise, data were compared using a Mann-Whitney U test: *P < .05; **P < .01; ***P < .001; ****P < .0001. Graphs are presented as mean ± standard error of the mean. Blood Cancer UK CLCB, Childhoood Leukaemia Cell Bank.
To establish a direct link between miR-130b/miR-128a and NR2F6/SGMS1 in human MLL-AF4+ leukemic cells, we used specific siRNAs against miR-130b or miR-128a to inhibit their activity in SEM cells. Both induced decelerated cell proliferation (supplemental Figure 6G), which correlates with SEM proliferation upon inhibition with pmiRZip (Figure 1H). miR-130b or miR-128a inhibition in SEM cells initiated a strong downregulation of miR-130b, miR-128a, MLL-AF4, and its transcriptional targets (MEIS1, HOXA9, CDK6, BCL2), and, importantly, strongly upregulated NR2F6 and SGMS1 at the transcript and protein level (Figure 6F-G). This was recapitulated with MLL-AF4 inhibition through siMA6 (supplemental Figure 6H-I) and in SEM pmiRZip-130b cells, which maintained long-term miR-128a downregulation (supplemental Figure 6J-K). Finally, using a luciferase assay, we observed a significant decrease in luciferase activity when miR-128a is overexpressed alongside of the pGL3promoter-UTR-NR2F6 or pGL3promoter-UTR-SGMS1 in HEK293T cells (supplemental Figure 6L). The effect was similar, but weaker, when miR-130b was overexpressed with the pGL3promoter-UTR-SGMS1 (supplemental Figure 6M).
To assess the role of NR2F6 and SGMS1 in human MLL-AF4+ leukemic cells, we overexpressed them in SEM and RS4;11 leukemic cells (supplemental Figure 6N-O). SGMS1 overexpression in SEM cells led to increased cell death (Figure 6H), whereas NR2F6 significantly decreased cell proliferation (Figure 6I). These effects were recapitulated in RS4;11 leukemia cells (supplemental Figure 6P-Q). Furthermore, NR2F6 overexpression in SEM cells was linked to a downregulation of MLL-AF4 and its target genes (MEIS1, HOXA9, BCL2, miR-130b, miR-128a) (Figure 6J). We also observed prolonged survival of SEM-pCDH-hNR2F6–engrafted NSG mice of up to 64 days after transplant (Figure 6K). Overall, these results identified a direct link between miR-130b/miR-128a and NR2F6/SGMS1, which promotes MLL-AF4+ leukemia maintenance.
Continued miR-130b activity and NR2F6/SGMS1 inhibition are required for MLL-AF4+ leukemia
To confirm the crucial role of miR-130b, miR-128a, NR2F6, and SGMS1 in MLL-AF4+ leukemia maintenance, we conducted rescue experiments using the pmiRZip miRNA inhibitors and NR2F6 and SGMS1 overexpression. A summary of the rescue mouse cohort is included (supplemental Table 7). GFP+ leukemic cells from pMIRH-130b sick/secondary recipients were transduced with a control inhibitor (pmiRZip-scramble), an anti-miR-130b (pmiRZip-130b), an NR2F6 vector (pCDH-hNR2F6), or an SGMS1 vector (pCDH-hSGMS1) and transplanted (Figure 7A). miR-130b inhibition and NR2F6/SGMS1 upregulation were confirmed in Mll-AF4+ pMIRH-130b pmiRZip-130b pre-transplant and BM cells (supplemental Figure 7A). We also confirmed NR2F6 and SGMS1 overexpression in pre-transplant and BM cells of Mll-AF4+ pMIRH-130b pCDH-hNR2F6 and pCDH-hSGMS1, whereas miR-130b expression was stable (supplemental Figure 7A). miR-130b inhibition and NR2F6 overexpression led to a significantly prolonged latency compared with control mice (53 and 62 vs 23 days, respectively) (Figure 7B). SGMS1 overexpression was not able to maintain Mll-AF4+ pMIRH-130b leukemia and led to a stroke-like phenotype in all recipients (Figure 7B; supplemental Table 7). Although Mll-AF4+ pMIRH-130b pCDH-hSGMS1 rescue mice presented a significantly lower blast infiltration in all tissues and no splenohepatomegaly, Mll-AF4+ pMIRH-130b pmiRZip-130b and pCDH-hNR2F6 rescue mice eventually developed leukemia (Figure 7C; supplemental Figure 7B-C). Mll-AF4+ pMIRH-130b rescue mice displayed a reduced contribution from the myeloid compartment and an increased contribution from mixed lineage cells (Figure 7D; supplemental Figure 7D-G). B-lymphoid cells, including committed B220+CD19+ cells, were also restored in Mll-AF4+ pMIRH-130b rescue mice (Figure 7D; supplemental Figure 7D-G), suggesting that miR-130b mediates the B-lymphoid differentiation arrest through the downregulation of NR2F6 and SGMS1.
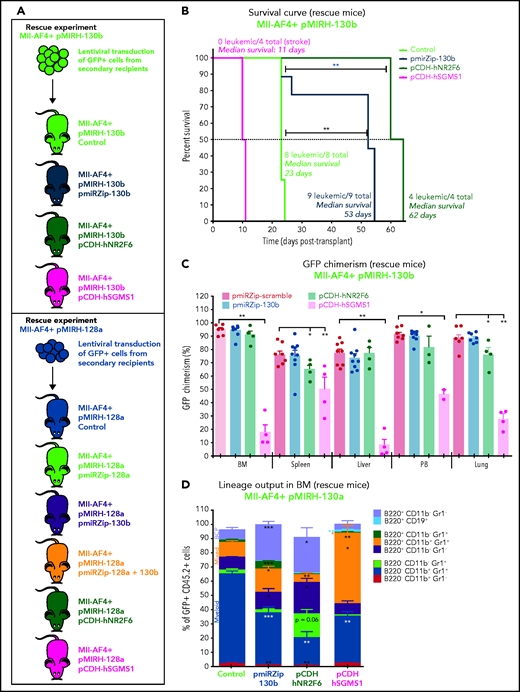
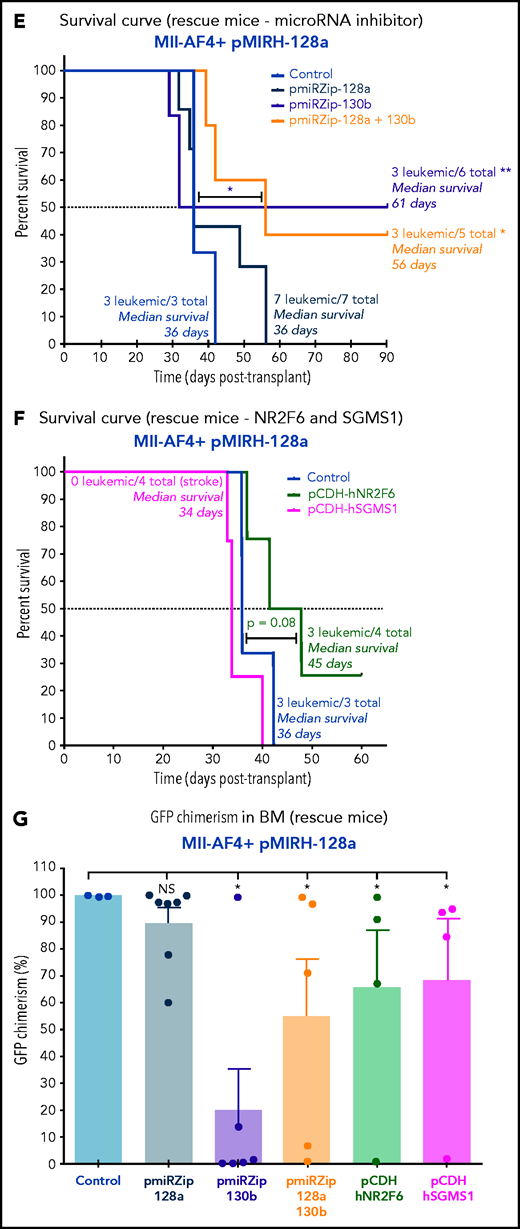

MiR-130b activity and NR2F6/SGMS1 inhibition is required for MLL-AF4+ leukemia maintenance. (A) Experimental layout of rescue experiment for Mll-AF4+ pMIRH-130b leukemic mice (18 000 GFP+ cells injected) and Mll-AF4+ pMIRH-128a leukemic mice (10 000 GFP+ cells injected). (B) Survival curve of Mll-AF4+ pMIRH-130b rescue mice (pmiRZip-scramble or pmiRZip-130b, NR2F6 or SGMS1 overexpression). (C) GFP chimerism in various organs of Mll-AF4+ pMIRH-130b rescue mice. (D) Lineage output in the GFP+ fraction of the BM of Mll-AF4+ pMIRH-130b rescue mice. (E) Survival curve of Mll-AF4+ pMIRH-128a rescue mice with miRNA inhibition (pmiRZip-scramble, pmiRZip-128a, pmiRZip-130b, or pmiRZip-128a+130b). (F) Survival curve of Mll-AF4+ pMIRH-128a rescue mice with NR2F6 or SGMS1 overexpression. A statistical comparison of the survival rate of rescue mice was performed using a χ2 test to compare the distribution of sick and non-sick mice (indicated next to the number of sick mice/total mice). (G) GFP chimerism in the BM of Mll-AF4+ pMIRH-128a rescue mice. (H) Postmortem photos of representative Mll-AF4+ pMIRH-128a rescue mice. (I) Apoptosis/necrosis of fresh GFP+ cells retrieved from the BM of Mll-AF4+ pMIRH-130b and Mll-AF4+ pMIRH-128a rescue mice upon NR2F6 or SGMS1 overexpression. Recipients of SGMS1-overexpressing cells were euthanized because of a stroke-like phenotype. Data were compared using a Mann-Whitney U test: *P < .05; **P < .01; ***P < .001. A Gehan-Breslow-Wilcoxon test was used to compare survival curves. Graphs are presented as mean ± standard error of the mean (1 dot = 1 mouse). PB, peripheral blood.
MiR-130b activity and NR2F6/SGMS1 inhibition is required for MLL-AF4+ leukemia maintenance. (A) Experimental layout of rescue experiment for Mll-AF4+ pMIRH-130b leukemic mice (18 000 GFP+ cells injected) and Mll-AF4+ pMIRH-128a leukemic mice (10 000 GFP+ cells injected). (B) Survival curve of Mll-AF4+ pMIRH-130b rescue mice (pmiRZip-scramble or pmiRZip-130b, NR2F6 or SGMS1 overexpression). (C) GFP chimerism in various organs of Mll-AF4+ pMIRH-130b rescue mice. (D) Lineage output in the GFP+ fraction of the BM of Mll-AF4+ pMIRH-130b rescue mice. (E) Survival curve of Mll-AF4+ pMIRH-128a rescue mice with miRNA inhibition (pmiRZip-scramble, pmiRZip-128a, pmiRZip-130b, or pmiRZip-128a+130b). (F) Survival curve of Mll-AF4+ pMIRH-128a rescue mice with NR2F6 or SGMS1 overexpression. A statistical comparison of the survival rate of rescue mice was performed using a χ2 test to compare the distribution of sick and non-sick mice (indicated next to the number of sick mice/total mice). (G) GFP chimerism in the BM of Mll-AF4+ pMIRH-128a rescue mice. (H) Postmortem photos of representative Mll-AF4+ pMIRH-128a rescue mice. (I) Apoptosis/necrosis of fresh GFP+ cells retrieved from the BM of Mll-AF4+ pMIRH-130b and Mll-AF4+ pMIRH-128a rescue mice upon NR2F6 or SGMS1 overexpression. Recipients of SGMS1-overexpressing cells were euthanized because of a stroke-like phenotype. Data were compared using a Mann-Whitney U test: *P < .05; **P < .01; ***P < .001. A Gehan-Breslow-Wilcoxon test was used to compare survival curves. Graphs are presented as mean ± standard error of the mean (1 dot = 1 mouse). PB, peripheral blood.
Second, given miR-130b upregulation in the BM of pMIRH-128a sick mice (Figure 4E), we performed single or double inhibition of miR-128a and miR-130b and NR2F6/SGMS1 overexpression in GFP+ leukemic cells from pMIRH-128a sick/secondary recipients (Figure 7A). The single or double inhibition of miR-128a and miR-130b led to a downregulation of both miR-130b and miR-128a in Mll-AF4+ pMIRH-128a pre-transplant cells (supplemental Figure 7H), which is similar to what has been observed in SEM cells (Figure 6F). This miR-130b/miR-128a inhibition was accompanied by an upregulation of NR2F6 and SGMS1 (supplemental Figure 7H). Similar to the results with SEM cells (Figure 1J), miR-128a inhibition did not affect disease latency (Figure 7E), suggesting that miR-128a inhibition is more important for the initiation of MLL-AF4–driven leukemogenesis. Strikingly, miR-130b inhibition led to a total rescue of 50% of recipients, highlighting a critical role for pro-B ALL maintenance (Figure 7E). miR-128a and miR-130b dual inhibition led to a similar rescue phenotype and a longer latency (Figure 7E). Similar to Mll-AF4+ pMIRH-130b rescue mice, NR2F6 overexpression showed a trend toward a longer latency (P = .08) and SGMS1 induced a stroke-like phenotype (Figure 7F). miR-130b inhibition alone or with pmiRZip-128a as well as NR2F6/SGMS1 overexpression reduced splenohepatomegaly (supplemental Figure 7I-J) and all showed a significantly decreased GFP chimerism in the BM (Figure 7G-H). The GFP chimerism in the peripheral blood, spleen, liver, and lungs was also reduced in some rescue mice (supplemental Figure 7K-N). Finally, similar to SEM cells (Figure 6H), SGMS1 overexpression in Mll-AF4+ pMIRH-130b and Mll-AF4+ pMIRH-128a mice increased mouse leukemic blast cell death in the BM, peripheral blood, spleen, liver, and lungs (Figure 7I; supplemental Figure 7O-R). This may cause an accumulation of debris in vessels/arteries, leading to blockages that could explain the stroke-like phenotype observed in SGMS1 rescue mice. NR2F6 overexpression also decreased the viability of mouse leukemic cells, which correlated with the longer latency observed in recipients (Figure 7B,F).
All pre-transplant cells transduced with a miRNA inhibitor or overexpressing gene showed a downregulation of Mll-AF4 and some of its target genes (supplemental Figure 7A,H). This Mll-AF4 downregulation was also seen in the BM of rescue mice, but was not necessarily linked to a downregulation of Mll-AF4 target genes such as Meis1, Hoxa9, Cdk6, or Bcl2. We also observed a partial/full recovery of Nr2f6 and Sgms1 expression following miR-130b inhibition in pMIRH-130b and pMIRH-128a leukemic mice (supplemental Figure 8).
In contrast to the rescue phenotype observed in sick mice, NR2F6 or SGMS1 overexpression in mouse Mll-AF4+ pre-leukemic cells impaired engraftment and did not lead to the stroke-like phenotype caused by SGMS1 overexpression in sick mice (supplemental Figure 9A-E). SGMS1 also favored the production of B220+ CD19+ B-lymphoid cells, which can partially be explained by Pax5 upregulation (supplemental Figure 9F-I).
These results confirm that the phenotype observed in our sick mice is miRNA-dependent and mediated through NR2F6 and SGMS1 downregulation. We also highlight their distinct biological roles in the initiation and maintenance of MLL-AF4–driven leukemogenesis and show that both NR2F6 and SGMS1 are tumor suppressor genes in MLL-AF4–driven leukemogenesis (supplemental Figure 11). These represent attractive targets for future studies that will focus on the identification of new therapeutic avenues for MLL-AF4+ leukemia.
Discussion
Our aim was to improve the understanding of MLL-AF4+ leukemogenesis and to find collaborating factors that could serve as new therapeutic targets. We focused on miR-130b and miR-128a for functional validation because of their strong upregulation in MLL-AF4+ BCP-ALL patient leukemic blasts from our and published cohorts.49 We used an integrative approach using human leukemic cell lines and a pre-leukemia mouse model of t(4;11) MLL-AF4 ALL with physiological expression levels of Mll-AF4 in the correct cellular context,14,15 as this model would allow for the identification of factors that drive the pre-leukemic state to a full acute leukemia phenotype.
miR-130b and miR-128a, which we identified as two novel downstream targets of MLL-AF4, were not overexpressed in the Mll-AF4 pre-leukemia mouse model.14 ATAC-Seq showed similar accessibility of the two loci in WT mouse and human FL LMPPs, which decreased upon Mll-AF4 expression in mouse cells. This was unexpected, but may be due to key members of the MLL-AF4 complex not being expressed in mouse progenitors. For this reason, we decided to overexpress the two miRNAs separately to assess their individual contribution to disease development. The overexpression of miR-130b or miR-128a in FL Mll-AF4+ LSK enhanced B-lymphoid clonogenic output, and most importantly, a significant subset of FL Mll-AF4+ LSK miR-130b+ or miR-128+ primary recipients developed an acute leukemia with similar phenotypic and molecular features as seen in patients. Specifically, Mll-AF4 and miR-130b together drove a progressively more severe mixed/BCP/myeloid lineage acute leukemia characterized by an expansion of B220+ mixed lineage, BCP, and myeloid cells. The combination of Mll-AF4 and miR-128a induced an acute leukemia with shortening latency over serial transplants and a phenotype that resembled that of pro-B cells (Lin-ckit+Il7r+). B220 and CD19 expression was lacking, but B-lymphoid–associated genes were expressed (Ikaros and Pax5). Therefore, miR-128a induced a very strong B-lymphoid differentiation arrest, with a lack of IgM-expressing mature B cells, and an upregulation of ckit and Sca1 stem cell markers. There was also a strong upregulation of miR-130b in Mll-AF4+ miR-128a sick mice.
This mouse model enables the comparison of gene expression at the pre-leukemia and leukemia stages, which is impossible to achieve with human samples because of the prenatal origin of t(4;11) MLL-AF4 acute leukemia. Already at the pre-leukemic stage, the expression of miR-130b or miR-128a increased the expression of Mll-AF4 and key players in Mll-AF4+ leukemogenesis that can explain some of the phenotypic differences observed in the sick mice (mixed/BCP/myeloid vs pro-B ALL). We observed a strong overlap with the expression signature in patients, including maintenance of Mll-AF4 expression. Hence, a full leukemic phenotype was achieved in a syngeneic mouse model with only one additional co-driver. Furthermore, with the rescue experiments highlighting the differential roles of miR-130b and miR-128a in leukemia progression and lineage identity, future experiments will focus on identifying the factors that modulate miR-130b and miR-128a expression and that are absent in mice.
Patients with t(4;11) MLL-AF4 leukemia present with an expansion of leukemic blasts that have a phenotype similar to pro-B cells (CD19+CD10−) and retain myeloid features (CD15+), and myeloid leukemic clones can emerge during disease progression.50,51 This suggests that the cell-of-origin of t(4;11) MLL-AF4 B-ALL retains lymphoid and myeloid potential, which could explain the lineage switch observed in some patients following treatment.52-54 In Mll-AF4+ miR-130b+ mice, we also observed a co-expression of myeloid and lymphoid markers on a substantial proportion of leukemic cells. Furthermore, LMPPs, which retain both myeloid and lymphoid potential and became the prominent LSC population as disease progressed, were able to recapitulate the mixed/BCP/myeloid lineage acute leukemia.
The leukemia-propagating cell in Mll-AF4+ miR-128a+ sick mice was very different. Almost all of the cells in the LSK and LK/CLP compartment in these mice expressed Il7r, and the few HSCs/MPPs and LMPPs retrieved from their BM did not engraft. Only the ckit+Il7r+Sca1+/− blast cells from Mll-AF4+ miR-128a+ sick mice propagated pro-B ALL, with both fractions yielding Sca1− and Sca1+ cells in sick mice (data not shown), a pattern observed with other markers in BCP-ALL patient samples (eg, CD34).33,55
Extensive functional validation in human and mouse cells has highlighted the importance of miR-130b upregulation in the initiation and maintenance of MLL-AF4+ acute leukemia. Even though miR-130b expression was detected in normal pre-pro-B human FL cells, this study confirms that MLL-AF4 is important to drive and/or maintain miR-130b upregulation. Finally, we identified two novel tumor suppressor genes, NR2F6 and SGMS1, which are downregulated in t(4;11) MLL-AF4 ALL patients and confirmed that they are direct targets of miR-130b and miR-128a. Their individual overexpression strongly compromised the proliferation and survival of MLL-AF4+ lymphoid human leukemic cells. In Mll-AF4+ miR-130b+ and Mll-AF4+ miR-128a+ leukemic mice, NR2F6 and SGMS1 led to prolonged latency, less severe/absent splenohepatomegaly, and compromised leukemic blast infiltration and viability. Future work will focus on refining our understanding of the mechanisms modulated by these genes for therapeutic use. Results from this study highlight a strong apoptotic and toxic response upon SGMS1 overexpression that is specific to Mll-AF4+ leukemic cells compared with Mll-AF4+ pre-leukemic cells. Hence, it will be essential to carefully control SGMS1 activity for clinical use to reduce the risk of severe complications for patients. Furthermore, if MLL is a direct target of the NR2F6 transcription repressor, the identification of molecules that can activate its ligand-binding domain could prove useful to target MLL-AF4 activity in leukemic cells.
This study provides new mouse models of t(4;11) MLL-AF4 acute leukemia with different lineage phenotypes. These are important tools for the development of better therapeutic regimens and for investigating lineage choice in MLL-rearranged leukemias. Our integrative approach can validate the role of leukemogenic co-drivers in a physiological context and allows, for the first time, the study of every stage of the disease, from the pre-leukemia stage to MLL-AF4+ leukemia.
Acknowledgments
The authors are extremely grateful to patients, their parents, and the Blood Cancer UK Childhood Leukaemia Cell Bank for providing MLL-AF4+ samples. The authors also thank Fiona Rossi, Andrea Corsinotti, Claire Cryer, and Bindy Heer from the CRM (Centre for Regenerative Medicine) Flow Cytometry Facility for cell sorting services and flow cytometry advice; Clare Orange and Lynn Stevenson, University of Glasgow, for the brain histology and imaging; and Bertrand Vernay and Mathieu Vermeren from the CRM Imaging Facility. The authors are especially grateful to patients for donating fetal tissue, and A. Saunderson and N. Forson for obtaining consent from patients and collecting specimens. The authors are very grateful to Thomas Milne for helpful comments on the manuscript. The authors acknowledge the support of James Todd, Andrew Dyer, Allan Booth, Hollie McGrath, Linda Dunn-Campbell, Jacek Mendrychowski, Stephen Henretty, John Agnew, Stuart Fleming, and Jamie Kelly from the CRM Animal Facility in animal experimentation.
This work was supported by a Blood Cancer UK Bennett Senior Fellowship (K.O.) and grants from the Kay Kendall Leukaemia Fund (K.O.) and Cancer Research UK (K.O. and E.T.B.A.). The work was also supported by an MRC Career Development Award (MR/N024028/1; A.S.) and a scholarship from the Darwin Trust of Edinburgh (M.O.). Core facilities at the Edinburgh Centre for Regenerative Medicine are supported by Centre grant MR/K017047/1. Some work was carried out at the MRC Centre for Reproductive Health, supported by MRC grants G1100357 and MR/N022556/1.
Authorship
Contribution: C.M. performed and designed experiments, analyzed the results, and wrote the manuscript; E.T.B.A. and M.O. performed and analyzed the ATAC-Seq experiment; H.J., F.S., C.H., and S.-L.L. performed experiments; R.A.A. arranged clinical provision of human fetal tissues; A.S. supervised the ATAC-Seq experiment; C.H. performed the central nervous system infiltration analysis; and K.O. conceived and supervised the study and wrote the manuscript.
Conflict-of-interest disclosure: The authors declare no competing financial interests.
Correspondence: Camille Malouf, Centre for Regenerative Medicine, University of Edinburgh, Edinburgh Bioquarter, 5 Little France Dr, Edinburgh EH16 4UU, United Kingdom; e-mail: camille.malouf@ed.ac.uk; or Katrin Ottersbach, Centre for Regenerative Medicine, University of Edinburgh, Edinburgh Bioquarter, 5 Little France Dr, Edinburgh EH16 4UU, United Kingdom; e-mail: katrin.ottersbach@ed.ac.uk.
The mouse and human ATAC-Seq files and the ATAC-Seq data set reported in this article have been deposited in the Gene Expression Omnibus database (accession number GSE168438).
Requests for original data may be e-mailed to the corresponding authors.
The online version of this article contains a data supplement.
There is a Blood Commentary on this article in this issue.
The publication costs of this article were defrayed in part by page charge payment. Therefore, and solely to indicate this fact, this article is hereby marked “advertisement” in accordance with 18 USC section 1734.

This feature is available to Subscribers Only
Sign In or Create an Account Close Modal