

Key Points
Dopamine signaling influences hematopoietic stem cell maintenance, HSPC proliferation, and transplantation efficiency.
Dopamine maintains Lck expression to control stem cell factor–induced ERK signaling downstream of c-Kit.

Abstract
Hematopoietic stem and progenitor cell (HSPC) function in bone marrow (BM) is controlled by stroma-derived signals, but the identity and interplay of these signals remain incompletely understood. Here, we show that sympathetic nerve–derived dopamine directly controls HSPC behavior through D2 subfamily dopamine receptors. Blockade of dopamine synthesis, as well as pharmacological or genetic inactivation of D2 subfamily dopamine receptors, leads to reduced HSPC frequency, inhibition of proliferation, and low BM transplantation efficiency. Conversely, treatment with a D2-type receptor agonist increases BM regeneration and transplantation efficiency. Mechanistically, dopamine controls expression of the lymphocyte-specific protein tyrosine kinase (Lck), which, in turn, regulates MAPK-mediated signaling triggered by stem cell factor in HSPCs. Our work reveals critical functional roles of dopamine in HSPCs, which may open up new therapeutic options for improved BM transplantation and other conditions requiring the rapid expansion of HSPCs.
Introduction
Hematopoietic stem cells (HSCs) are indispensable for lifelong blood cell formation and, thereby, enable fundamental physiological processes, such as oxygen transport, immune responses, removal of debris, and tissue repair.1-6 The maintenance and behavior of HSCs in bone marrow (BM) are regulated by niche microenvironments involving endothelial cells, vessel-associated reticular cells, adipocytes, and megakaryocytes.1,2,7-19 Although some niche-derived signals, such as SCF and the chemokine Cxcl12, are well studied,9,20-26 understanding of the microenvironmental control of HSC function remains incomplete.
Stroma-derived niche factors are also relevant for the challenged hematopoietic system. Chemotherapy or radiotherapy followed by BM transplantation, which are standard treatments for many hematopoietic malignancies, involve the rapid expansion of hematopoietic stem and progenitor cells (HSPCs).1,2,8,14,24,25,27-31 Failure of these processes contribute to increased patient morbidity and mortality; thus, further insight into the signals controlling HSPCs is needed.27,28,32
Adrenergic nerves and noradrenaline secretion control circadian oscillations in HSC migration.33-39 Adrenergic nerves in BM have been also associated with acute myelogenous leukemia, chemotherapy, and HSC ageing.36,40-44 Adrenergic signals influence HSC behavior indirectly through alterations in niche cells,42,45,46 whereas it is unclear whether sympathetic nerves control HSPCs directly.
The neuromodulator dopamine is synthesized from L-3, 4-dihydroxyphenylalanine, which, in turn, is generated from tyrosine by the enzyme tyrosine hydroxylase (Th).47 Dopamine is essential in brain where dopaminergic neurotransmission regulates various behavioral traits and defective dopamine signaling is a cause of neurodegenerative disease.48,49 Based on signaling activity, the 5 dopamine receptors can be divided into D1-type (including Drd1 and Drd5) and D2-type (Drd2, Drd3, and Drd4) receptors.50
Here, we show that dopamine signaling through D2-type receptors regulates HSPC behavior in BM under steady-state conditions and after transplantation. We identify lymphocyte-specific protein tyrosine kinase (Lck) as a downstream target that is regulated by dopamine signaling and controls the response of HSPCs to extrinsic signals from the vascular niche.
Methods
Mice
FACS, immunostaining, and transplantation
Detailed descriptions of fluorescence-activated cell sorting (FACS), immunostaining, RNA sequencing (RNA-seq), pharmacological treatments, methylcellulose assays, lentiviral infections, quantitative polymerase chain reaction (qPCR) enzyme-linked immunosorbent assay (ELISA), mass spectrometry, and transplantation experiments are provided in supplemental Methods (available on the Blood Web site).
Results
D2-type dopamine receptors cell autonomously regulate HSC maintenance
In a search for potential niche signals, we found that the normalized ratio and amount of dopamine in the extracellular fluid of BM are significantly higher relative to spleen and thymus (Figure 1A-B). Moreover, dopamine levels in BM are higher during the dark phase relative to daytime (supplemental Figure 1A). Dopamine may act directly on cells in marrow because bulk RNA-seq analysis of different BM cell types indicates that LSK (Lin− Sca-1+ c-Kit+) cells, which include HSPCs, express multiple dopamine receptors (supplemental Figure 1B).15,21 This is consistent with a previous report showing dopamine receptor expression in CD34+ human hematopoietic cells.60 However, transcript levels of dopamine receptors are relatively low in LSK cells and in neurons, which are known to express these molecules (supplemental Figure 1B-E).61,62 Dopamine receptor messenger RNAs (mRNAs) are very difficult to detect with conventional techniques at the single-cell level, even in striatal neurons, but this low transcript expression allows sufficient generation of functional protein.63 Accordingly, we found that Drd2 expression in LSK cells, HSCs (Lin− Sca1+ cKit+ CD48− CD150+), and c-Kit+ Lin− hematopoietic cells is supported by analysis of Drd2-EGFP transgenic mice and by qPCR (Figure 1C-D; supplemental Figure 1F-G). Furthermore, immunostaining confirms expression of Drd2 and Drd3 in c-Kit+ Lin− hematopoietic cells in adult BM sections and in freshly isolated LSK cells and HSCs (Figure 1E-F; supplemental Figure 1H-K). Expression of Drd2 and Drd3 in LSK cells and HSCs, but not in differentiated hematopoietic cells, is also evident by flow cytometry (Figure 1G-H; supplemental Figure 1L-M). Based on FACS analysis, the expression of Drd2 is 1.9-fold higher in neurons than in LSK cells, whereas neuronal Drd3 is 0.7-fold lower than in LSK cells (supplemental Figure 1N). Although D1-type receptor expression is detectable in LSK cells, pharmacological inhibition with the D1-specific inhibitor SCH-23390 does not cause hematopoietic defects (supplemental Figure 2A-B).64
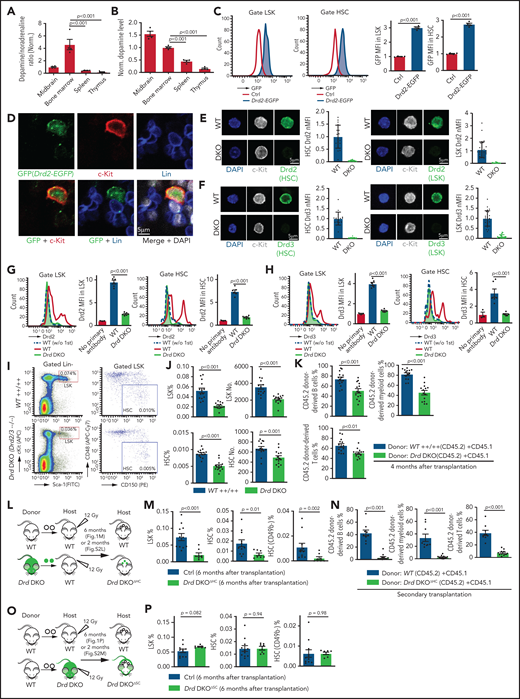
D2-type dopamine receptors cell-autonomously regulate HSC maintenance. (A) Normalized ratio (normalized to 1) of dopamine/noradrenaline in extracellular fluid from midbrain, BM, spleen, and thymus by ELISA (n = 4 for each tissue). The P values were calculated using analysis of variance (ANOVA). (B) Normalized dopamine level in extracellular fluid of midbrain, BM, spleen, and thymus by ELISA (n = 4). The P values were calculated using ANOVA. (C) Representative FACS graphs and quantification of GFP expression in LSK cells and HSCs from littermate control or Drd2-EGFP transgenic mice (n = 4). The P value was calculated using the Student t test. (D) Representative confocal images showing GFP expression in Lin− c-Kit+ HSPCs in adult bone sections from Drd2-EGFP mice. Confocal images showing Drd2 (E) and Drd3 (F) expression in FACS-sorted HSCs (left panels) and LSK cells (right panels) from WT or Drd-DKO (DKO) mice. Quantification of Drd2 or Drd3 normalized mean fluorescent intensity (nMFI). Mean fluorescent intensity (MFI) for WT cells is normalized to 1. For Drd2, WT HSC = 19, DKO HSC = 39, WT LSK = 33, and DKO LSK = 33. For Drd3, WT HSC = 18, DKO HSC = 21, WT LSK = 25, and DKO LSK = 25. Representative FACS graphs showing Drd2 (G) and Drd3 (H) expression in WT and Drd-DKO LSK cells and HSCs. MFI is normalized to the WT sample without primary antibody (n = 3); WT = 6, Drd-DKO = 6. (I) Representative FACS plots of LSK cells and HSCs in Drd-DKO and WT control mice. Numbers in the boxed areas represent the percentage of the corresponding cell population. (J) Quantification of the percentages of LSK cells (upper panels) and HSCs (lower panels) in BM (WT = 14; Drd-DKO = 14). The P value was calculated using the Student t test. (K) Quantification of donor-derived (CD45.2) B lymphocytes, T lymphocytes, and myeloid cells in competitive repopulating experiments (WT = 14; Drd-DKO = 14). A total of 5 × 10⁵ CD45.2 (WT or Drd-DKO) BM cells were mixed with 5 × 10⁵ CD45.1 BM cells, transplanted into lethally irradiated CD45.1 recipients, and analyzed 16 weeks later. The P value was calculated using the Student t test. (L) Diagram depicting transplantation of WT or Drd-DKO LSK cells into lethally irradiated WT mice. (M) Percentages of LSK cells (left panel), HSCs (middle panel), and CD49b− HSCs (right panel) in hematopoietic-specific chimeric WT (n = 11) or Drd-DKOΔHC (n = 8) BM from mice in panel L at 6 months after transplantation. The P value was calculated using the Student t test. (N) Quantification of donor-derived (CD45.2) cells in secondary competitive transplantation experiments (WT donor BM = 9; Drd-DKOΔHC donor BM = 12). The P value was calculated using the Student t test. (O) Schematic diagram depicting transplantation of WT LSK cells into lethally irradiated WT or Drd-DKO recipients. (P) Percentages of LSK cells (left panel), HSCs (middle panel), and CD49b− HSCs (right panel) from chimeric mice in panel O at 6 months after transplantation. The P value was calculated using the Student t test. WT = 11; Drd-DKOΔSC = 7. APC, allophycocyanin; Ctrl, control; Fig.S2L, supplemental Figure 2L; Fig.S2M, supplemental Figure 2M; FITC, fluorescein isothiocyanate; PE, phycoerythrin.
D2-type dopamine receptors cell-autonomously regulate HSC maintenance. (A) Normalized ratio (normalized to 1) of dopamine/noradrenaline in extracellular fluid from midbrain, BM, spleen, and thymus by ELISA (n = 4 for each tissue). The P values were calculated using analysis of variance (ANOVA). (B) Normalized dopamine level in extracellular fluid of midbrain, BM, spleen, and thymus by ELISA (n = 4). The P values were calculated using ANOVA. (C) Representative FACS graphs and quantification of GFP expression in LSK cells and HSCs from littermate control or Drd2-EGFP transgenic mice (n = 4). The P value was calculated using the Student t test. (D) Representative confocal images showing GFP expression in Lin− c-Kit+ HSPCs in adult bone sections from Drd2-EGFP mice. Confocal images showing Drd2 (E) and Drd3 (F) expression in FACS-sorted HSCs (left panels) and LSK cells (right panels) from WT or Drd-DKO (DKO) mice. Quantification of Drd2 or Drd3 normalized mean fluorescent intensity (nMFI). Mean fluorescent intensity (MFI) for WT cells is normalized to 1. For Drd2, WT HSC = 19, DKO HSC = 39, WT LSK = 33, and DKO LSK = 33. For Drd3, WT HSC = 18, DKO HSC = 21, WT LSK = 25, and DKO LSK = 25. Representative FACS graphs showing Drd2 (G) and Drd3 (H) expression in WT and Drd-DKO LSK cells and HSCs. MFI is normalized to the WT sample without primary antibody (n = 3); WT = 6, Drd-DKO = 6. (I) Representative FACS plots of LSK cells and HSCs in Drd-DKO and WT control mice. Numbers in the boxed areas represent the percentage of the corresponding cell population. (J) Quantification of the percentages of LSK cells (upper panels) and HSCs (lower panels) in BM (WT = 14; Drd-DKO = 14). The P value was calculated using the Student t test. (K) Quantification of donor-derived (CD45.2) B lymphocytes, T lymphocytes, and myeloid cells in competitive repopulating experiments (WT = 14; Drd-DKO = 14). A total of 5 × 10⁵ CD45.2 (WT or Drd-DKO) BM cells were mixed with 5 × 10⁵ CD45.1 BM cells, transplanted into lethally irradiated CD45.1 recipients, and analyzed 16 weeks later. The P value was calculated using the Student t test. (L) Diagram depicting transplantation of WT or Drd-DKO LSK cells into lethally irradiated WT mice. (M) Percentages of LSK cells (left panel), HSCs (middle panel), and CD49b− HSCs (right panel) in hematopoietic-specific chimeric WT (n = 11) or Drd-DKOΔHC (n = 8) BM from mice in panel L at 6 months after transplantation. The P value was calculated using the Student t test. (N) Quantification of donor-derived (CD45.2) cells in secondary competitive transplantation experiments (WT donor BM = 9; Drd-DKOΔHC donor BM = 12). The P value was calculated using the Student t test. (O) Schematic diagram depicting transplantation of WT LSK cells into lethally irradiated WT or Drd-DKO recipients. (P) Percentages of LSK cells (left panel), HSCs (middle panel), and CD49b− HSCs (right panel) from chimeric mice in panel O at 6 months after transplantation. The P value was calculated using the Student t test. WT = 11; Drd-DKOΔSC = 7. APC, allophycocyanin; Ctrl, control; Fig.S2L, supplemental Figure 2L; Fig.S2M, supplemental Figure 2M; FITC, fluorescein isothiocyanate; PE, phycoerythrin.
To investigate the potential functions of D2-type receptors in HSC maintenance, we analyzed young adult Drd2-knockout (Drd2−/−) and Drd3-knockout (Drd3−/−) mice. Remarkably, Drd2−/− and Drd3−/− mice exhibit a reduction in HSCs and LSK cells in BM (supplemental Figure 2C-D). We further generated Drd2 and Drd3 double-knockout (Drd-DKO) mice, which also show significant loss of HSCs and LSK cells relative to wild-type (WT) controls (Figure 1I-J). Loss of HSCs in Drd-DKO mice is confirmed by CD45.2/CD45.1 competitive repopulation (Figure 1K; supplemental Figure 2E-F). Similar to findings in BM, LSK cells and HSCs are also reduced in Drd-DKO spleen, whereas the abundance of these cell populations in peripheral blood is unaltered (supplemental Figure 2G). Although total BM nucleated cells (BMNCs) are comparable in Drd-DKO and control samples, mutants show a substantial reduction in common myeloid progenitors, megakaryocyte–erythroid progenitors, CD11b+ myeloid cells, and Gr-1+ granulocytes (supplemental Figure 2H-J). Together, these results establish that D2-type receptors are expressed by HSCs/HSPCs and are necessary for maintenance of these cell populations.
Next, we conducted experiments to distinguish the role of D2-type dopamine receptors in hematopoietic cells vs stromal cells. To generate hematopoietic cell–specific Drd-DKO chimeric mice (Drd-DKOΔHC), lethally irradiated WT recipients were transplanted with LSK cells from WT or Drd-DKO donors and analyzed after successful repopulation (Figure 1L). Chimeras with Drd-DKO hematopoietic cells show significantly reduced percentages of HSCs and LSK cells in BM (Figure 1M; supplemental Figure 2K-L). The loss of HSCs was confirmed by secondary transplantation when transplanted recipient mice were used as donors for CD45.2/CD45.1 competitive repopulation (Figure 1N). In contrast, when lethally irradiated WT or Drd-DKO recipients were transplanted with WT donor LSK cells and analyzed after successful repopulation, HSC and LSK cell percentage were not significantly different in the resulting stromal cell–specific Drd-DKO (Drd-DKOΔSC) chimeras (Figure 1O-P; supplemental Figure 2M) lacking Drd2/Drd3 in nonhematopoietic cells. The observed differences in transplantation experiments with Drd-DKO cells are highly unlikely to be caused by a mixed genetic background, because we obtained very similar results with WT cells from C57/B6 or 129 mice (supplemental Figure 2N-P). Moreover, acute administration of haloperidol, which has high affinity for D2-type dopamine receptors and 50-fold to 4000-fold lower binding to other receptors, including serotonin and adrenergic receptors,64 results in a significant reduction in the percentage of LSK cells and HSCs (supplemental Figure 2Q-S) that involves increased apoptosis of these cells but is not related to altered levels of the chemokine Cxcl12 and SCF in BM (supplemental Figure 2T-V).
These results indicate that D2-type dopamine receptors are required for HSC and LSK cell maintenance in hematopoietic but not BM stromal cells. Furthermore, the above findings establish that alterations in Drd-DKO HSCs and progenitors are not caused indirectly (eg, by defects in brain physiology).
Blockade of dopamine synthesis phenocopies loss of HSCs and HSPCs
Next, we investigated whether blockade of dopamine synthesis results in a similar phenotype as does inactivation of D2-type receptors. Because Th is essential for dopamine synthesis, the neuromodulator can only be released by Th+ cell populations; accordingly, dopamine immunostaining is seen along Th+ nerve fibers in BM, which are also positive for Tuj1 (neuron-specific class 3 β-tubulin) and the neurotrophin receptor TrkA (Figure 2A-C; supplemental Figure 3A-B). In contrast, Th signal is undetectable in Emcn+ endothelial cells, Lepr+ mesenchymal cells, αSMA+ vascular smooth muscle cells, and lineage-committed hematopoietic cells (supplemental Figure 3C-F). This expression pattern is confirmed by a genetic approach involving a combination (Th-mTmG) of constitutively active Th-Cre and Rosa26-mTmG Cre reporter mice (supplemental Table 1). In lethally irradiated Th-mTmG mice transplanted with WT donor BM cells (Figure 2D), the GFP signal colocalizes with the presynaptic marker synaptophysin and endogenous Th (Figure 2E-F; supplemental Figure 3G-J). Furthermore, immunostaining shows that CD150+ CD48− CD41− Lin− HSCs are enriched in the vicinity of GFP+ nerves relative to random cells in Th-mTmG recipient mice (supplemental Figure 3K-L).
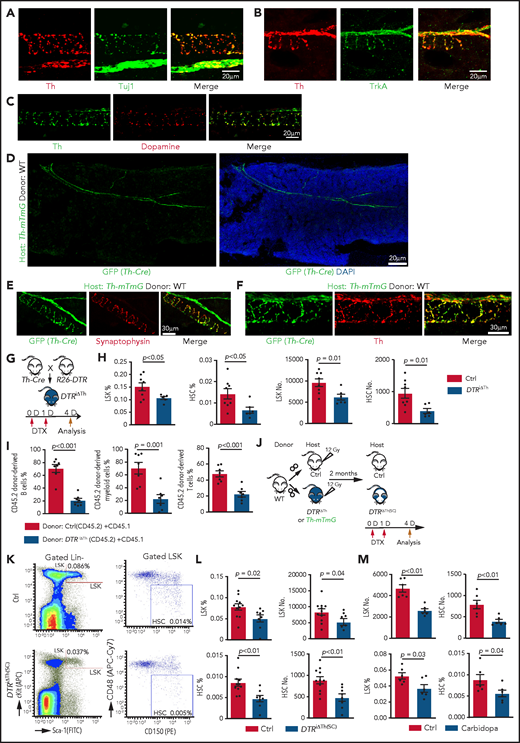
Blockade of dopamine synthesis impairs HSC maintenance. Representative confocal images showing expression pattern of endogenous Th protein in combination with Tuj1 (A) and TrkA (B) in WT BM. (C) Immunostaining showing distribution of dopamine and its colocalization with Th in BM. (D) Tile-scan image showing Th-Cre–driven GFP expression in Th-mTmG recipient BM. Colocalization of Th-Cre–driven GFP with neuronal presynaptic marker synaptophysin (E) and Th protein (F) in Th-mTmG recipients. (G) Diagram depicting genetic strategy for Th+ cell ablation after DTX administration. (H) Quantification of the percentages and numbers of LSK cells and HSCs in BM of DTRiΔTh (Cre+/T flox+/f; n = 6) and control (Cre+/+ flox+/f; n = 8) mice. The P value was calculated using the Student t test. (I) Quantification of donor-derived (CD45.2) B lymphocytes, T lymphocytes, and myeloid cells in competitive repopulating assay. A total of 5 × 10⁵ CD45.2 (Ctrl or DTRiΔTh) BM cells mixed with 5 × 10⁵ CD45.1 BM cells were transplanted into lethally irradiated CD45.1 recipients, which were analyzed 16 weeks later. Ctrl = 7; DTRiΔTh = 7. The P value was calculated using the Student t test. (J) Schematic diagram depicting WT BM transplantation into DTRiΔTh and control mice. DTX injection and HSC analysis were done 2 months after transplantation. Th-mTmG reporter mice were analyzed without toxin injection. (K) Representative FACS plots of LSK cells and HSCs in control and DTRiΔTh(SC) recipients after DTX administration. Numbers represent the percentages of the indicated cell populations in BM. (L) Quantification of the percentages (left panels) and numbers (right panels) of LSK cells and HSCs in control (n = 11) and DTRiΔTh(SC) (n = 8) recipient BM. The P value was calculated using the Student t test. (M) Quantification of the numbers and percentages of LSK cells and HSCs in BM from vehicle-injected (n = 6) or carbidopa-injected (n = 6) WT mice. The P value was calculated using the Student t test. APC, allophycocyanin; Ctrl, control; FITC, fluorescein isothiocyanate; PE, phycoerythrin.
Blockade of dopamine synthesis impairs HSC maintenance. Representative confocal images showing expression pattern of endogenous Th protein in combination with Tuj1 (A) and TrkA (B) in WT BM. (C) Immunostaining showing distribution of dopamine and its colocalization with Th in BM. (D) Tile-scan image showing Th-Cre–driven GFP expression in Th-mTmG recipient BM. Colocalization of Th-Cre–driven GFP with neuronal presynaptic marker synaptophysin (E) and Th protein (F) in Th-mTmG recipients. (G) Diagram depicting genetic strategy for Th+ cell ablation after DTX administration. (H) Quantification of the percentages and numbers of LSK cells and HSCs in BM of DTRiΔTh (Cre+/T flox+/f; n = 6) and control (Cre+/+ flox+/f; n = 8) mice. The P value was calculated using the Student t test. (I) Quantification of donor-derived (CD45.2) B lymphocytes, T lymphocytes, and myeloid cells in competitive repopulating assay. A total of 5 × 10⁵ CD45.2 (Ctrl or DTRiΔTh) BM cells mixed with 5 × 10⁵ CD45.1 BM cells were transplanted into lethally irradiated CD45.1 recipients, which were analyzed 16 weeks later. Ctrl = 7; DTRiΔTh = 7. The P value was calculated using the Student t test. (J) Schematic diagram depicting WT BM transplantation into DTRiΔTh and control mice. DTX injection and HSC analysis were done 2 months after transplantation. Th-mTmG reporter mice were analyzed without toxin injection. (K) Representative FACS plots of LSK cells and HSCs in control and DTRiΔTh(SC) recipients after DTX administration. Numbers represent the percentages of the indicated cell populations in BM. (L) Quantification of the percentages (left panels) and numbers (right panels) of LSK cells and HSCs in control (n = 11) and DTRiΔTh(SC) (n = 8) recipient BM. The P value was calculated using the Student t test. (M) Quantification of the numbers and percentages of LSK cells and HSCs in BM from vehicle-injected (n = 6) or carbidopa-injected (n = 6) WT mice. The P value was calculated using the Student t test. APC, allophycocyanin; Ctrl, control; FITC, fluorescein isothiocyanate; PE, phycoerythrin.
To block dopamine synthesis in nerves, we generated Th-Cre Rosa26-DTR (DTRiΔTh) mice in which diphtheria toxin (DTX) administration ablates Th+ cells (Figure 2G). This strategy efficiently eliminates Th+ signals, which are readily detectable around αSMA+ vascular smooth muscle cell–covered arteries in control, but not in DTRiΔTh, BM (supplemental Figure 3M) and causes a significant reduction in dopamine levels in DTRiΔTh BM extracellular fluid (supplemental Figure 3N-Q). DTX administration to Cre− mice does not influence the percentage of LSK cells, indicating that DTX does not influence HSPCs in an unspecific fashion (supplemental 3R). In contrast, nerve ablation in Cre+DTRiΔTh mice leads to a significant decrease in LSK cells and HSCs, as well as reduced proliferation in young adults (Figure 2H; supplemental Figure 3S). The reduction in HSCs is confirmed by CD45.2/CD45.1 competitive repopulation assay (Figure 2I).
To confirm that defects in DTRiΔTh mice are indeed induced by ablation of stromal Th+ cells, we transplanted lethally irradiated DTRiΔTh and control mice with WT BM cells and administered DTX after successful reconstitution [DTRiΔTh(SC)] (Figure 2J). In the presence of WT hematopoietic cells, DTRiΔTh(SC) recipients show a significant reduction in LSK cells and HSCs after DTX administration (Figure 2K-L).
Next, we interfered with dopamine synthesis outside of the brain by injecting carbidopa, which cannot cross the blood-brain barrier and, therefore, prevents conversion of L-3, 4-dihydroxyphenylalanine to dopamine by inhibiting the enzyme aromatic L-amino acid decarboxylase only in the peripheral nervous system.65 Consistent with our other findings, carbidopa treatment results in a significant reduction in LSK cells and HSCs (Figure 2M). Because Th is also required for the synthesis of noradrenaline and adrenaline, we administered the inhibitor ICI-118551 intraperitoneally to block the β2 adrenergic receptor,42 which does not induce significant changes in LSK cell percentage and hematopoiesis (supplemental Figure 4A-D). Together with 2 recent reports showing that young adult knockout mice lacking the β3 adrenergic receptor or the β2 and β3 adrenergic receptors do not exhibit a significant reduction in LSK cells,42,44 these findings argue that defective noradrenaline/adrenaline function is unlikely to be a major cause of the defective HSPC maintenance in young adult DTRiΔTh(SC) mice.
Thus, depletion of dopamine results in loss of HSCs and HSPCs, which phenocopies defects in Drd-DKO mice, arguing for direct regulation by dopamine.
Loss of dopamine signaling alters the transcription profile and cell cycle status of LSK cells
To address how dopamine regulates the functional properties of LSK cells, we sorted this population from WT and Drd-DKO mice for bulk RNA-seq analysis. Unsupervised clustering and principal component analysis of the RNA-seq data show that Drd-DKO LSK cell replicates are more similar to each other than to WT LSK cells (Figure 3A-B; supplemental Figure 4E). In a Bland-Altman plot, knockout of Drd2 and Drd3 results in the upregulation of 847 genes and downregulation of 965 genes at a significance of P < .05 (Figure 3C), which further supports a cell-autonomous function for dopamine signaling in LSK cells. Based on gene ontology analysis, several pathways controlling cell cycle and mitosis are among the top regulated candidates (Figure 3D). Downregulation of cell cycle–related genes and pathways are detected by Kyoto Encyclopedia of Genes and Genomes (KEGG) analysis (Figure 3E), which also reveals changes in other signaling activities (supplemental Figure 4F-G). Similar to Drd-DKO LSK cells, haloperidol treatment results in significant transcriptional changes and cell cycle defects in LSK cells (supplemental Figure 4H-L). These results indicate that D2-type receptors maintain the transcriptional profile and cell cycle status of LSK cells.
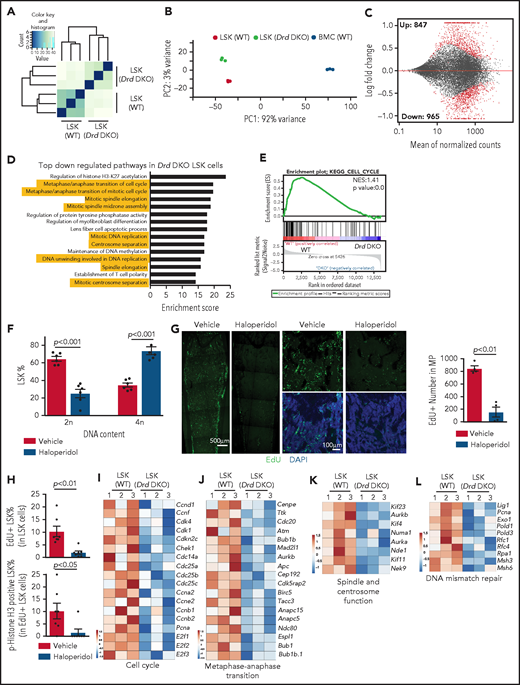
D2-type dopamine receptors regulate the transcription profile and cell cycle status of LSK cells. Unsupervised clustering (A) and principal components analysis (B) of RNA-seq results from Drd-DKO and WT LSK cells. (C) Bland-Altman plot showing 847 upregulated and 965 downregulated genes in Drd-DKO LSK cells relative to control at P <0.05 significance level. Red dots indicate differentially expressed genes. (D) Gene ontology analysis indicating the top downregulated pathways in Drd-DKO LSK cells. The yellow highlighting denotes cell cycle and mitosis-related pathways. (E) KEGG analysis indicating downregulation of the cell cycle pathway in Drd-DKO LSK cells. (F) Percentage of LSK cells with diploid (2n) or tetraploid (4n) DNA content after treatment with vehicle (n = 6) or haloperidol (n = 6). The P value was calculated using the Student t test. (G) Maximum intensity projections showing EdU incorporation in sections of distal long bone and, at higher magnification, in metaphysis after haloperidol treatment (left panels). Quantification of the number of EdU+ cells in metaphysis (area = 1 mm2) (right panel). Vehicle = 4; haloperidol = 4. (H) FACS-based quantification of EdU+ LSK cells and p-Histone H3+ EdU+ LSK cells after haloperidol treatment. The P value was calculated using the Student t test. Vehicle = 7; haloperidol = 7. Heat map of selected cell cycle (I), metaphase-anaphase transition (J), spindle/centrosome function (K), and DNA mismatch repair–related genes (L) in Drd-DKO and WT LSK cells.
D2-type dopamine receptors regulate the transcription profile and cell cycle status of LSK cells. Unsupervised clustering (A) and principal components analysis (B) of RNA-seq results from Drd-DKO and WT LSK cells. (C) Bland-Altman plot showing 847 upregulated and 965 downregulated genes in Drd-DKO LSK cells relative to control at P <0.05 significance level. Red dots indicate differentially expressed genes. (D) Gene ontology analysis indicating the top downregulated pathways in Drd-DKO LSK cells. The yellow highlighting denotes cell cycle and mitosis-related pathways. (E) KEGG analysis indicating downregulation of the cell cycle pathway in Drd-DKO LSK cells. (F) Percentage of LSK cells with diploid (2n) or tetraploid (4n) DNA content after treatment with vehicle (n = 6) or haloperidol (n = 6). The P value was calculated using the Student t test. (G) Maximum intensity projections showing EdU incorporation in sections of distal long bone and, at higher magnification, in metaphysis after haloperidol treatment (left panels). Quantification of the number of EdU+ cells in metaphysis (area = 1 mm2) (right panel). Vehicle = 4; haloperidol = 4. (H) FACS-based quantification of EdU+ LSK cells and p-Histone H3+ EdU+ LSK cells after haloperidol treatment. The P value was calculated using the Student t test. Vehicle = 7; haloperidol = 7. Heat map of selected cell cycle (I), metaphase-anaphase transition (J), spindle/centrosome function (K), and DNA mismatch repair–related genes (L) in Drd-DKO and WT LSK cells.
Next, we used several approaches to block dopamine signaling and study the effects on LSK cell mitosis. After haloperidol treatment, DNA content analysis shows significant enrichment of LSK cells in the tetraploid state (Figure 3F), which may reflect active proliferation or, alternatively, cell cycle arrest at the G2/M checkpoint. Arguing for the latter, transient (1-hour) EdU (5-ethynyl-2'-deoxyuridine) incorporation in vivo is significantly reduced in haloperidol-treated BM samples (Figure 3G). Haloperidol also reduces LSK cell proliferation, as indicated by the significant reduction in EdU incorporation and phospho-histone H3+ EdU+ double-positive LSK cells (Figure 3H). This is consistent with RNA-seq data showing downregulation of genes related to cell cycle, metaphase-anaphase transition, spindle/centrosome function, and DNA-mismatch repair in Drd-DKO LSK cells (Figure 3I-L). Furthermore, we detect accumulation of γH2Ax, a DNA damage marker, after haloperidol treatment (supplemental Figure 4M-N).66 These results establish that D2-type receptor activity preserves gene expression related to the proliferation and cell cycle status of LSK cells under steady-state conditions.
D2-type dopamine receptors regulate BM transplantation efficiency
Next, we investigated whether D2-type receptors play a role in allogeneic BM transplantation after lethal irradiation.32,67 We analyzed the transplantation efficiency at 2 weeks after transplantation, which is within the critical period for recipient survival that requires rapid proliferation and expansion of transplanted HSPCs.13,22,68 Irradiated WT recipients that had received Drd-DKO LSK cells (Drd-DKOΔHC) show significantly delayed hematopoietic reconstitution, with lower numbers of BMNCs, LSK cells, and CD45+ leukocytes relative to controls receiving WT LSK cells (Figure 4A-C). Drd-DKO LSK transplant-derived cells show a reduced Ki67 signal in BM, indicating reduced proliferation (Figure 4D). In contrast, no significant differences in hematopoietic reconstitution are detected 2 weeks after transplantation of WT LSK cells into lethally irradiated WT or Drd-DKO recipients (Figure 4E-G). Thus, D2-type dopamine receptors in hematopoietic cells, but not in stromal cells, are critical for BM transplantation.
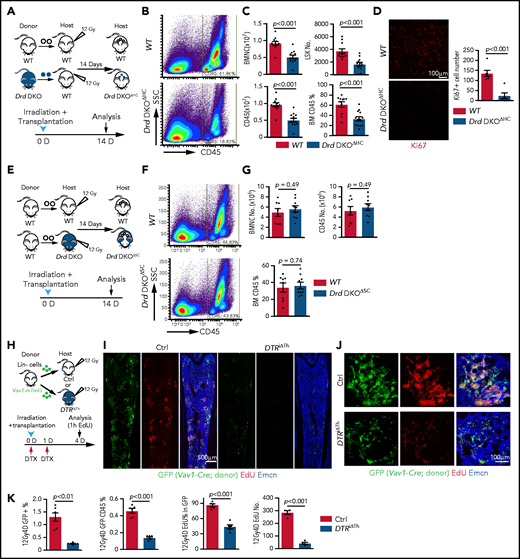
D2-type dopamine receptors regulate BM transplantation efficiency. (A) Diagram depicting the transplantation of WT or Drd-DKO LSK cells into lethally irradiated WT mice. (B) Pseudocolor FACS plot of CD45+ leukocytes in recipient BM, analyzed 14 days after transplantation. Numbers in rectangles represent the percentages of gated cells. (C) Quantification of BMNCs, LSK cells, and CD45+ cells (WT = 11; Drd-DKOΔHC = 13). The P value was calculated using the Student t test. (D) Confocal image of Ki67 staining in bone sections from recipients transplanted with WT or Drd-DKO cells (left panels). Quantification of Ki67+ cell number in each image field (right panel; WT = 6; Drd-DKOΔHC = 6). The P value was calculated using the Student t test. (E) Diagram depicting transplantation of LSK cells from WT mice into lethally irradiated WT or Drd-DKO recipients. (F) Representative FACS plot of CD45+ leukocytes in WT or Drd-DKOΔSC. Numbers in boxed areas represent the percentage of cells in the BM. (G) Quantification of BMNC and CD45+ cell number in WT (n = 8) or Drd-DKOΔSC (n = 9) recipients. The P value was calculated using the Student t test. (H) Scheme illustrating the lethal irradiation (12 Gy) of DTRiΔTh and littermate controls and transplantation of genetically labeled (GFP+) Lin− HSPCs from Vav1-Cre Rosa26-mTmG donors (day 0) and treatment with DTX on days 0 and 1. Following EdU injection at day 4, mice were euthanized 1 hour later for immunostaining and FACS analysis. (I) Overview of bone sections from DTRiΔTh or littermate control mice after lethal irradiation and transplantation of GFP-labeled donor cells. Green, donor-derived hematopoietic cells; red, EdU; blue, Emcn. (J) Representative confocal images of bone sections showing GFP+ cells (green), Emcn+ endothelial cells (blue), and EdU incorporation (red) in DTRiΔTh (lower panels) or littermate control (upper panels) mice. (K) Percentage of donor-derived GFP+ and GFP+ CD45+ cells by FACS (Ctrl = 6; DTRiΔTh = 6). Quantification of EdU+ cells in each field by imaging (Ctrl = 5; DTRiΔTh = 5). The P value was calculated using the Student t test. 1h, 1 hour; 12Gy4D, 4 days after lethal irradiation at 12Gy; Ctrl, control; D, day; SSC, side scatter.
D2-type dopamine receptors regulate BM transplantation efficiency. (A) Diagram depicting the transplantation of WT or Drd-DKO LSK cells into lethally irradiated WT mice. (B) Pseudocolor FACS plot of CD45+ leukocytes in recipient BM, analyzed 14 days after transplantation. Numbers in rectangles represent the percentages of gated cells. (C) Quantification of BMNCs, LSK cells, and CD45+ cells (WT = 11; Drd-DKOΔHC = 13). The P value was calculated using the Student t test. (D) Confocal image of Ki67 staining in bone sections from recipients transplanted with WT or Drd-DKO cells (left panels). Quantification of Ki67+ cell number in each image field (right panel; WT = 6; Drd-DKOΔHC = 6). The P value was calculated using the Student t test. (E) Diagram depicting transplantation of LSK cells from WT mice into lethally irradiated WT or Drd-DKO recipients. (F) Representative FACS plot of CD45+ leukocytes in WT or Drd-DKOΔSC. Numbers in boxed areas represent the percentage of cells in the BM. (G) Quantification of BMNC and CD45+ cell number in WT (n = 8) or Drd-DKOΔSC (n = 9) recipients. The P value was calculated using the Student t test. (H) Scheme illustrating the lethal irradiation (12 Gy) of DTRiΔTh and littermate controls and transplantation of genetically labeled (GFP+) Lin− HSPCs from Vav1-Cre Rosa26-mTmG donors (day 0) and treatment with DTX on days 0 and 1. Following EdU injection at day 4, mice were euthanized 1 hour later for immunostaining and FACS analysis. (I) Overview of bone sections from DTRiΔTh or littermate control mice after lethal irradiation and transplantation of GFP-labeled donor cells. Green, donor-derived hematopoietic cells; red, EdU; blue, Emcn. (J) Representative confocal images of bone sections showing GFP+ cells (green), Emcn+ endothelial cells (blue), and EdU incorporation (red) in DTRiΔTh (lower panels) or littermate control (upper panels) mice. (K) Percentage of donor-derived GFP+ and GFP+ CD45+ cells by FACS (Ctrl = 6; DTRiΔTh = 6). Quantification of EdU+ cells in each field by imaging (Ctrl = 5; DTRiΔTh = 5). The P value was calculated using the Student t test. 1h, 1 hour; 12Gy4D, 4 days after lethal irradiation at 12Gy; Ctrl, control; D, day; SSC, side scatter.
We also transplanted Lin− cells (Ter119− CD5− CD11b− CD45R− Ly-6G/C−) from Vav1-Cre Rosa26-mTmG double-transgenic mice, in which Lin− cells and their descendants are genetically labeled by GFP expression (Figure 4H; supplemental Figure 5A). Transplantation of these cells into DTRiΔTh mice or haloperidol-treated WT recipients results in substantially lower transplantation efficiency, as indicated by the percentage of GFP+ cells in recipients (Figure 4I-K; supplemental Figure 5B-D). EdU incorporation and the percentage of EdU+ cells in the GFP+ (donor-derived) population are significantly lower in DTRiΔTh mice and in haloperidol-treated mice, which are indicative of proliferation defects (Figure 4I-K; supplemental Figure 5B-E). These data establish that genetic or pharmacological blockade of dopamine signaling results in lower transplantation efficiency.
Next, we investigated the effect of irradiation on dopamine synthesis. At 7 days after lethal irradiation without transplantation, the total density of nerve fibers in BM is not changed (supplemental Figure 6A-B). In contrast, Th+ puncta number per length of nerve, as well as the signals for the presynaptic marker synaptophysin+, is reduced (Figure 5A-B; supplemental Figure 6C), which is accompanied by lower levels of dopamine in femoral extracellular fluid and bone sections (Figure 5C; supplemental Figure 6D-E). Because these alterations are indicative of functional defects in bone nerves and reduced dopamine production in BM after irradiation, we tested whether activation of D2-type receptors with the agonist 7-OH-DPAT can improve the transplantation process. Lin− donor cells from Vav1-Cre R26-mTmG mice were transplanted into lethally irradiated recipients in combination with repeated 7-OH-DPAT or vehicle administration once daily for 5 days (Figure 5D). 7-OH-DPAT treatment after transplantation leads to a significant increase in the percentage of GFP+ cells in recipient BM and a higher percentage of donor-derived leukocytes (Figure 5E-H). EdU incorporation into donor-derived (GFP+) cells is also increased, indicating that 7-OH-DPAT treatment promotes their expansion after transplantation (Figure 5F-H). Prolonged 7-OH-DPAT treatment every second day for 12 days (Figure 5I) increases LSK cell percentage, the number of BMNCs and CD45+ leukocytes in BM, indicating better recovery after transplantation (Figure 5J-K). These effects are accompanied by an increase in Ki67 signal, indicating more active proliferation in BM (Figure 5J-K). 7-OH-DPAT also significantly increases the number of colony-forming units (CFU) from FACS-sorted HSCs seeded in methylcellulose (Figure 5L; supplemental Figure 6F). These in vitro results strongly support a cell-autonomous function for D2-type receptors in HSCs.
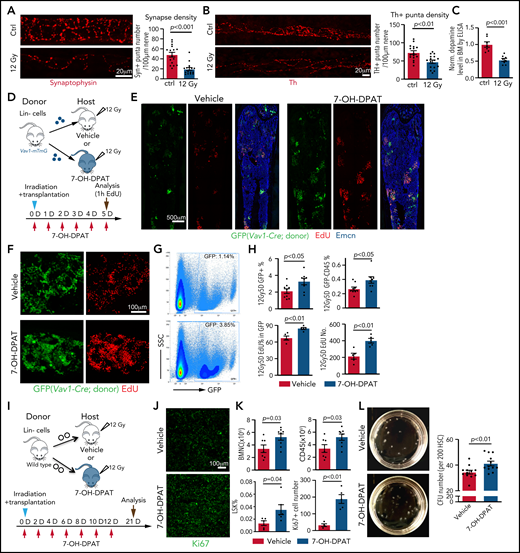
The D2-type receptor agonist 7-OH-DPAT promotes BM transplantation efficiency. Representative confocal images showing synaptophysin (A) and Th. The P value was calculated using the Student t test. (B) immunosignal in control (Ctrl) and irradiated BM at 7 days after 12 Gy irradiation. Quantification of the synaptophysin+ and Th+ puncta per length nerve. Ctrl = 16 slices from 3 mice; 12 Gy = 16 slices from 3 mice. (C) ELISA of dopamine levels in flushed BM extracellular fluid in control (ctrl) femur (n = 7) or 7 days after lethal irradiation (12 Gy) (n = 8). The P value was calculated using the Student t test. (D) Transplantation of Lin− cells from Vav1-Cre Rosa26-mTmG mice into 7-OH-DPAT–treated (short regimen, as indicated) or vehicle control mice after lethal irradiation. (E) Overview of bone sections from 7-OH-DPAT–treated or control mice after lethal irradiation and transplantation of GFP-labeled donor cells. (F) Representative confocal images showing GFP+ donor cells (green) and EdU incorporation (red) in sections from vehicle- and 7-OH-DPAT–treated long bone at 5 days after lethal irradiation and transplantation. (G) Representative FACS plot of GFP+ cells in irradiated and transplanted mice treated with vehicle or 7-OH-DPAT. (H) Quantification of the percentages of GFP+ cells and donor-derived CD45+ cells in BM by FACS (vehicle = 9; 7-OH-DPAT = 8). Quantification of EdU+ cells by imaging (vehicle = 5; 7-OH-DPAT = 5). The P value was calculated using the Student t test. (I) Schematic depiction of the transplantation of Lin− cells into 7-OH-DPAT–treated or vehicle control recipients (long treatment regimen) at day 21 after lethal irradiation. (J) Confocal images showing Ki67+ signal in bone sections from recipients treated with vehicle or 7-OH-DPAT. (K) Quantification of the numbers of BMNCs and CD45+ cells and the percentages of LSK cells (vehicle = 7; 7-OH-DPAT = 8). The P value was calculated using the Student t test. Quantification of Ki67+ cell number in each image field in panel J (vehicle = 4; 7-OH-DPAT = 5). (L) Representative images (dish at day 8 after seeding) (left panels) and quantification of CFU from 200 HSCs isolated from WT mice (right panel). 7-OH-DPAT or vehicle was added to MethoCult medium (vehicle = 12; 7-OH-DPAT = 12). The P value was calculated using the Student t test. 1h, 1 hour; D, day; SSC, scatter.
The D2-type receptor agonist 7-OH-DPAT promotes BM transplantation efficiency. Representative confocal images showing synaptophysin (A) and Th. The P value was calculated using the Student t test. (B) immunosignal in control (Ctrl) and irradiated BM at 7 days after 12 Gy irradiation. Quantification of the synaptophysin+ and Th+ puncta per length nerve. Ctrl = 16 slices from 3 mice; 12 Gy = 16 slices from 3 mice. (C) ELISA of dopamine levels in flushed BM extracellular fluid in control (ctrl) femur (n = 7) or 7 days after lethal irradiation (12 Gy) (n = 8). The P value was calculated using the Student t test. (D) Transplantation of Lin− cells from Vav1-Cre Rosa26-mTmG mice into 7-OH-DPAT–treated (short regimen, as indicated) or vehicle control mice after lethal irradiation. (E) Overview of bone sections from 7-OH-DPAT–treated or control mice after lethal irradiation and transplantation of GFP-labeled donor cells. (F) Representative confocal images showing GFP+ donor cells (green) and EdU incorporation (red) in sections from vehicle- and 7-OH-DPAT–treated long bone at 5 days after lethal irradiation and transplantation. (G) Representative FACS plot of GFP+ cells in irradiated and transplanted mice treated with vehicle or 7-OH-DPAT. (H) Quantification of the percentages of GFP+ cells and donor-derived CD45+ cells in BM by FACS (vehicle = 9; 7-OH-DPAT = 8). Quantification of EdU+ cells by imaging (vehicle = 5; 7-OH-DPAT = 5). The P value was calculated using the Student t test. (I) Schematic depiction of the transplantation of Lin− cells into 7-OH-DPAT–treated or vehicle control recipients (long treatment regimen) at day 21 after lethal irradiation. (J) Confocal images showing Ki67+ signal in bone sections from recipients treated with vehicle or 7-OH-DPAT. (K) Quantification of the numbers of BMNCs and CD45+ cells and the percentages of LSK cells (vehicle = 7; 7-OH-DPAT = 8). The P value was calculated using the Student t test. Quantification of Ki67+ cell number in each image field in panel J (vehicle = 4; 7-OH-DPAT = 5). (L) Representative images (dish at day 8 after seeding) (left panels) and quantification of CFU from 200 HSCs isolated from WT mice (right panel). 7-OH-DPAT or vehicle was added to MethoCult medium (vehicle = 12; 7-OH-DPAT = 12). The P value was calculated using the Student t test. 1h, 1 hour; D, day; SSC, scatter.
When Lin− donor cells from Drd-DKO mice are transplanted together with 7-OH-DPAT treatment, the beneficial effect of 7-OH-DPAT during transplantation is abolished (supplemental Figure 6G), confirming that the major target of 7-OH-DPAT to promote transplantation is through its interaction with D2-type dopamine receptors. Treatment of sorted LSK cells from WT mice, but not from Drd-DKO mice, with 7-OH-DPAT in vitro results in a significant increase in HSC number (supplemental Figure 6H-I). Transplantation of 7-OH-DPAT–treated WT LSK donor cells leads to higher repopulation efficiency relative to vehicle control (supplemental Figure 6J-K). These results indicate that the activation of D2-type dopamine receptors on HSCs and LSK cells can promote hematopoietic reconstitution after irradiation and transplantation.
Dopamine regulates Lck expression to influence ERK/MAPK signaling in LSK cells
Next, we investigated how dopamine exerts its effect on signaling in LSK cells under steady-state conditions and after BM transplantation. It is well established that extracellular regulated protein kinase (ERK)/MAPK signaling controls cell cycle and survival.69,70 Loss of ERK has been reported to result in HSC maintenance defects.71
To test whether the ERK/MAPK pathway acts downstream of dopamine signaling in HSPCs, we performed intracellular immunostaining of LSK cells ex vivo using flow cytometry (supplemental Figure 7A-C).72 At steady-state, Drd-DKO LSK cells exhibit lower levels of ERK/MAPK signaling, including phosphorylated ERK (pERK), pMEK, and pRaf (Figure 6A-B), whereas total ERK, MEK, and Raf are not significantly changed (supplemental Figure 7D). At 2 weeks after transplantation into lethally irradiated WT recipients, Drd-DKO donor–derived LSK cells show a significant reduction in the phosphorylation of the same ERK/MAPK pathway proteins (Figure 6C). Similar defects are detected in haloperidol-treated LSK cells (supplemental Figure 7E-F). This indicates that ERK pathway activity in LSK cells is controlled, in part, by dopamine signaling, which is also consistent with the known function of ERK signaling in the regulation of cell cycle and survival.69,71
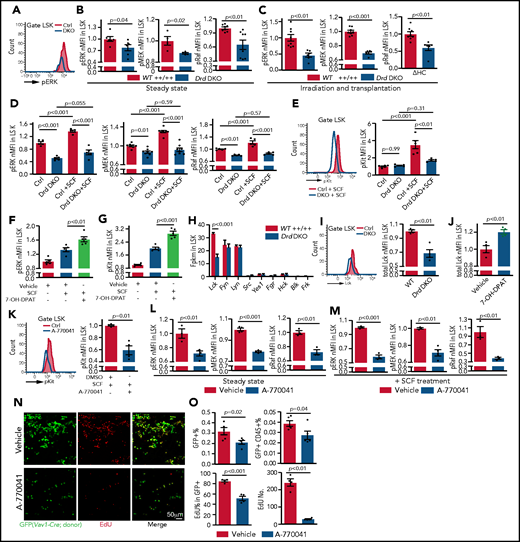
Dopamine regulates SCF/ERK signaling and Lck expression. (A) Representative line graph showing pERK in unstimulated Drd-DKO and control (Ctrl) LSK cells. (B) Normalized mean fluorescent intensity (nMFI) of ERK pathway protein phosphorylation in steady-state WT (n = 4-8) or Drd-DKO (n = 4-8) LSK cells. The P value was calculated using the Student t test. (C) ERK pathway phosphorylation in LSK cells from lethally irradiated mice at 14 days after transplantation with WT (n = 8) or Drd-DKO (n = 6) donor LSK cells. The P value was calculated using the Student t test. (D) ERK pathway phosphorylation in WT (n = 5-8) or Drd-DKO (n = 5-8) LSK cells with or without SCF treatment. The P values were calculated using analysis of variance (ANOVA). (E) Representative FACS line graphs showing flow cytometric analysis of c-Kit phosphorylation in Drd-DKO LSK cells and their controls. Normalized MFI of pKit in WT (n = 5) and Drd-DKO (n = 5) LSK cells with or without SCF treatment. The P values were calculated using ANOVA. nMFI of pERK (F) and pKit (G) in vehicle-treated (n = 5), SCF-stimulated vehicle-treated (n = 5), or SCF-stimulated 7-OH-DPAT–treated (n = 5) LSK cells. (H) Fragments per kilobase of transcript per million mapped reads (Fpkm) for transcripts encoding SFKs in WT and Drd-DKO LSK cells (n = 3 each). The P value was calculated using the Student t test. (I) Representative flow cytometric line graph of Lck protein in WT and Drd-DKO LSK cells (left panel). nMFI of total Lck under steady-state in WT (n = 4) and Drd-DKO (n = 4) LSK cells (right panel). (J) nMFI of total Lck in vehicle control–treated (n = 4) or 7-OH-DPAT–treated (n = 4) LSK cells. (K) Representative FACS line graph showing flow cytometric analysis of c-Kit phosphorylation in Lck inhibitor A-770041–treated LSK cells and their controls (left panel). nMFI of pKit in SCF-stimulated vehicle-treated (n = 4) or SCF-stimulated A-770041–treated (n = 4) LSK cells (right panel). ERK pathway protein phosphorylation in vehicle control (n = 3-4) or Lck inhibitor A-770041 (n = 3-4) treated LSK cells (L) and after SCF stimulation together with vehicle (n = 3-4) or A-770041 (n = 3-4) (M) The P value was calculated using the Student t test. (N) GFP+ cells (green) from Vav1-Cre Rosa26-mTmG donors and EdU incorporation (red) in sections from vehicle- or A-770041–treated long bone at 3 days after lethal irradiation and transplantation with Lin− cells. (O) Flow cytometric quantification of GFP+ cells and donor-derived CD45+ cells in BM (vehicle = 4; A-770041 = 4; upper panels). Quantification of the number and percentages of EdU+ cells in GFP+ donor cells by imaging (vehicle = 4; A-770041 = 4; lower panels). The P value was calculated using the Student t test.
Dopamine regulates SCF/ERK signaling and Lck expression. (A) Representative line graph showing pERK in unstimulated Drd-DKO and control (Ctrl) LSK cells. (B) Normalized mean fluorescent intensity (nMFI) of ERK pathway protein phosphorylation in steady-state WT (n = 4-8) or Drd-DKO (n = 4-8) LSK cells. The P value was calculated using the Student t test. (C) ERK pathway phosphorylation in LSK cells from lethally irradiated mice at 14 days after transplantation with WT (n = 8) or Drd-DKO (n = 6) donor LSK cells. The P value was calculated using the Student t test. (D) ERK pathway phosphorylation in WT (n = 5-8) or Drd-DKO (n = 5-8) LSK cells with or without SCF treatment. The P values were calculated using analysis of variance (ANOVA). (E) Representative FACS line graphs showing flow cytometric analysis of c-Kit phosphorylation in Drd-DKO LSK cells and their controls. Normalized MFI of pKit in WT (n = 5) and Drd-DKO (n = 5) LSK cells with or without SCF treatment. The P values were calculated using ANOVA. nMFI of pERK (F) and pKit (G) in vehicle-treated (n = 5), SCF-stimulated vehicle-treated (n = 5), or SCF-stimulated 7-OH-DPAT–treated (n = 5) LSK cells. (H) Fragments per kilobase of transcript per million mapped reads (Fpkm) for transcripts encoding SFKs in WT and Drd-DKO LSK cells (n = 3 each). The P value was calculated using the Student t test. (I) Representative flow cytometric line graph of Lck protein in WT and Drd-DKO LSK cells (left panel). nMFI of total Lck under steady-state in WT (n = 4) and Drd-DKO (n = 4) LSK cells (right panel). (J) nMFI of total Lck in vehicle control–treated (n = 4) or 7-OH-DPAT–treated (n = 4) LSK cells. (K) Representative FACS line graph showing flow cytometric analysis of c-Kit phosphorylation in Lck inhibitor A-770041–treated LSK cells and their controls (left panel). nMFI of pKit in SCF-stimulated vehicle-treated (n = 4) or SCF-stimulated A-770041–treated (n = 4) LSK cells (right panel). ERK pathway protein phosphorylation in vehicle control (n = 3-4) or Lck inhibitor A-770041 (n = 3-4) treated LSK cells (L) and after SCF stimulation together with vehicle (n = 3-4) or A-770041 (n = 3-4) (M) The P value was calculated using the Student t test. (N) GFP+ cells (green) from Vav1-Cre Rosa26-mTmG donors and EdU incorporation (red) in sections from vehicle- or A-770041–treated long bone at 3 days after lethal irradiation and transplantation with Lin− cells. (O) Flow cytometric quantification of GFP+ cells and donor-derived CD45+ cells in BM (vehicle = 4; A-770041 = 4; upper panels). Quantification of the number and percentages of EdU+ cells in GFP+ donor cells by imaging (vehicle = 4; A-770041 = 4; lower panels). The P value was calculated using the Student t test.
Dopamine receptors are G protein–coupled receptors and, therefore, are unlikely to directly activate ERK signaling,50 whereas the receptor tyrosine kinase c-Kit, the receptor for SCF, is known to trigger ERK activation.73,74 SCF derived from endothelial and perivascular reticular niche cells plays critical roles in HSC maintenance and BM transplantation.13,20,22 Following exposure to SCF ex vivo, Drd-DKO or haloperidol-treated WT LSK cells show significantly reduced phosphorylation of ERK, MEK, and Raf relative to control samples (Figure 6D; supplemental Figure 7G). SCF treatment induces phosphorylation of c-Kit at Tyr-703, a site that is required for association with Grb2 and, thereby, ERK activation.73Drd-DKO LSK cells show reduced phosphorylation of c-Kit after SCF treatment (Figure 6E). Conversely, treatment with 7-OH-DPAT and SCF significantly enhances c-Kit phosphorylation and ERK activation in LSK cells (Figure 6F-G).
Next, we investigated the underlying mechanism for the crosstalk between dopamine and ERK signaling. In different cell types, G protein–coupled receptors were found to transactivate receptor tyrosine kinases through mechanisms involving matrix metalloproteinases or β-arrestin.75,76 However, inhibition of matrix metalloproteinases with marimastat or inhibition of β-arrestin with barbadin has no significant effect on ERK phosphorylation in LSK cells (supplemental Figure 7H). Src family kinases (SFKs) are also known activators of ERK signaling, and treatment of LSK cells with the SFK inhibitor PP2 significantly downregulates ERK pathway protein phosphorylation (supplemental Figure 7I-J). Our RNA-seq analysis shows that Lck mRNA, encoding the SFK Lck,77 is highly expressed in LSK cells (Figure 6H; supplemental Figure 7K-L).78 Furthermore, Lck mRNA and protein are downregulated in Drd-DKO and haloperidol-treated LSK cells (Figure 6I; supplemental Figure 7M), whereas 7-OH-DPAT increases Lck protein expression (Figure 6J). Treatment of LSK cells with the specific Lck inhibitor A-770041, which has a much lower affinity for c-Src or Fyn,79 results in significantly decreased SCF-induced c-Kit phosphorylation and ERK activation (Figure 6K-M), whereas total ERK, MEK, and Raf are not significantly changed (supplemental Figure 7N). A-770041 treatment also results in lower BM transplantation efficiency, reduced EdU incorporation into donor cells in vivo, and impaired CFU formation ex vivo (Figure 6N-O; supplemental Figure 7O).
Next, we used lentiviruses to express short hairpin RNAs against Lck (shLck) in mouse cells (supplemental Figure 8A). Infection of LSK cells with shLck results in significant downregulation of Lck protein and reduced ERK phosphorylation (Figure 7A-B). Similar to A-770041 treatment, shLck-infected LSK cells show a significant reduction in colony formation ability and lower BM transplantation efficiency (Figure 7C; supplemental Figure 8B-D). Conversely, lentiviral overexpression of Lck results in higher Lck protein levels and ERK phosphorylation in Drd-DKO LSK cells (DKO+Lck) relative to control virus (DKO+GFP) (Figure 7D-E). Furthermore, the strong increase in SCF-induced ERK phosphorylation seen after Lck overexpression is abolished by knockdown of c-Kit (supplemental Figure 8E-F). In serial CFU assays, DKO+Lck cells show increased colony formation ability and absolute cell numbers (Figure 7F; supplemental Figure 8G-I). Although transplantation of DKO+GFP cells into lethally irradiated WT recipients leads to substantial lethality at 7 to 10 days after irradiation, no lethality is seen with the same number of DKO+Lck donor cells within this time period (Figure 7G-H). DKO+Lck-transplanted mice show significantly higher numbers of BMNCs and LSK cells, higher percentages of LSK and CD45+ cells, and increased LSK cell proliferation, as shown by EdU incorporation and Ki67 expression (Figure 7I-K). Thus, Lck overexpression can partially rescue key aspects of the Drd-DKO phenotype, consistent with Lck acting downstream of D2-type dopamine receptors in LSK cells.
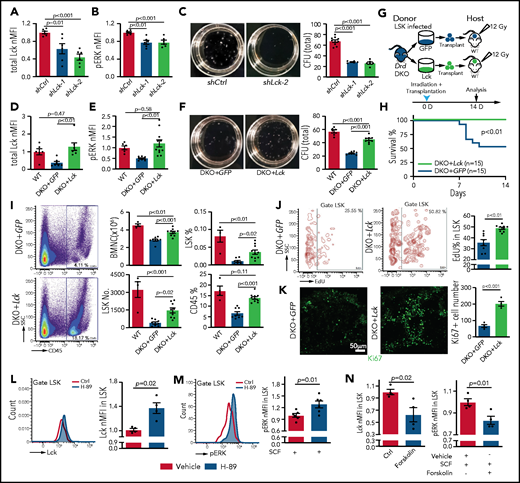
Lck overexpression rescues Drd-DKO HSPC defects. Lck protein expression (A) and pERK (B) in LSK cells infected with shCtrl (control shRNA) or shLck (n = 6 per group). (C) Representative images and quantification of total CFU from LSK cells infected with shCtrl (n = 10), shLck-1 (n = 5), or shLck-2 (n = 6). Lck protein expression (D) and pERK (E) in Drd-DKO LSK cells infected with GFP or Lck virus normalized to uninfected WT LSK cells. Total Lck, n = 6-7; pERK, n = 6-10. (F) Representative images and quantification of total CFU from Drd-DKO LSK cells infected with GFP (n = 8) or Lck virus (n = 8) relative to uninfected WT LSK cells (n = 6). (G) Scheme of Drd-DKO LSK cell infection and transplantation into lethally irradiated WT mice. (H) Survival curves after transplantation with Drd-DKO LSK cells infected with GFP (n = 15) or Lck virus (n = 15). Log-rank (Mantel-Cox) test was used to calculate the P value. (I) Representative pseudocolor plot of the percentage of CD45+ cells in BM from lethally irradiated mice transplanted with DKO+GFP or DKO+Lck LSK cells (left panels). Quantitation of the numbers of BMNCs and LSK cells and the percentages of LSK cells and CD45+ cells in recipients at 14 days after irradiation and transplantation (right panels). WT = 4 mice; GFP = 8 mice; Lck =10 mice. (J) Representative plots (left and middle panels) and quantitation of the percentage (right panel) of EdU+ cells in LSK cells from mice transplanted with DKO+GFP or DKO+Lck LSK cells. GFP = 8 mice; Lck = 10 mice. The P value was calculated using the Student t test. (K) Ki67 staining in bone sections (left and middle panels) and quantitation of Ki67+ cells per image field (GFP = 4; Lck = 4; right panel) from recipients transplanted with DKO+GFP or DKO+Lck LSK cells. The P value was calculated using the Student t test. (L) Representative line graph (left panel) and quantification of normalized mean fluorescent intensity (nMFI; right panel) of total Lck after H-89 treatment ex vivo (Ctrl = 4; H-89 = 4). (M) Representative line graph (left panel) and quantification of nMFI (right panel) of pERK after H-89 treatment together with SCF ex vivo (Ctrl = 6; H-89 = 6). (N) Quantification of nMFI of total Lck (left panel) and of pERK (right) after forskolin treatment together with SCF ex vivo (Ctrl = 4; forskolin = 4). In (A-F,I), the P values were calculated using analysis of variance. Ctrl, control; SSC, side scatter.
Lck overexpression rescues Drd-DKO HSPC defects. Lck protein expression (A) and pERK (B) in LSK cells infected with shCtrl (control shRNA) or shLck (n = 6 per group). (C) Representative images and quantification of total CFU from LSK cells infected with shCtrl (n = 10), shLck-1 (n = 5), or shLck-2 (n = 6). Lck protein expression (D) and pERK (E) in Drd-DKO LSK cells infected with GFP or Lck virus normalized to uninfected WT LSK cells. Total Lck, n = 6-7; pERK, n = 6-10. (F) Representative images and quantification of total CFU from Drd-DKO LSK cells infected with GFP (n = 8) or Lck virus (n = 8) relative to uninfected WT LSK cells (n = 6). (G) Scheme of Drd-DKO LSK cell infection and transplantation into lethally irradiated WT mice. (H) Survival curves after transplantation with Drd-DKO LSK cells infected with GFP (n = 15) or Lck virus (n = 15). Log-rank (Mantel-Cox) test was used to calculate the P value. (I) Representative pseudocolor plot of the percentage of CD45+ cells in BM from lethally irradiated mice transplanted with DKO+GFP or DKO+Lck LSK cells (left panels). Quantitation of the numbers of BMNCs and LSK cells and the percentages of LSK cells and CD45+ cells in recipients at 14 days after irradiation and transplantation (right panels). WT = 4 mice; GFP = 8 mice; Lck =10 mice. (J) Representative plots (left and middle panels) and quantitation of the percentage (right panel) of EdU+ cells in LSK cells from mice transplanted with DKO+GFP or DKO+Lck LSK cells. GFP = 8 mice; Lck = 10 mice. The P value was calculated using the Student t test. (K) Ki67 staining in bone sections (left and middle panels) and quantitation of Ki67+ cells per image field (GFP = 4; Lck = 4; right panel) from recipients transplanted with DKO+GFP or DKO+Lck LSK cells. The P value was calculated using the Student t test. (L) Representative line graph (left panel) and quantification of normalized mean fluorescent intensity (nMFI; right panel) of total Lck after H-89 treatment ex vivo (Ctrl = 4; H-89 = 4). (M) Representative line graph (left panel) and quantification of nMFI (right panel) of pERK after H-89 treatment together with SCF ex vivo (Ctrl = 6; H-89 = 6). (N) Quantification of nMFI of total Lck (left panel) and of pERK (right) after forskolin treatment together with SCF ex vivo (Ctrl = 4; forskolin = 4). In (A-F,I), the P values were calculated using analysis of variance. Ctrl, control; SSC, side scatter.
Finally, we investigated how Lck is regulated by D2-type dopamine receptors, which suppress cyclic adenosine monophosphate (cAMP)/protein kinase A (PKA) signaling in response to ligand binding.80 Treatment of WT and Drd-DKO LSK cells ex vivo with the PKA inhibitor H-89 upregulates expression of Lck (Figure 7L; supplemental Figure 8J). H-89 treatment enhances SCF-induced ERK phosphorylation in LSK cells (Figure 7M). Conversely, treatment of LSK cells with forskolin, which activates cAMP/PKA activity by stimulation of adenylate cyclase, downregulates Lck expression, as well as SCF-induced ERK phosphorylation (Figure 7N). These results argue for the involvement of cAMP/PKA signaling in the regulation of Lck by dopamine.
Together, our results indicate that Lck, regulated by dopamine signaling, controls ERK activation in LSK cells with important implications for c-Kit signaling and HSPC function.
Discussion
Based on the sum of our findings, we propose that dopamine in BM directly controls the homeostasis, proliferation, gene expression, and function of HSPCs through activation of D2-type dopamine receptors. Mechanistically, dopamine controls the expression of the kinase Lck,77,81 which, in turn, is required for activation of ERK signaling by c-Kit in response to SCF. In neurons and other cell types known to express D2-type receptors, transcripts are present at low levels so that positive cells are rare or absent in many single-cell RNA-seq data sets (supplemental Figure 9). However, low expression of D2-type receptor mRNA is sufficient to generate functional protein in neurons.63 Therefore, we have validated expression of Drd2 and Drd3 in LSK cells and HSCs using multiple independent approaches, including qPCR, Drd2-GFP reporter mice, flow cytometry, and immunostaining with the inclusion of Drd-DKO negative controls. These findings, together with our functional data, strongly argue for a cell-autonomous role for D2-type receptors in HSPCs.
Lck is involved in T-cell function and signal transduction downstream of c-Kit in cancer cells but is also expressed in LSK cells (supplemental Figure 7K-L).77,78,82-85 Vascular niches in BM are major sources of SCF, which controls HSC maintenance through activation of c-Kit.13,15,20-23 The strength of c-Kit signaling is critical for HSC function, as demonstrated by hematopoietic defects in partial loss-of-function (white spotting) mutant mice.31,86-88 The expression of Lck is changed in some clusters of HSPCs in KitW41 mice based on analysis of single-cell RNA-seq data.89 Previous work has shown that HSCs from all developmental stages present similar levels of c-Kit on the cell surface, despite substantial differences in sensitivity to SCF between, for example, fetal and adult HSCs.90 Such differences might be intrinsically preprogrammed but could also reflect a role for dopamine signaling and the modulation of Lck expression levels. Interestingly, there are results suggesting that SCF can act synergistically with other factors in human mast cells or prostate cancer cells.91,92 Based on our results, we propose that c-Kit activation and downstream signaling in LSK cells are influenced by dopamine. Considering that SCF and dopamine are provided by different cellular sources, this implies that c-Kit signaling in HSPCs is regulated by a combination of different external signals and not only by the local concentration of SCF alone.
Our work highlights the importance of D2-type dopamine receptors in the healthy and challenged hematopoietic system. Future research will explore whether therapeutic activation of D2-type dopamine receptors might be beneficial to preserve or enhance the functionality of the hematopoietic system in disease or after transplantation.
Acknowledgments
This work was supported by the Max Planck Society, the University of Münster, the Deutsche Forschungsgemeinschaft cluster of excellence “Cells in Motion,” the Leducq Foundation, and the European Research Council (AdG 786672, PROVEC). Y.L. was supported by Christiane Nüsslein-Volhard Stiftung.
Authorship
Contribution: R.H.A. designed research, interpreted data, and wrote the manuscript; Y.L. and Q.C. designed research, performed research, analyzed and interpreted data, and wrote the manuscript; H.-W.J. performed statistical analyses; J.F., H.D., and M.S. performed research; and D.H. and H.R.S. contributed vital new reagents.
Conflict-of-interest disclosure: The authors declare no competing financial interests.
Correspondence: Ralf H. Adams, Department of Tissue Morphogenesis, Max-Planck-Institute for Molecular Biomedicine and University of Münster, Roentgenstrasse 20, D-48149 Münster, Germany; e-mail: ralf.adams@mpi-muenster.mpg.de.
The data reported in this article have been deposited in the Gene Expression Omnibus (accession numbers GSE134444 and GSE126219).
Data sharing requests should be sent to Ralf H. Adams (ralf.adams@mpi-muenster.mpg.de).
The full-text version of this article contains a data supplement.
There is a Blood Commentary on this article in this issue.
The publication costs of this article were defrayed in part by page charge payment. Therefore, and solely to indicate this fact, this article is hereby marked “advertisement” in accordance with 18 USC section 1734.

This feature is available to Subscribers Only
Sign In or Create an Account Close Modal