

Key Points
In myeloid cells, the oncogenic mutation BRAFV600E induces inappropriate activation of trained immunity, a major proinflammatory program.
Trained immunity is the mechanistic link between BRAFV600E and inflammatory activation with cytokine production in ECD.

Abstract
Trained immunity (TI) is a proinflammatory program induced in monocyte/macrophages upon sensing of specific pathogens and is characterized by immunometabolic and epigenetic changes that enhance cytokine production. Maladaptive activation of TI (ie, in the absence of infection) may result in detrimental inflammation and development of disease; however, the exact role and extent of inappropriate activation of TI in the pathogenesis of human diseases is undetermined. In this study, we uncovered the oncogene-induced, maladaptive induction of TI in the pathogenesis of a human inflammatory myeloid neoplasm (Erdheim-Chester disease, [ECD]), characterized by the BRAFV600E oncogenic mutation in monocyte/macrophages and excess cytokine production. Mechanistically, myeloid cells expressing BRAFV600E exhibit all molecular features of TI: activation of the AKT/mammalian target of rapamycin signaling axis; increased glycolysis, glutaminolysis, and cholesterol synthesis; epigenetic changes on promoters of genes encoding cytokines; and enhanced cytokine production leading to hyperinflammatory responses. In patients with ECD, effective therapeutic strategies combat this maladaptive TI phenotype; in addition, pharmacologic inhibition of immunometabolic changes underlying TI (ie, glycolysis) effectively dampens cytokine production by myeloid cells. This study revealed the deleterious potential of inappropriate activation of TI in the pathogenesis of human inflammatory myeloid neoplasms and the opportunity for inhibition of TI in conditions characterized by maladaptive myeloid-driven inflammation.
Introduction
Trained immunity (TI) is a functional program physiologically elicited in monocyte/macrophages upon sensing of specific pathogens, which results in enhanced production of proinflammatory cytokines.1 Mechanistically, TI is characterized by epigenetic changes promoting transcription of proinflammatory genes,2,3 as well as immunometabolic changes, such as increased glycolysis, glutaminolysis, and cholesterol synthesis, which sustain enhanced proinflammatory activation.4,5 TI evolved as a protective mechanism against repeated infection, yet maladaptive activation of TI (ie, in the absence of infection) is emerging as a contributing factor in the pathogenesis of diseases characterized by excessive cytokine production by myeloid cells.6,7 However, the exact role and extent of inappropriate activation of TI in the pathogenesis of human inflammatory diseases remain undetermined.
Rare diseases characterized by extreme phenotypes often provide invaluable information about the relevance of specific molecular mechanisms to human pathophysiology. Erdheim-Chester disease (ECD) is a rare, severe inflammatory myeloid cancer characterized by infiltration of tissues by foamy macrophages (or histiocytes).8,9 Because virtually any tissue can be affected, the disease has pleomorphic clinical manifestations, with cardiovascular, pulmonary, and central nervous system involvement conferring a poor prognosis.10 The pathogenesis of ECD hinges upon 2 different, interconnected mechanisms occurring in monocytes: (1) deregulated activation of the MAPK pathway, most commonly caused by a mutation in the proto-oncogene BRAF (BRAFV600E)11-13; (2) rampant proinflammatory activation and cytokine production, resembling a systemic “cytokine storm.”14-16 Of note, mutated myeloid cells infiltrating affected tissues in ECD do not proliferate; however, cytokine and chemokine production results in progressive lesion growth through the recruitment of both mutated and nonmutated myeloid cells.17 Although this dual clonal-inflammatory nature of ECD has long fascinated scientists,17,18 the mechanistic link between deregulated activation of the MAPK pathway and downstream production of proinflammatory cytokines is still undetermined. Of note, monocytes that activate TI programs and ECD macrophages exhibit striking functional and phenotypic similarities: besides abundant cytokine production, both exhibit increased cholesterol synthesis that leads to a large size and a foamy appearance5,6 and rely on activation of the MAPK pathway for inflammatory activation.2,9
In this study, we hypothesized that induction of a maladaptive TI phenotype represents the missing link between clonal transformation and proinflammatory activation in ECD. The extreme phenotype of ECD illustrates how maladaptive activation of TI can result in the development of human inflammatory myeloid neoplasms, while also revealing the therapeutic potential of TI inhibition in conditions characterized by deregulated production of cytokines by myeloid cells.
Methods
Institutional Review Board approval
This study was approved by the Institutional Review Board of San Raffaele Hospital (approval 100/INT/2020) and was conducted in accordance with the Declaration of Helsinki.
Peripheral blood mononuclear cell and monocyte isolation
Peripheral blood mononuclear cells (PBMCs) were purified from buffy coats of healthy donors, provided by the Institutional Blood Bank. Monocytes were isolated by negative selection with magnetic beads (details are in the supplemental Material, available on the Blood Web site).
Lentiviral constructs and production
Lentiviral constructs and production are described in the supplemental Material.
Monocyte lentiviral transduction
Purified monocytes were transduced by adding noninfectious viruslike particles carrying Vpx (Vpx-VLPs) together with lentiviral constructs encoding for either BRAFWT or BRAFV600E at multiplicity of infection 1 (details are in the supplemental Material).19
Monocyte differentiation into macrophages
For macrophage differentiation, human monocytes isolated from PBMCs were cultured at 37°C for 6 to 7 days in complete RPMI 1640 medium supplemented with 20 ng/mL mouse macrophage colony-stimulating factor (Miltenyi Biotec). Medium was replaced every 2 days.
Flow cytometry
Flow cytometric analysis is described in the supplemental Material.
Oil Red-O staining
Oil Red-O staining was performed on ECD histiocytes, freshly isolated from a skin lesion upon liberase TM (12.5 μg/mL; Roche) treatment, and on myelomonocytic cells obtained and cultured for 7 days as just described (see details in the supplemental Material).
Microscopy
Cell morphology, BRAFWT/BRAFV600E expression, and Oil Red-O staining were examined by wide-field microscopy. Appropriate fluorescence filters were used to detect GFP-fused proteins and 4′,6-diamidino-2-phenylindole (DAPI)-stained nuclei. Images were taken with a 40× objective on a Zeiss AxioImagerM2m (AxioCam MRc5).
Immunohistochemistry
Immunohistochemistry of ECD tissues was performed as previously reported,15,20 using the antibodies anti-human interleukin-6 (IL-6; R&D System, Minneapolis, MN) and anti-phospho-p44/42 MAPK ERK1/2 (Thr202/Tyr204; Cell Signaling Technology, Danvers, MA).
Western blot
Methods and reagents for western blot analysis are described in the supplemental Material.
Total RNA sequencing library preparation and analysis
Cells were cultured for 6 days as described in “Monocyte differentiation into macrophages.” RNA was extracted from 1 × 10⁶ cultured cells or PBMCs isolated from the blood of patients with ECD by using ReliaPrep RNA Miniprep Systems (Promega Corporation) according to the manufacturer’s instructions. RNA from formalin-fixed, paraffin-embedded biopsy tissue was extracted upon deparaffinization using the AllPrep DNA/RNA FFPE Kit (Qiagen) according to the manufacturer’s instructions. RNA was quantified with The Qubit 2.0 Fluorometer (ThermoFisher), and its quality was assessed by the 4200 TapeStation (Agilent Technologies). Minimum quality was defined as RNA integrity number >7. One nanogram of total RNA was used for library preparation with SMART-Seq v4 Ultra Low Input RNA Kit (Takara Bio USA) and sequenced on a NextSeq 500 (Illumina). Total RNA sequencing and analysis are detailed in the supplemental Material.
Oxygen consumption rate and extracellular acidification rate assays
Oxygen consumption rate and extracellular acidification rate (ECAR) were measured with a Seahorse XFe96 Analyzer (Agilent Technologies, Santa Clara, CA), using the SeaHorse XF Cell Mito Stress Test and Glycolysis Stress Test, according to the manufacturer’s instructions. Detailed procedures are reported in supplemental Material.
Ultra-high-pressure liquid chromatography-mass spectrometry metabolomics and tracing experiments
Metabolomics studies were performed as previously reported.21,22 Detailed procedures are reported in supplemental Material.
Cytokine determination
Cytokine concentrations in supernatants and sera were determined with commercial enzyme-linked immunosorbent assay kits for human tumor necrosis factor α and IL-6 (both from R&D Systems, Minneapolis, MN), according to the manufacturer’s instructions (see details in supplemental Material).
In situ hybridization
In situ hybridization was performed according to the smiFISH (single-molecule inexpensive FISH) approach, where unlabeled primary probes are prehybridized to a secondary common fluorescently labeled probe.23 Detailed procedures are reported in the supplemental Material.
Chromatin immunoprecipitation
Cells were cultured for 6 days, as described in “Monocyte differentiation into macrophages,” and fixed with 1% formaldehyde (Sigma) at a concentration of 106cells per milliliter. Fixed cell preparations were sonicated, and immunoprecipitation was performed with antibodies against histone 3 lysine 4 trimethylation (H3K4me3) or histone 3 lysine 27 acetylation (H3K27Ac) (Diagenode). After chromatin immunoprecipitation, DNA was processed for quantitative polymerase chain reaction analysis (see details in supplemental Material).
Treatment of patients with ECD with vemurafenib
Treatment with the selective BRAFV600E inhibitor vemurafenib was administered at a dose of 480 mg daily, as per clinical recommendations.8
FDG-PET
For preparation of patients and image acquisition strategy, see the supplemental Material.
Ex vivo tissue culture in bioreactor
ECD skin biopsy samples were obtained for diagnostic purposes and cultured in the RCCS bioreactor (Synthecon, Houston, TX), as previously described.24 In brief, biopsy tissue was cut into 10 mm3 fragments and cultured (3 fragments/vessel) for 4 days in the presence or absence of the MAPK pathway inhibitor trametinib (GSK1120212; 1 nM). At the end of culturing, supernatants were collected for metabolite determination.
Statistical analysis
Statistical significance was determined as stated in the figure legends. P < .05 indicated statistically significant differences. Data were analyzed with GraphPad Prism 5.0. Data are shown as the mean ± standard error of the mean (SEM).
Results
Transduction of primary human monocytes with BRAFV600E recapitulates key features of ECD pathogenesis
ECD is a rare condition, and only a negligible subfraction of circulating monocytes of patients with ECD bear the causative BRAFV600E mutation, thus making it impractical to perform studies on primary cells. We thereby developed an innovative model to recapitulate the pathogenesis of ECD in vitro, by ectopically expressing BRAFV600E in primary human monocytes. Specifically, we developed a lentiviral vector expressing BRAFV600E and GFP under the ubiquitous human phosphoglycerate kinase promoter (Figure 1A). A lentiviral vector encoding wild-type BRAF provided an essential control, ensuring that observed biological effects are not caused by BRAF overexpression. This strategy, schematically represented in Figure 1B, yielded efficient delivery of the BRAFV600E transgene into primary human monocytes, whereas the reporter gene GFP allowed for the identification of cells expressing the transgene. GFP tracking by flow cytometry demonstrated effective transduction of BRAFV600E into healthy human monocytes (Figure 1C). Of note, forward and side scatter rates were significantly increased in monocytes transduced with BRAFV600E (Figure 1D), consistent with an increase in cell size and granularity. Bright-field microscopy studies confirmed that monocytes transduced with BRAFV600E underwent morphologic changes leading to a foamy appearance (Figure 1E). Notably, phenotypic changes also included an increase in cytoplasmic lipid content (Figure 1E; Oil Red O staining) and were overall highly reminiscent of foamy macrophages isolated from lesion tissue of patients affected by ECD (Figure 1F). The BRAFV600E mutation in ECD histiocytes results in constitutive activation of the downstream MAPK pathway intermediates ERK1 and ERK225,26 (Figure 1G). Western blot analysis confirmed that phosphorylation of ERKs occurs in myeloid cells transduced with BRAFV600E (Figure 1H). Constitutive activation was specific and restricted to the ERK1/2 MAPKs, as p38 MAPK phosphorylation was not increased in cells expressing BRAFV600E.

Macrophages expressing BRAFV600E recapitulate the pathologic phenotype of ECD. (A) Schematic representation of the lentiviral vector expressing BRAFV600E. (B) Experimental set up: monocytes isolated from the buffy coats of healthy donors were transduced with lentiviral constructs and cultured for 7 days before harvesting and analysis. (C) Expression level of wtBRAF (WT) and BRAFV600E (VE) as determined by GFP in flow cytometry; 10 independent donors are shown, with statistical significance evaluated with Friedman test with Dunn’s multiple-comparisons test; ns nonsignificant. (D) Flow cytometric analysis of forward and side scatter rates (FSC and SSC, respectively) of nontransduced macrophages (UT) or macrophages expressing wtBRAF (WT) and BRAFV600E (VE); 7 independent donors are shown, with statistical significance evaluated with Friedman test with Dunn’s multiple-comparisons test. ***P < .01. (E) Representative widefield images of staining with Oil Red O of nontransduced macrophages (UT) or macrophages expressing wtBRAF (WT) and BRAFV600E (VE). Cells were fixed, stained with DAPI and Oil Red O solution, and analyzed by widefield fluorescence microscopy to observe wtBRAF and BRAFV600E expression level (as determined by GFP detection), DAPI-stained nuclei, and Oil Red-O staining. Scale bars, 20 μm. (F) Oil Red-O staining of primary macrophages isolated from an ECD lesion (skin biopsy specimen, original magnification x400). Scale bar, 100 μm. (G) Immunohistochemistry staining showing phosphorylated ERK in macrophages infiltrating ECD lesions (skin biopsy specimen). (H) Western blot analysis of phosphorylated ERK1/2 (p-ERK1/2) and phosphorylated p38 (p-p38) in nontransduced macrophages (UT) or macrophages expressing wtBRAF (WT) and BRAFV600E (VE). The levels of total ERK1/2 and total p38 in whole-cell lysates were used as the protein loading control.
Macrophages expressing BRAFV600E recapitulate the pathologic phenotype of ECD. (A) Schematic representation of the lentiviral vector expressing BRAFV600E. (B) Experimental set up: monocytes isolated from the buffy coats of healthy donors were transduced with lentiviral constructs and cultured for 7 days before harvesting and analysis. (C) Expression level of wtBRAF (WT) and BRAFV600E (VE) as determined by GFP in flow cytometry; 10 independent donors are shown, with statistical significance evaluated with Friedman test with Dunn’s multiple-comparisons test; ns nonsignificant. (D) Flow cytometric analysis of forward and side scatter rates (FSC and SSC, respectively) of nontransduced macrophages (UT) or macrophages expressing wtBRAF (WT) and BRAFV600E (VE); 7 independent donors are shown, with statistical significance evaluated with Friedman test with Dunn’s multiple-comparisons test. ***P < .01. (E) Representative widefield images of staining with Oil Red O of nontransduced macrophages (UT) or macrophages expressing wtBRAF (WT) and BRAFV600E (VE). Cells were fixed, stained with DAPI and Oil Red O solution, and analyzed by widefield fluorescence microscopy to observe wtBRAF and BRAFV600E expression level (as determined by GFP detection), DAPI-stained nuclei, and Oil Red-O staining. Scale bars, 20 μm. (F) Oil Red-O staining of primary macrophages isolated from an ECD lesion (skin biopsy specimen, original magnification x400). Scale bar, 100 μm. (G) Immunohistochemistry staining showing phosphorylated ERK in macrophages infiltrating ECD lesions (skin biopsy specimen). (H) Western blot analysis of phosphorylated ERK1/2 (p-ERK1/2) and phosphorylated p38 (p-p38) in nontransduced macrophages (UT) or macrophages expressing wtBRAF (WT) and BRAFV600E (VE). The levels of total ERK1/2 and total p38 in whole-cell lysates were used as the protein loading control.
Macrophages in ECD lesions (Figure 2A) or isolated from the blood of patients with ECD (Figure 2B) exhibited deregulated spontaneous production of proinflammatory cytokines such as IL-6. These findings were recapitulated in macrophages expressing BRAFV600E, which exhibited spontaneous production of IL-6 (Figure 2C) and TNFα (Figure 2D). Consistent with this evidence, advanced microscopy studies using RNA smFISH confirmed that macrophages transduced with BRAFV600E exhibit spontaneous transcription of IL6 messenger RNA (mRNA), comparable to levels observed in primary macrophages stimulated with TNFα (Figure 2E-F). These findings indicate that macrophages expressing ectopic BRAFV600E exhibit constitutive activation of the MAPK pathway, transformation into foamy macrophages with a large lipid-laden cytoplasm, and production of proinflammatory cytokines, thus recapitulating genetic, phenotypic, and functional features of ECD macrophages.

Spontaneous cytokine production by macrophages expressing BRAFV600E. (A) Immunohistochemistry staining of an ECD biopsy specimen (lung lesion) showing IL-6 expression by infiltrating macrophages. Original magnification ×400. (B) Spontaneous production of IL-6 by circulating monocytes of patients with ECD compared with healthy controls. Bars indicate mean ± SEM; biological duplicates were performed for each condition. (C-D) Spontaneous production of IL-6 (C) and TNFα (D) by nontransduced macrophages (UT) or macrophages expressing wtBRAF (WT) and BRAFV600E (VE). Data are shown as the mean ± SEM (n = 4); biological duplicates were performed for each condition. (E) Representative smFISH images using probes targeted to IL6 mRNA; IL6 RNAs appear as scattered dots in the cell cytosol, whereas nascent mRNAs appear as 1 to 2 bright dots in the cell nucleus. Scale bar, 5 µm. (F) Quantification of cells with visible nascent IL6 mRNAs. *P < .05, Student t test (B-D).
Spontaneous cytokine production by macrophages expressing BRAFV600E. (A) Immunohistochemistry staining of an ECD biopsy specimen (lung lesion) showing IL-6 expression by infiltrating macrophages. Original magnification ×400. (B) Spontaneous production of IL-6 by circulating monocytes of patients with ECD compared with healthy controls. Bars indicate mean ± SEM; biological duplicates were performed for each condition. (C-D) Spontaneous production of IL-6 (C) and TNFα (D) by nontransduced macrophages (UT) or macrophages expressing wtBRAF (WT) and BRAFV600E (VE). Data are shown as the mean ± SEM (n = 4); biological duplicates were performed for each condition. (E) Representative smFISH images using probes targeted to IL6 mRNA; IL6 RNAs appear as scattered dots in the cell cytosol, whereas nascent mRNAs appear as 1 to 2 bright dots in the cell nucleus. Scale bar, 5 µm. (F) Quantification of cells with visible nascent IL6 mRNAs. *P < .05, Student t test (B-D).
Global gene expression analysis demonstrates activation of inflammatory programs consistent with TI in macrophages expressing BRAFV600E and in ECD lesion tissue
To study the transcriptional effects induced by BRAFV600E in macrophages, we performed whole-transcriptome analyses on transduced cells. Principal component and hierarchical clustering analysis of gene expression datasets revealed that the overall transcriptome of nontransduced and wild-type BRAF (BRAFWT)–expressing cells was similar and clustered together; conversely, the transcriptome of cells transduced with BRAFV600E clustered independently from controls (Figure 3A-B). Specifically, segregation of BRAFV600E-expressing cells displayed 5906 significantly differentially expressed genes (DEGs; 2906 upregulated and 3000 downregulated; false discovery rate [FDR] <0.01) compared with the controls (Figure 3C). We next confirmed that transcriptional effects induced by BRAFV600E in macrophages in vitro effectively recapitulate those spontaneously occurring in ECD lesions in vivo. Because myelomonocytic cells expressing BRAFV600E constitute up to 10% to 50% of cells in ECD tissue specimens, but only a marginal fraction (<1%) of circulating PBMCs,20 we performed whole-transcriptome analyses on matched tissue specimens and PBMCs from 3 patients with ECD to reveal the transcriptional effects induced by BRAFV600E in vivo. As expected, ECD tissue samples and PBMCs exhibited profound transcriptional differences (Figure 3C-D), with 4461 DEGs (3070 upregulated and 1391 downregulated (FDR <0.01; Figure 2E). Gene set enrichment analysis (GSEA) against Hallmark Gene Sets from Molecular Signatures Database (v7.1) revealed that DEGs identified in macrophages transduced with BRAFV600E and in ECD lesions were enriched for multiple shared categories (Figure 3G), notably including inflammatory activation (ie, inflammatory response) and immunometabolic activation (ie, hypoxia, glycolysis). Pathways associated with DNA damage responses (UV response) and mitogenic signaling (KRAS signaling) were also consistently activated, in line with expression of the BRAFV600E oncogene. A comparison between DEGs in macrophages transduced with BRAFV600E and ECD tissue biopsies confirmed tight consistency, again indicative of effective recapitulation of the disease phenotype (Figure 3H). Some differences in gene expression signatures were also observed (most notably related to interferon signaling) that likely reflect the cellular homogeneity in vitro vs the architectural and functional complexity of the lesion tissue microenvironment.
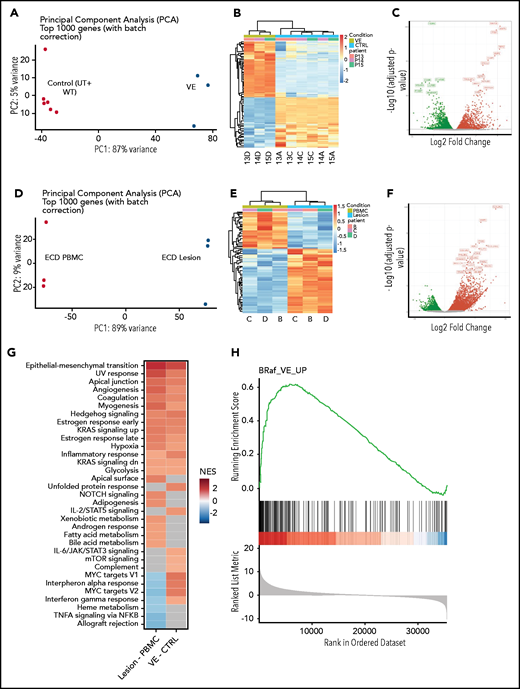
Global gene expression analysis in macrophages expressing BRAFV600E and in ECD lesion tissue. (A) Principal component analysis (PCA) of transcriptional profiles of primary human macrophages or of macrophages transduced with wtBRAF and BRAFV600E 6 days after transduction. (B) Unsupervised clustering analysis of DEGs in macrophages expressing BRAFV600E compared with controls (native and transduced with wtBRAF combined). (C) Volcano plots highlighting significant downregulated (green) and upregulated (red) genes in macrophages expressing BRAFV600E compared with controls (native and transduced with wtBRAF combined). (D) PCA of transcriptional profiles of matched PBMCs and ECD lesions from patients carrying the BRAFV600E mutation. (E) Unsupervised clustering analysis of DEGs in matched PBMCs and ECD lesions from patients carrying the BRAFV600E mutation. (F) Volcano plots highlighting significant downregulated (green) and upregulated (red) genes in matched PBMCs and ECD lesions from patients carrying the BRAFV600E mutation. (G) GSEA against Hallmark Gene Sets from Molecular Signatures Database (v7.1) showing enriched gene signatures identified in ECD lesions compared with matched PBMCs from patients (left) and in macrophages carrying BRAFV600E compared with controls (native and transduced with wtBRAF combined; right); NES, normalized enrichment score. (H) GSEA plot graph showing the concordance of the top upregulated gene signatures identified in macrophages carrying BRAFV600E compared with controls (native and transduced with BRAFwt combined) and in ECD lesions compared with matched PBMCs from patients.
Global gene expression analysis in macrophages expressing BRAFV600E and in ECD lesion tissue. (A) Principal component analysis (PCA) of transcriptional profiles of primary human macrophages or of macrophages transduced with wtBRAF and BRAFV600E 6 days after transduction. (B) Unsupervised clustering analysis of DEGs in macrophages expressing BRAFV600E compared with controls (native and transduced with wtBRAF combined). (C) Volcano plots highlighting significant downregulated (green) and upregulated (red) genes in macrophages expressing BRAFV600E compared with controls (native and transduced with wtBRAF combined). (D) PCA of transcriptional profiles of matched PBMCs and ECD lesions from patients carrying the BRAFV600E mutation. (E) Unsupervised clustering analysis of DEGs in matched PBMCs and ECD lesions from patients carrying the BRAFV600E mutation. (F) Volcano plots highlighting significant downregulated (green) and upregulated (red) genes in matched PBMCs and ECD lesions from patients carrying the BRAFV600E mutation. (G) GSEA against Hallmark Gene Sets from Molecular Signatures Database (v7.1) showing enriched gene signatures identified in ECD lesions compared with matched PBMCs from patients (left) and in macrophages carrying BRAFV600E compared with controls (native and transduced with wtBRAF combined; right); NES, normalized enrichment score. (H) GSEA plot graph showing the concordance of the top upregulated gene signatures identified in macrophages carrying BRAFV600E compared with controls (native and transduced with BRAFwt combined) and in ECD lesions compared with matched PBMCs from patients.
BRAFV600E induces immunometabolic changes indicative of TI in macrophages
TI is characterized by distinctive metabolic changes that sustain enhanced proinflammatory activation of monocyte/macrophages. Typical immunometabolic changes of TI induced by β-glucan include increased glycolysis, increased glutaminolysis through the tricarboxylic acid (TCA) cycle and increased cholesterol synthesis.4-627 We thereby investigated whether expression of BRAFV600E induces such immunometabolic changes in macrophages.
Induction of aerobic glycolysis through an AKT/mammalian target of rapamycin (mTOR)–dependent pathway is the metabolic basis of TI.4 Western blot analysis of myelomonocytic cells transduced with BRAVF600E revealed constitutive AKT phosphorylation (Figure 4A), and Seahorse Flux analyzer confirmed downstream induction of glycolysis (Figure 4B). Specifically, macrophages expressing BRAFV600E showed increased glycolysis compared with cells transduced with BRAFWT, as assessed by ECAR (Figure 4B-C; supplemental Figure 1). In addition, macrophages expressing BRAFV600E exhibited increased glycolytic capacity after glucose supplementation (supplemental Figure 1).

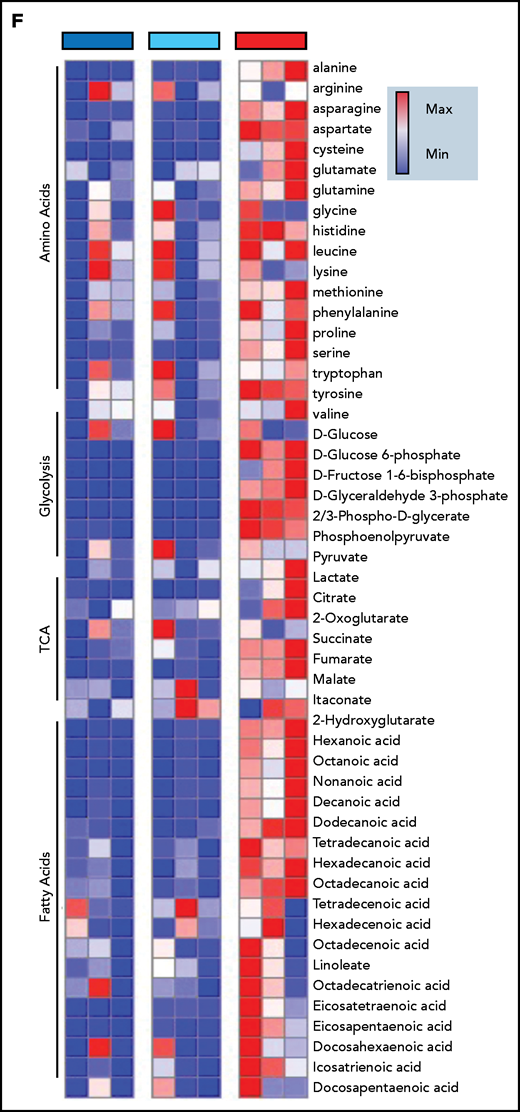
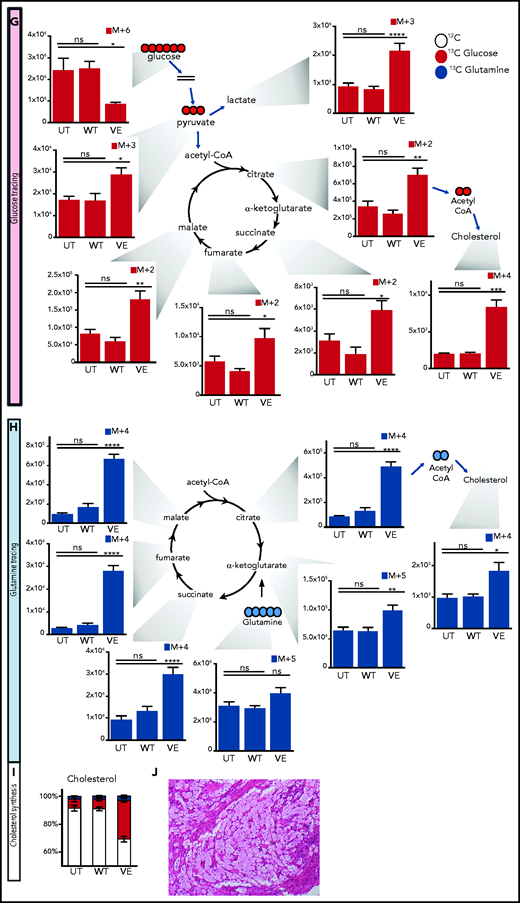
Immunometabolic changes indicative of TI in macrophages expressing BRAFV600E. (A) Western blot determination of phosphorylated AKT (p-AKT). The levels of total AKT in whole-cell lysates were used as the protein-loading control. (B) Analysis of ECAR measurements on primary human monocytes isolated from healthy volunteers in 3 different conditions, nontransduced (UT), transduced with wtBRAF (WT) or BRAFV600E (VE), in basal conditions and after sequential addition of glucose, oligomycin, and 2-DG. (C) Relative ECAR to oxygen consumption rate ratio (right). ***P < .001; ****P < .0001, unpaired Student t test. (D) Summary of metabolomics studies: primary human monocytes isolated from 3 healthy volunteers were cultured in 3 different conditions: nontransduced (UT, isolated primary monocytes), transduced with wtBRAF (WT), and transduced with BRAFV600E (VE). Cells were cultured in RPMI-1640+FBS only (Cold) or RPMI-1640+FBS with the addition of 13C6-glucose labeled glucose or 13C5-glutamine for tracing experiments. (E) Principal component analysis (PCA) of high-throughput metabolomics analysis on cold samples showing separation of experimental conditions along the component 1 axis (76.3%); interindividual variability is described by the component 2 axis (12.8%). (F) Hierarchical clustering analysis of the top 50 significant metabolites (Student t test) is represented as a heat map grouped by pathways that are known to be relevant to TI. (G) Overview of the glycolysis pathway in tracing experiments with U-13C6-glucose. (H) Overview of the TCA pathway in tracing experiments with 13C5-glutamine. (I) Incorporation of carbons in de novo synthesized cholesterol: carbon molecules deriving from either labeled glucose (red) or labeled glutamine (blue) are expressed as a percentage of the total. (J) Hematoxylin and eosin stain of ECD lesion (skin biopsy specimen, original magnification x200). (G-I) *P < .05; **P < .01; ***P < .001; ****P < .0001; ns, nonsignificant. Statistical significance of differences was evaluated with ANOVA. FBS, fetal bovine serum.
Immunometabolic changes indicative of TI in macrophages expressing BRAFV600E. (A) Western blot determination of phosphorylated AKT (p-AKT). The levels of total AKT in whole-cell lysates were used as the protein-loading control. (B) Analysis of ECAR measurements on primary human monocytes isolated from healthy volunteers in 3 different conditions, nontransduced (UT), transduced with wtBRAF (WT) or BRAFV600E (VE), in basal conditions and after sequential addition of glucose, oligomycin, and 2-DG. (C) Relative ECAR to oxygen consumption rate ratio (right). ***P < .001; ****P < .0001, unpaired Student t test. (D) Summary of metabolomics studies: primary human monocytes isolated from 3 healthy volunteers were cultured in 3 different conditions: nontransduced (UT, isolated primary monocytes), transduced with wtBRAF (WT), and transduced with BRAFV600E (VE). Cells were cultured in RPMI-1640+FBS only (Cold) or RPMI-1640+FBS with the addition of 13C6-glucose labeled glucose or 13C5-glutamine for tracing experiments. (E) Principal component analysis (PCA) of high-throughput metabolomics analysis on cold samples showing separation of experimental conditions along the component 1 axis (76.3%); interindividual variability is described by the component 2 axis (12.8%). (F) Hierarchical clustering analysis of the top 50 significant metabolites (Student t test) is represented as a heat map grouped by pathways that are known to be relevant to TI. (G) Overview of the glycolysis pathway in tracing experiments with U-13C6-glucose. (H) Overview of the TCA pathway in tracing experiments with 13C5-glutamine. (I) Incorporation of carbons in de novo synthesized cholesterol: carbon molecules deriving from either labeled glucose (red) or labeled glutamine (blue) are expressed as a percentage of the total. (J) Hematoxylin and eosin stain of ECD lesion (skin biopsy specimen, original magnification x200). (G-I) *P < .05; **P < .01; ***P < .001; ****P < .0001; ns, nonsignificant. Statistical significance of differences was evaluated with ANOVA. FBS, fetal bovine serum.
To investigate whether BRAFV600E induces immunometabolic rewiring, transduced cells were cultured in either plain culture medium or culture medium enriched with 13C6-glucose or 13C5-glutamine and were subjected to metabolomics studies (Figure 4D). Similar to gene expression studies, principal component analysis revealed that the metabolome of control and BRAFWT-expressing cells was comparable and clustered together (Figure 4E). Conversely, the metabolome of cells expressing BRAFV600E clustered independently from controls, indicative of profound metabolic rewiring (Figure 4E). Hierarchical clustering analysis of the top 50 significant metabolites grouped by pathways relevant to TI confirmed that BRAFV600E induced compatible and extensive immunometabolic rewiring (Figure 4F). Tracing experiments using either 13C6-glucose or 13C5-glutamine allow for determining incorporation of these metabolites into specific intermediates and their fueling of metabolic pathways. BRAFV600E induced marked activation of the glycolysis pathway, as revealed by increased generation of glycolysis intermediates as well as the end products pyruvate and lactate (Figure 4G). An additional immunometabolic hallmark of TI (that is, increased glutaminolysis fueling the TCA cycle) was also observed in macrophages expressing BRAFV600E, as determined by incorporation of 13C5-glutamine–derived carbons into the TCA intermediates α-ketoglutarate, citrate, malate, fumarate, and succinate (Figure 4H). Increased cholesterol synthesis is an additional immunometabolic hallmark of trained myeloid cells. Tracking incorporation of carbons derived from 13C6-glucose or 13C5-glutamine revealed increased de novo cholesterol synthesis in macrophages transduced with BRAFV600E, mostly fueled by increased glycolysis (Figure 4I). Of note, increased cholesterol synthesis was also observed in macrophages from patients with ECD, and resulted in a foamy, lipid-laden appearance (Figure 4J; compare with Oil Red-O staining in Figure 1F). Accumulation of intracellular lipids in macrophages expressing BRAFV600E was paralleled by upregulation of genes involved in lipid uptake, synthesis, and storage (ie, PPARγ, SREBF1, SREBF2, and ACSL4) and downregulation of genes related to lipid export (ie, CD36, ABCA1; supplemental Figure 2). Overall, these findings indicate that BRAFV600E in macrophages induces hallmark immunometabolic features of TI by exposure to β-glucan, such as glycolysis, increased glutaminolysis through the TCA cycle, and increased cholesterol synthesis.4-627
BRAFV600E induces epigenetic and functional secretory features of TI in macrophages
In TI, metabolites generated by immunometabolic changes activate chromatin-modifying enzymes, leading to gene-specific chromatin modifications associated with enhanced transcription of genes encoding inflammatory cytokines.28 Two key epigenetic marks characterize TI: H3K27Ac at distal enhancers and H3K4me3 at promoters of genes encoding cytokines.1,29 We therefore investigated epigenetic changes and enhanced cytokine production in myelomonocytic cells expressing BRAFV600E.
Macrophages expressing ectopic BRAFV600E exhibited the hallmark epigenetic features of TI on the promoters of genes encoding IL-6, and TNFα (Figure 5A-D). These epigenetic modifications altered the chromatin configuration that maintained these genes transcriptionally repressed in quiescent cells, thus increasing chromatin accessibility to transcription and enabling more robust cytokine production in response to stimulation with pathogens. Indeed, functional validation to the activation of TI in macrophages expressing BRAFV600E came from assessment of cytokine production after secondary stimulation with LPS, which simulates a subsequent encounter with a pathogen. Compared with native homologues, macrophages expressing the BRAFV600E mutation exhibited strikingly enhanced production of IL-6 (Figure 5E) and TNFα (Figure 5F) after stimulation with LPS. These findings indicate that the BRAFV600E oncogene in macrophages induces the typical epigenetic changes of TI, resulting in the hyperresponsiveness to inflammatory triggers, which represents the functional hallmark of TI.

Transduction of primary human monocytes with BRAFV600E induces epigenetic changes in TI and enhances cytokine production. ChIP polymerase chain reaction showing the percentage of H3K4me3 at promoters and the percentage of H3K27Ac at distal enhancers of genes encoding cytokines: H3K4me3 on IL6 (A); H3K27Ac on IL6 (C); H3K4me3 on TNFA (B); and H3K27Ac on TNFA (D). Monocytes were cultured in 3 different conditions: nontransduced (UT, isolated primary monocytes), transduced with wtBRAF (WT), and transduced with BRAFV600E (VE). Data are the mean ± SEM (n = 6). *P < .05, 1-way analysis of variance. (E-F) Cytokine production by macrophages at baseline and after stimulation with LPS: IL-6 (E); TNFα (F). Data are the mean ± SEM (n = 4); biological duplicates were performed for each condition. *P < .05; **P < .01, Student t test. ChIP, chromatin immunoprecipitation.
Transduction of primary human monocytes with BRAFV600E induces epigenetic changes in TI and enhances cytokine production. ChIP polymerase chain reaction showing the percentage of H3K4me3 at promoters and the percentage of H3K27Ac at distal enhancers of genes encoding cytokines: H3K4me3 on IL6 (A); H3K27Ac on IL6 (C); H3K4me3 on TNFA (B); and H3K27Ac on TNFA (D). Monocytes were cultured in 3 different conditions: nontransduced (UT, isolated primary monocytes), transduced with wtBRAF (WT), and transduced with BRAFV600E (VE). Data are the mean ± SEM (n = 6). *P < .05, 1-way analysis of variance. (E-F) Cytokine production by macrophages at baseline and after stimulation with LPS: IL-6 (E); TNFα (F). Data are the mean ± SEM (n = 4); biological duplicates were performed for each condition. *P < .05; **P < .01, Student t test. ChIP, chromatin immunoprecipitation.
Therapeutic targeting of TI suppresses inflammation in ECD
Evaluation of patients with ECD with fluorodeoxyglucose-positron emission tomography (FDG-PET), an imaging technique that measures glucose uptake by cells, revealed that macrophages infiltrating ECD lesions were characterized by marked metabolic activation and avid glucose uptake, a finding consistent with increased glycolysis induced by BRAFV600E (Figure 6A-B left). The selective BRAFV600E inhibitor vemurafenib is used clinically for the treatment of ECD. Treatment with vemurafenib resulted in metabolic shutdown of lesions (Figure 6A-B right), thus confirming that BRAFV600E is causative of the induction of glycolysis in ECD macrophages. Of note, previous studies from our group showed that vemurafenib treatment does not affect the viability of ECD macrophages, thus indicating that metabolic changes at FDG-PET are not attributable to the death of macrophages bearing the BRAFV600E mutation.24 Increased glucose metabolism at FDG-PET in patients with ECD is paralleled by high serum levels of the proinflammatory cytokines TNFα and IL-6, which were reduced upon treatment with vemurafenib (Figure 6C), again substantiating the causative link between BRAFV600E and macrophage proinflammatory activation in vivo. To explore the immunometabolic mechanisms linking BRAFV600E and proinflammatory activation of ECD macrophages, we used the bioreactor technology,17,24 which allows for long-term 3D culture of tissue biopsies obtained for diagnostic purposes (supplemental Figure 1). With this technique, we cultured ECD biopsy specimens for 4 days, with or without MAPK inhibition, and changes in the metabolome were assessed in supernatants. Metobolomics studies revealed that the hallmark immunometabolic changes of TI (ie, increased glycolysis and accumulation of fumarate and malate) occurred in ECD lesions in vivo; again, MAPK pathway inhibition dampened these metabolic effects (Figure 6D).

Therapeutic targeting of TI suppresses inflammation in ECD. (A) FDG-PET studies showing uptake of glucose by ECD lesions at baseline (left) and after clinical treatment with the selective BRAFV600E inhibitor vemurafenib (VEM) at a dose of 480 mg daily for 3 months. (B) Details from the FDG-PET evaluation shown in panel A: femoral (top panel), retroperitoneal (middle panel), and pineal (bottom panel, arrow) lesions. (C) Serum cytokines before and after therapeutic inhibition of BRAFV600E with VEM at a dose of 480 mg daily for 3 months. Data are the mean ± SEM (n = 4); *P < .05, Mann-Whitney U test. (D) Metabolomics analysis on supernatants of an ECD lesion (skin biopsy specimen) cultured in bioreactor in the presence or absence of the MAPK pathway inhibitor (MAPKi) trametinib (GSK1120212, 1 nM); supernatants were retrieved for metabolite determination after 4 days of culture. TCM: tissue culture medium (baseline comparison). (E) Cytokine production measured in the supernatant of nontransduced macrophages (UT) or macrophages expressing BRAFV600E (VE) cultured in the presence or absence of different treatments for 48 hours. 2DG, glycolysis inhibitor; BPTES, bis-2-(5-phenylacetamido-1,3,4-thiadiazol-2-yl)ethyl sulfide (glutaminolysis inhibitor). Data are shown as means ± SEM (n = 6); biological duplicates were performed for each condition. **P < .01; ***P < .001; ****P < .0001, paired Student t test.
Therapeutic targeting of TI suppresses inflammation in ECD. (A) FDG-PET studies showing uptake of glucose by ECD lesions at baseline (left) and after clinical treatment with the selective BRAFV600E inhibitor vemurafenib (VEM) at a dose of 480 mg daily for 3 months. (B) Details from the FDG-PET evaluation shown in panel A: femoral (top panel), retroperitoneal (middle panel), and pineal (bottom panel, arrow) lesions. (C) Serum cytokines before and after therapeutic inhibition of BRAFV600E with VEM at a dose of 480 mg daily for 3 months. Data are the mean ± SEM (n = 4); *P < .05, Mann-Whitney U test. (D) Metabolomics analysis on supernatants of an ECD lesion (skin biopsy specimen) cultured in bioreactor in the presence or absence of the MAPK pathway inhibitor (MAPKi) trametinib (GSK1120212, 1 nM); supernatants were retrieved for metabolite determination after 4 days of culture. TCM: tissue culture medium (baseline comparison). (E) Cytokine production measured in the supernatant of nontransduced macrophages (UT) or macrophages expressing BRAFV600E (VE) cultured in the presence or absence of different treatments for 48 hours. 2DG, glycolysis inhibitor; BPTES, bis-2-(5-phenylacetamido-1,3,4-thiadiazol-2-yl)ethyl sulfide (glutaminolysis inhibitor). Data are shown as means ± SEM (n = 6); biological duplicates were performed for each condition. **P < .01; ***P < .001; ****P < .0001, paired Student t test.
Finally, we evaluated the therapeutic potential of inhibiting TI for suppressing inflammation in ECD. The glycolysis inhibitor 2-deoxyglucose (2DG) inhibits activation of TI.4 Macrophages expressing BRAFV600E were cultured in the presence or absence of vemurafenib or 2DG for 48 hours, and supernatants were assessed for cytokine content. Treatment with 2DG effectively reduced production of IL-6 (Figure 6E). Of note, treatment with vemurafenib also reduced this cytokine, thus recapitulating the effects observed in patients with ECD. Treatment with the mTOR inhibitor rapamycin did not suppress cytokine production (Figure 6E), despite at least partial inhibition of glycolysis (supplemental Figure 4). Treatment with the glutaminase inhibitor BPTES, which inhibits glutaminolysis, resulted in a slight but significant decrease in cytokine production (Figure 6F); however, cell toxicity limited exploration of BPTES treatment at higher doses.
Because disease almost always recurs in patients with ECD upon discontinuation of MAPK inhibitors, we also investigated whether inhibition of TI would have more sustained effects in lowering proinflammatory activation. Macrophages expressing BRAFV600E were treated with vemurafenib or 2DG, and cytokine production was assessed after 48 hours; then, treatment-free culture medium was replaced and cytokine production was reassessed at 72 hours. As expected, the effects of vemurafenib on cytokine production waned upon treatment withdrawal, whereas suppression of cytokine production obtained with 2DG was maintained at 72 hours (supplemental Figure 5).
These findings indicate that effective therapeutic strategies for ECD combat the TI phenotype and that pharmacologic inhibition of glycolysis with 2DG effectively dampens cytokine production by macrophages expressing BRAFV600E.
Discussion
This study indicates that an oncogenic mutation along the MAPK pathway, specifically BRAFV600E, can induce a TI phenotype in myeloid cells in a cell-intrinsic, pathogen-independent fashion. This maladaptive, oncogene-induced activation of TI is relevant to the development of human disease, as illustrated by ECD, a severe inflammatory myeloid neoplasm characterized by excessive production of cytokines by macrophages. Therapeutic modulation of TI results in suppression of excessive cytokine production and in potential therapeutic applications for this and other conditions characterized by deregulated production of cytokines by myeloid cells.
TI is a proinflammatory program of myeloid cells that evolved to provide protection against repeated infections. Recognition of several pathogens can induce TI, but induction by β-glucan, a component of the cell wall of Candida albicans, was first and best characterized.2,28 β-Glucan binds the pattern recognition receptor dectin-1, which activates the AKT/mTOR signaling axis and induces changes in cell energy metabolism, such as increased glycolysis, glutaminolysis through the TCA cycle, and cholesterol synthesis.4-627 Metabolic intermediates derived from these processes, such as fumarate and acetyl-CoA, modulate the activity of enzymes involved in remodeling the epigenetic landscape of myeloid cells.28 Two key epigenetic changes ensue: an increase in H3K27Ac at distal enhancers and in H3K4me3 at promoters of genes encoding cytokines. Thus, induction of TI programs enables myeloid cells to deploy stronger transcription of proinflammatory genes, while also providing the energy that is necessary to sustain enhanced inflammatory activation. Functionally, this results in hyperresponsiveness to inflammatory triggers.
In this study, all these mechanisms and their functional consequences were recapitulated in macrophages expressing BRAFV600E. Although, strictly speaking, the BRAFV600E genetic mutation in macrophages does not induce “innate immune memory,” as the mutation is obviously persistent, the functional and molecular changes undergone by the ECD macrophages are all indicative of a maladaptive TI phenotype. Specifically, BRAFV600E induced activation of the AKT/mTOR signaling axis; increased glycolysis, glutaminolysis, and cholesterol synthesis; caused typical epigenetic changes in genes encoding IL-6 and TNFα; and enhanced constitutive cytokine production and hyperresponsiveness to stimulation with LPS, which is the functional hallmark of TI. This line of evidence indicates that TI in ECD is a nodal pathogenic mechanism, a link between oncogenic mutation and immunometabolic activation of macrophages, and a novel therapeutic target. These findings hold translational relevance, as the clinical effectiveness of vemurafenib and other kinase inhibitors in ECD is not fully satisfactory because of their remarkable toxicity, incomplete responses, or disease recurrence upon discontinuation.26,30,31 Combination therapy with kinase inhibitors and cytokine-blocking agents has been proposed in ECD, to target oncogenic as well as inflammatory activation.33-38 By targeting a novel, causal pathway in the pathogenesis and inflammatory activation of ECD, inhibition of TI has a strong clinical rationale and may attain results comparable to this dual pharmacologic approach.
Because immunometabolic circuits in TI are typically redundant, we screened multiple inhibitors as potential therapeutic agents for ECD. The glycolysis inhibitor 2DG effectively and persistently suppressed cytokine production, whereas the glutaminolysis inhibitor BPTES yielded more limited responses. A concept emerges that although metabolites generated during glutaminolysis and TCA cycle activation (ie, fumarate) induce the epigenetic modifications of TI, glycolysis represents the main energy supply mechanism of macrophages during hyperinflammatory activation. Indeed, although glycolysis is a relatively inefficient pathway for the generation of cellular adenosine triphosphate (ATP), netting only 2 molecules of ATP for every unit of glucose, it allows for rapid generation of ATP and biosynthetic precursors, both of which are immediately needed to enhance cytokine production.39 Of note, the mTOR inhibitor rapamycin did not suppress cytokine production, despite at least partial inhibition of glycolysis. This finding is consistent with previous evidence of pleiotropic and mixed anti-inflammatory and proinflammatory effects of rapamycin on myeloid cells,40 as well as with sparse clinical responses of patients with ECD treated with rapamycin.41 Overall, our findings identified the glycolysis inhibitor 2DG as a promising treatment for further development, either as a monotherapy or in combination with current strategies.
Our study has some limitations. Given the rarity of ECD, we developed a model to recapitulate the disease pathogenesis and phenotype in vitro, which was accomplished through lentiviral transduction of BRAFV600E. For practical reasons, we used primary human monocytes for our experiments; however, oncogenic mutations in patients with ECD affect hematopoietic precursors in the bone marrow.17,42-44 It is possible that transduction of differentiated cells would yield some differences in phenotypic output.42 Of note, this limitation marks an additional analogy with TI: although it is typically induced in vitro by stimulating monocytes obtained from the peripheral circulation, immunometabolic and epigenetic changes characteristic of TI in vivo occur in myeloid progenitors.45 Strengths of this study include the development of an innovative, clear-cut experimental model to recapitulate the pathogenesis of an otherwise difficult-to-study disease and the use of a broad array of relevant methodologies, to capture the intricacy of biological mechanisms underlying TI and the pathogenesis of ECD. Despite the complexity and the adoption of different experimental angles, our findings point at the same conclusion: oncogenic activation of the MAPK pathway by BRAFV600E induces a maladaptive TI phenotype in myeloid cells.
This study provides proof of concept for the hypothesis that maladaptive activation of TI leads to hyperinflammation and pathological tissue damage in human diseases.46 The role and extent of inappropriate activation of TI in the pathogenesis of ECD implicate investigational opportunities in other, related human inflammatory myeloid neoplasms (ie, Langerhans cell histiocytosis).28,42,47 Equally important, therapeutic opportunities may arise from pharmacologic targeting of TI in these and other conditions characterized by maladaptive, myeloid-driven inflammation.
Acknowledgments
The authors thank the Advanced Light and Electron Microscopy BioImaging Center (ALEMBIC) for support with image acquisition and analysis, the Erdheim-Chester Disease Global Alliance (ECDGA) for support of patients and physicians fighting ECD, and the Eureka Institute for Translational Medicine.
G.C. is supported by Italian Association for Cancer Research - AIRC under MFAG 2018 (ID 22136 project; principal investigator [PI], G.C.), FOREUM (Career Award 2020; PI G.C.), and the Interleukin Foundation. M.G.N. is supported by The Netherlands Organization for Scientific Research (Spinoza grant) and by the European Research Council (Consolidator Grant).
Authorship
Contribution: G.C. conceived the study; R.B., R.M., D.S., T.N., J.D.-A., R.J.A., I.M., D.M., S.Z., M.P., E.C., I.W.T., F.P., D.C., A.L., D.G., L.C., G.D., C.D., L.A.B.J., A.K.-R., C.A.D., M.F., and E.F. performed the experiments and analyzed data; P.M., G.D., J.H., G.D.L., A.T., C.C., and L.D. took clinical care of the patients; L.A.B.J., A.K.-R., C.A.D., S. Cardaci, A.B., S. Cenci, A.D., E.M., M.G.N., and G.C. supervised the study; and R.B., R.M., M.G.N., and G.C. drafted the manuscript.
Conflict-of-interest disclosure: The authors declare no competing financial interests.
Correspondence: Giulio Cavalli, IRCCS San Raffaele Scientific Institute, Via Olgettina 60, 20132 Milan, Italy; e-mail: cavalli.giulio@hsr.it.
Raw data are accessible in the public repository Gene Expression Omnibus (accession number GSE173830; https://www.ncbi.nlm.nih.gov/geo/query/acc.cgi?acc=GSE173830).
Original data will be shared upon reasonable request to the corresponding author (cavalli.giulio@hsr.it).
The online version of this article contains a data supplement.
The publication costs of this article were defrayed in part by page charge payment. Therefore, and solely to indicate this fact, this article is hereby marked “advertisement” in accordance with 18 USC section 1734.

This feature is available to Subscribers Only
Sign In or Create an Account Close Modal