

Key Points
IDH1-mutant mice develop myeloid dysplasia with anemia, ineffective erythropoiesis, and increased immature progenitors and erythroblasts.
D-2-hydroxyglutarate produced by mutated IDH1 inhibits enzymatic activity of oxoglutarate dehydrogenase, reducing succinyl-CoA production and thereby impairing heme synthesis.

Abstract
Isocitrate dehydrogenase (IDH) mutations are common genetic alterations in myeloid disorders, including acute myeloid leukemia (AML) and myelodysplastic syndrome (MDS). Epigenetic changes, including abnormal histone and DNA methylation, have been implicated in the pathogenic build-up of hematopoietic progenitors, but it is still unclear whether and how IDH mutations themselves affect hematopoiesis. Here, we show that IDH1-mutant mice develop myeloid dysplasia in that these animals exhibit anemia, ineffective erythropoiesis, and increased immature progenitors and erythroblasts. In erythroid cells of these mice, D-2-hydroxyglutarate, an aberrant metabolite produced by the mutant IDH1 enzyme, inhibits oxoglutarate dehydrogenase activity and diminishes succinyl–coenzyme A (CoA) production. This succinyl-CoA deficiency attenuates heme biosynthesis in IDH1-mutant hematopoietic cells, thus blocking erythroid differentiation at the late erythroblast stage and the erythroid commitment of hematopoietic stem cells, while the exogenous succinyl-CoA or 5-ALA rescues erythropoiesis in IDH1-mutant erythroid cells. Heme deficiency also impairs heme oxygenase-1 expression, which reduces levels of important heme catabolites such as biliverdin and bilirubin. These deficits result in accumulation of excessive reactive oxygen species that induce the cell death of IDH1-mutant erythroid cells. Our results clearly show the essential role of IDH1 in normal erythropoiesis and describe how its mutation leads to myeloid disorders. These data thus have important implications for the devising of new treatments for IDH-mutant tumors.
Introduction
Heterozygous missense point mutations of isocitrate dehydrogenase (IDH) are commonly found in human myeloid disorders, including 20% of acute myeloid leukemias (AMLs) and 5% to 12% of cases of myelodysplastic syndrome (MDS).1-4 It is widely accepted that the D-2-hydroxyglutarate (D-2HG) produced by the mutant IDH enzyme functions as an oncometabolite in that it competitively inhibits α-ketoglutarate (α-KG)–dependent dioxygenases and contributes to epigenetic alterations driving leukemogenesis.5 In IDH1-mutant mice, D-2HG blocks the differentiation of hematopoietic progenitors and induces disease-related epigenetic alterations.6 D-2HG also reduces the self-renewal of hematopoietic stem cells (HSCs) because it downregulates ataxia telangiectasia mutated, a DNA damage sensor.7 Recently, ivosidenib, an inhibitor of mutant IDH1,8,9 and enasidenib, an inhibitor of mutant IDH2,10,11 were approved by the US Food and Drug Administration to treat relapsed/refractory AML with IDH mutation. The clinical results of such treatments indicate that the inhibition of mutant IDH forces the differentiation of leukemia cells and improves patient outcomes.
During hematopoiesis, HSCs generate common myeloid progenitors (CMPs) that differentiate into megakaryocyte-erythroid progenitors (MEPs). MEPs in turn give rise to megakaryocytes and erythrocytes.12-15 With respect to leukemogenesis, IDH mutation is believed to be an initiating event that occurs in HSC or early progenitors,1,2,4,16-18 in line with the observation that IDH mutation is found in almost all AML morphologic subtypes. However, the incidence of IDH mutation in erythroid leukemia (the M6 subtype in the French-American-British classification) is extremely low compared with other subtypes.19-22 Although IDH mutation has been detected in erythroid colonies derived from patients with leukemia,17 mice bearing either a myeloid-specific (LysM-Cre) or pan-hematopoietic (Vav-Cre) knock-in mutation of IDH1 fail to develop typical leukemia.6,7 Instead, these animals exhibit obvious anemia with extramedullary hematopoiesis,6 a common abnormality of myeloid disorders. It is therefore imperative to clarify the role of IDH in normal erythropoiesis and determine how IDH mutation disrupts this process to support leukemogenesis.
Emerging evidence suggests that metabolism and bioenergetics must cooperate to coordinate normal HSC maintenance and lineage specification.23,24 IDH mutation reportedly alters glutamine, lipid, and glucose metabolism in transformed non-hematopoietic cells,25 but whether IDH mutation affects hematopoietic cell metabolism and/or erythroid differentiation remains unclear. During erythropoiesis, erythroblasts gradually accumulate stores of hemoglobin, which is composed of globin protein and the heme prosthetic group. Hence, proper heme biogenesis and degradation are critical for erythropoiesis.26 Heme biosynthesis commences with the condensation of succinyl–coenzyme A (CoA) and glycine in a process that is closely related to the Krebs cycle.27 Succinyl-CoA is mainly derived from α-KG, a pivotal molecule functioning in the anaplerosis and cataplerosis of the Krebs cycle. In IDH-mutant cells, α-KG production is impaired, partly due to the loss of wild-type (WT) IDH activity,28 and partly due to the overwhelming amounts of D-2HG produced by the mutant IDH1 enzyme.21 These observations prompted us to hypothesize that erythropoiesis was defective in IDH-mutant mice due to impairments of the Krebs cycle and heme synthesis.
In the current study, we show that IDH1 mutation impedes both succinyl-CoA production and heme metabolism, resulting in defective erythroid lineage commitment, differentiation, and survival. These deficits lead to the development of MDS-like disease in the mutant mice.
Materials and methods
Mice
The generation of conditional IDH1-R132Q-LSL mice was as previously described.6,7 IDH1-R132Q-LSL mice were bred with VavCre mice (The Jackson Laboratory; catalog no. 008610) to produce VavCre/IDH1-KI mice (C57BL6/129Ola9). All animal experiments were approved by the University Health Network Animal Care Committee (ID: AUP985) or the Fourth Military Medical University.
Immunohistochemistry, flow cytometry, immunoblotting, and cell separation by magnetic-activated cell sorting
Protocols and antibody information are available in the supplemental Materials and methods (available on the Blood Web site).
Liquid chromatography mass spectrometry
Protocols are available in the supplemental Materials and methods.
Cell culture and lentivirus transduction
Protocols are available in the supplemental Materials and methods.
Target identification using drug affinity responsive target stability
Protocols are available in the supplemental Materials and methods.
Oxoglutarate dehydrogenase activity measurement
The Oxoglutarate Dehydrogenase (OGDH) Activity Assay Kit from Abcam (catalog no: ab185440) was used. OGDH activity in lysates of cells treated (or not) with D-2HG was measured at optical density (OD) 450 nm using the kinetic mode of a FlexStation 3 spectrophotometer (Molecular Devices).
Colony formation, heme measurement by fluorometry, and quantitative polymerase chain reaction
Protocols are available in the supplemental Materials and methods.
Staining of cells/tissues with hematoxylin and eosin, Perls’ Prussian Blue, Masson’s trichrome or May-Grünwald-Giemsa, peroxidase staining of cells, and transmission electron microscopy
Protocols are available in the supplemental Materials and methods.
Results
IDH1-mutant mice develop myeloid dysplasia with anemia and ineffective erythropoiesis
To characterize erythropoiesis in the presence of mutant IDH1 activity, we used pan-hematopoietic mutant IDH1 knockin (IDH1-KI; VavCre/IDH1WT/R132Q) and control (VavCre/IDH1WT/WT) mice generated as previously described.6 At 3 to 5 months of age, complete blood count analysis showed that red blood cell numbers in IDH1-KI mice had decreased by ∼15% compared with controls (Figure 1A). Hemoglobin and hematocrit levels were also reduced in mutant blood, but the mean corpuscular volume was slightly increased. In addition, platelet numbers were decreased by ∼25% in IDH1-KI mutants, whereas white blood cell numbers were comparable between IDH1-KI and control mice. Skeletal dissection of the lower limbs revealed that the color of these bones in IDH1-KI mice was significantly paler than that of bones from control mice, a difference made more obvious when bone marrow (BM) cell pellets were compared (Figure 1B). Histologic analysis showed that erythrocytes were profoundly decreased in the BM of IDH1-KI mice, as indicated by immunohistochemical staining to detect the erythroid cell-specific marker Ter-119 (Figure 1C). Flow cytometric analysis confirmed that IDH1 mutation consistently reduced the proportion of Ter-119+ nucleated erythroid cells (erythroblasts), but not CD11b+ myeloid cells, among nucleated BM cells (Figure 1D).
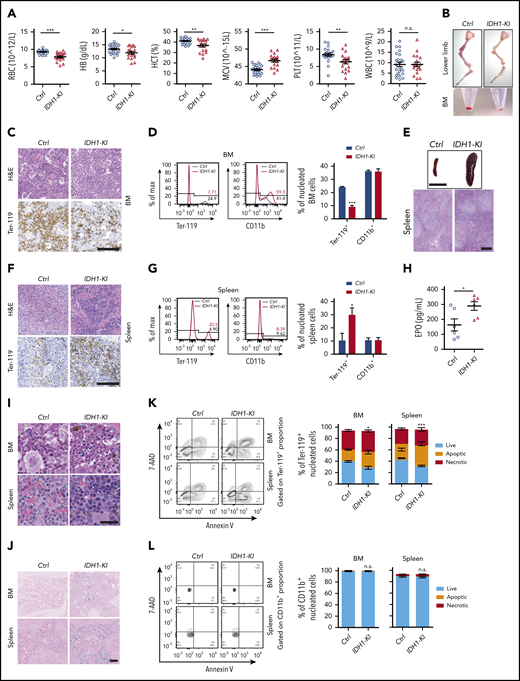
Mutant IDH1 knockin mice suffer from anemia and dyshematopoiesis. (A) Complete blood count (CBC) analysis of peripheral blood from 3- to 5-month-old control (Ctrl) (VavCre/IDH1WT/WT) and IDH1-KI (VavCre/IDH1WT/R132Q) mice (n = 24 for Ctrl; n = 18 for IDH1-KI). (B) Macroscopic views of the lower limb skeleton (top) and limb BM (bottom) cell pellets from Ctrl and IDH1-KI mice. Results are representative of 8 pairs of mice. (C) Hematoxylin and eosin (H&E) staining (top) and immunostaining (bottom) to detect the erythroid-specific marker Ter-119 in sections of BM of lower limbs from Ctrl and IDH1-KI mice in panel B (n = 5/group). Scale bar, 100 μm. (D) Left, flow cytometric analysis of percentages of Ter-119+ and CD11b+ cells in nucleated BM cells from Ctrl and IDH1-KI mice. Right, quantitation of the data in the left panels. Data are the mean ± SEM (n = 3). (E) Macroscopic views (top) and H&E staining (bottom) of spleens from control and IDH1-KI mice (n = 5/group). Scale bar, 1 cm (top) or 100 μm (bottom). (F) H&E staining (top) and Ter-119 staining (bottom) of spleens from Ctrl and IDH1-KI mice (n = 3/group). Scale bars, 100 μm. (G) Left, flow cytometric analysis of percentages of Ter-119+ and CD11b+ cells among nucleated spleen cells from Ctrl and IDH1-KI mice. Right, quantitation of the results in the left panel. Data are the mean ± SEM (n = 3/group). (H) Serum erythropoietin (EPO) level analysis by ELISA from 3- to 5-month-old Ctrl and IDH1-KI mice. Data are the mean ± SEM (n = 6/group). H&E (I) and Perls’ Prussian Blue (J) staining of BM and spleen sections from Ctrl and IDH1-KI mice (n = 3/group). Blue arrowhead in panel I, deposited pigment. Scale bar, 50 μm (I) or 100 μm (J). (K-L) Left, flow cytometric analysis of cell death as determined by7-AAD/Annexin V staining of Ter-119+ erythroblasts (K) and CD11b+ myeloid cells (L) from the BM and spleen of Ctrl and IDH1-KI mice. Right, quantitation of percentages of live, apoptotic (7-AAD–Annexin V+), and necrotic (7-AAD+Annexin V+) cells in the left panels. Data are the mean ± SEM (n = 4). *P < .05; **P < .01; ***P < .001. RBC, red blood cells; HB, hemoglobin; HCT, hematocrit; MCV, mean corpuscular volume; n.s., not significant; PLT, platelet; WBC, white blood cells.
Mutant IDH1 knockin mice suffer from anemia and dyshematopoiesis. (A) Complete blood count (CBC) analysis of peripheral blood from 3- to 5-month-old control (Ctrl) (VavCre/IDH1WT/WT) and IDH1-KI (VavCre/IDH1WT/R132Q) mice (n = 24 for Ctrl; n = 18 for IDH1-KI). (B) Macroscopic views of the lower limb skeleton (top) and limb BM (bottom) cell pellets from Ctrl and IDH1-KI mice. Results are representative of 8 pairs of mice. (C) Hematoxylin and eosin (H&E) staining (top) and immunostaining (bottom) to detect the erythroid-specific marker Ter-119 in sections of BM of lower limbs from Ctrl and IDH1-KI mice in panel B (n = 5/group). Scale bar, 100 μm. (D) Left, flow cytometric analysis of percentages of Ter-119+ and CD11b+ cells in nucleated BM cells from Ctrl and IDH1-KI mice. Right, quantitation of the data in the left panels. Data are the mean ± SEM (n = 3). (E) Macroscopic views (top) and H&E staining (bottom) of spleens from control and IDH1-KI mice (n = 5/group). Scale bar, 1 cm (top) or 100 μm (bottom). (F) H&E staining (top) and Ter-119 staining (bottom) of spleens from Ctrl and IDH1-KI mice (n = 3/group). Scale bars, 100 μm. (G) Left, flow cytometric analysis of percentages of Ter-119+ and CD11b+ cells among nucleated spleen cells from Ctrl and IDH1-KI mice. Right, quantitation of the results in the left panel. Data are the mean ± SEM (n = 3/group). (H) Serum erythropoietin (EPO) level analysis by ELISA from 3- to 5-month-old Ctrl and IDH1-KI mice. Data are the mean ± SEM (n = 6/group). H&E (I) and Perls’ Prussian Blue (J) staining of BM and spleen sections from Ctrl and IDH1-KI mice (n = 3/group). Blue arrowhead in panel I, deposited pigment. Scale bar, 50 μm (I) or 100 μm (J). (K-L) Left, flow cytometric analysis of cell death as determined by7-AAD/Annexin V staining of Ter-119+ erythroblasts (K) and CD11b+ myeloid cells (L) from the BM and spleen of Ctrl and IDH1-KI mice. Right, quantitation of percentages of live, apoptotic (7-AAD–Annexin V+), and necrotic (7-AAD+Annexin V+) cells in the left panels. Data are the mean ± SEM (n = 4). *P < .05; **P < .01; ***P < .001. RBC, red blood cells; HB, hemoglobin; HCT, hematocrit; MCV, mean corpuscular volume; n.s., not significant; PLT, platelet; WBC, white blood cells.
Consistent with a previous report,6 severe splenomegaly was observed in IDH1-KI mice, with histologic analysis showing that IDH1 mutation expanded the splenic red pulp but left unaffected the lymphoid follicles in splenic white pulp (Figure 1E). Hematoxylin and eosin staining combined with Ter-119 immunohistochemical staining revealed that IDH1 mutation significantly increased the number of erythroblasts with a hyperchromatic nucleus in the expanded splenic red pulp (Figure 1F), a finding confirmed by flow cytometry (Figure 1G). Serum levels of erythropoietin were also elevated in IDH1-mutant mice (Figure 1H). Therefore, IDH1 mutation impairs erythropoiesis in the BM and induces extramedullary erythropoiesis in the spleen. Flow cytometric analysis also showed that IDH1 mutation did not alter the proportions of CD3+ T lymphocytes or CD220+ B lymphocytes in either the spleen or BM (supplemental Figure 1A-B). However, consistent with our complete blood count data, IDH1 mutation reduced the number of CD41+ megakaryocytes in both BM and spleen (supplemental Figure 1C-D). Thus, only megakaryocyte-erythrocyte progenitors seem to be affected by IDH1 mutation.
To further investigate the effect of mutant IDH1 on erythropoiesis, we performed hematoxylin and eosin and Perls’ Prussian Blue staining of BM and spleen of IDH1-KI mice and detected increased brown-yellow pigment and iron deposits in both tissues but no obvious ring sideroblast formation (Figure 1I-J; supplemental Figure 2A). These data implied that IDH1 mutation increased erythroid cell death and hemosiderin accumulation. Flow cytometric analysis confirmed that IDH1 mutation promoted the death of Ter-119+ erythroblasts in BM and spleen, which contained 7-AAD-AnnexinV+ apoptotic and 7-AAD+AnnexinV+ necrotic populations (Figure 1K). In contrast, the survival of CD11b+ myeloid cells was not affected (Figure 1L). In aged (but not young) IDH1-KI mice, BM cellularity was moderately reduced (supplemental Figure 2B-C) without obvious fibrosis (supplemental Figure 2D).
In summary, IDH1-KI mice suffer from obvious anemia and splenomegaly with extramedullary erythropoiesis. Erythroid cell death is increased and numbers of megakaryocytes and platelets are decreased compared with control mice. These phenotypes are strikingly similar to those associated with human MDS.6 Because erythrocytes and platelets are derived from the same hematopoietic progenitor, these results suggest that IDH1 mutation particularly affects the megakaryocyte-erythroid lineage.
IDH1 mutation impairs erythroid cell commitment and differentiation in mice
To ascertain the specific erythroid cell populations affected by mutant IDH1, we first conducted detailed flow cytometric analyses of differentiating HSC. Consistent with previous reports,6,7 we found increased immature lineage-sca-1+c-kit+ cells (LSK) and lineage-restricted progenitors (CD48+CD150– LSK; LRP) deposited in the BM and spleen of IDH1-KI mice, along with a significant reduction in long-term HSC (CD48–CD150+ lineage–sca-1+c-kit+; LT-HSC) in the BM (supplemental Figure 3A-B). These data suggested that IDH1 mutation impairs HSC maintenance. However, exactly how this deficit might lead to the anemia and erythropoiesis defects in IDH1-KI mice remained unclear. We therefore investigated specifically how IDH1 mutation alters the erythroid pathway. We observed that the percentage of CD16/32lowCD34low MEP was decreased in the LK (lineage–Sca-I–c-kit+) population in the BM and spleen of IDH1-KI mice but that the percentage of CD16/32highCD34high granulocyte-monocyte progenitors was increased (Figure 2A). When we cultured nucleated cells from mutant BM and spleen in colony-forming unit–erythroid or (burst-forming unit-erythroid (BFU-E) conditioning medium for 2 or 14 days, respectively, we found that BFU-E and colony-forming unit-erythroid colonies were consistently reduced both in the BM and spleen of IDH1-KI mice (Figure 2B). Consistent with the increase in LSK and LRP cells, the percentages of c-kit+Sca-I– and c-kit+Sca-I+ immature cells were elevated among BFU-E cells derived from BM and spleen of IDH1-KI mice (supplemental Figure 4). These results indicate that IDH1 mutation reduces the generation of erythroid-committed progenitors.
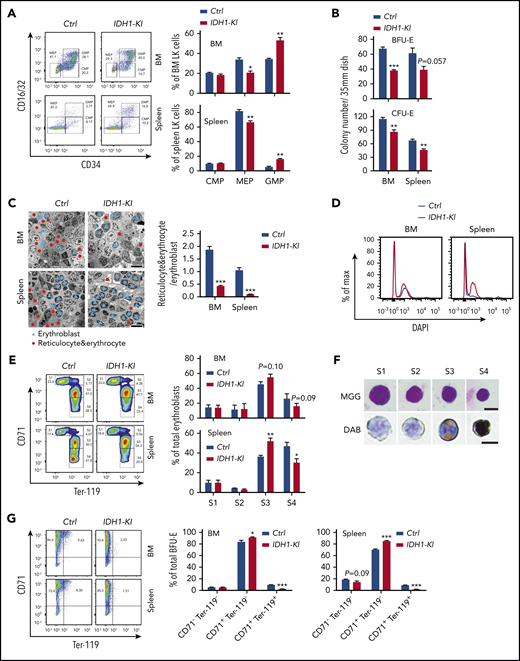
Mutant IDH1 impedes erythropoiesis in mice. (A) Left, flow cytometric determination of the proportions of CMP (CD16/32–CD34+), MEP (CD16/32–CD34–), and granulocyte-monocyte progenitors (GMP) (CD16/32+CD34+) among BM or spleen LK cells from control and IDH1-KI mice. Right, quantitation of the results in the left panel. Data are the mean ± SEM (n = 5). (B) Quantitation of numbers of colonies arising in cultures of nucleated BM or spleen cells that were isolated from control or IDH1-KI mice and cultured in BFU-E medium for 14 days or colony-forming unit-erythroid (CFU-E) medium for 2 days. Data are the mean ± SEM (n = 3). (C) Left, representative transmission electron micrographs of BM and spleen sections from control and IDH1-KI mice. Blue triangles, erythroblasts; red dots, reticulocytes and erythrocytes. Scale bars, 20 μm. Right, quantitation of the ratio of reticulocytes plus erythrocytes to erythroblasts in the left panels. Data are the mean ± SEM (n = 3). (D) Representative flow cytometric analysis of 4′,6-diamidino-2-phenylindole (DAPI) staining of Ter-119+ erythroid cells in BM and spleen of control and IDH1-KI mice (n = 3). (E) Left, flow cytometric analysis of erythroblasts in BM and spleen of control and IDH1-KI mice. Erythroblasts were divided into 4 subpopulations by surface staining for CD71 and Ter-119: Ter-119medCD71high proerythroblasts (S1), Ter-119highCD71high basophilic erythroblasts (S2), Ter-119highCD71med late basophilic and polychromatophilic erythroblasts (S3), and Ter-119highCD71low orthochromatophilic erythroblasts (S4). Right, quantitation of percentages of the S1 to S4 populations in the left panel. Data are the mean ± SEM (n = 5). (F) Representative images of erythroblasts at S1 to S4 stages (from panel E) stained with May-Grünwald-Giemsa (MGG; top) or 3,3′-diaminobenzidine (DAB)/hematoxylin (bottom) (n = 5). Scale bars, 10 μm. (G) Left, flow cytometric analysis of nucleated BM or spleen cells that were isolated from control and IDH1-KI mice, cultured in BFU-E medium for 14 days, and surface-stained to detect CD71 and Ter-119. Right, quantitation of proportions of the CD71–Ter-119–, CD71+Ter-119–, and CD71+Ter-119+ populations in the left panel. Data are the mean ± SEM of the collective results of 3 independent experiments. *P < .05; **P < .01; ***P < .001.
Mutant IDH1 impedes erythropoiesis in mice. (A) Left, flow cytometric determination of the proportions of CMP (CD16/32–CD34+), MEP (CD16/32–CD34–), and granulocyte-monocyte progenitors (GMP) (CD16/32+CD34+) among BM or spleen LK cells from control and IDH1-KI mice. Right, quantitation of the results in the left panel. Data are the mean ± SEM (n = 5). (B) Quantitation of numbers of colonies arising in cultures of nucleated BM or spleen cells that were isolated from control or IDH1-KI mice and cultured in BFU-E medium for 14 days or colony-forming unit-erythroid (CFU-E) medium for 2 days. Data are the mean ± SEM (n = 3). (C) Left, representative transmission electron micrographs of BM and spleen sections from control and IDH1-KI mice. Blue triangles, erythroblasts; red dots, reticulocytes and erythrocytes. Scale bars, 20 μm. Right, quantitation of the ratio of reticulocytes plus erythrocytes to erythroblasts in the left panels. Data are the mean ± SEM (n = 3). (D) Representative flow cytometric analysis of 4′,6-diamidino-2-phenylindole (DAPI) staining of Ter-119+ erythroid cells in BM and spleen of control and IDH1-KI mice (n = 3). (E) Left, flow cytometric analysis of erythroblasts in BM and spleen of control and IDH1-KI mice. Erythroblasts were divided into 4 subpopulations by surface staining for CD71 and Ter-119: Ter-119medCD71high proerythroblasts (S1), Ter-119highCD71high basophilic erythroblasts (S2), Ter-119highCD71med late basophilic and polychromatophilic erythroblasts (S3), and Ter-119highCD71low orthochromatophilic erythroblasts (S4). Right, quantitation of percentages of the S1 to S4 populations in the left panel. Data are the mean ± SEM (n = 5). (F) Representative images of erythroblasts at S1 to S4 stages (from panel E) stained with May-Grünwald-Giemsa (MGG; top) or 3,3′-diaminobenzidine (DAB)/hematoxylin (bottom) (n = 5). Scale bars, 10 μm. (G) Left, flow cytometric analysis of nucleated BM or spleen cells that were isolated from control and IDH1-KI mice, cultured in BFU-E medium for 14 days, and surface-stained to detect CD71 and Ter-119. Right, quantitation of proportions of the CD71–Ter-119–, CD71+Ter-119–, and CD71+Ter-119+ populations in the left panel. Data are the mean ± SEM of the collective results of 3 independent experiments. *P < .05; **P < .01; ***P < .001.
Transmission electron microscopy was next used to examine erythroid cells in tissues of IDH1-KI mice. Immature nucleated erythroblasts were significantly increased in mutant BM and splenic red pulp, whereas mature anucleated erythrocytes and reticulocytes were correspondingly decreased (Figure 2C). 4′,6-Diamidino-2-phenylindole staining and flow cytometry of Ter-119+ erythroid cells revealed that the BM and spleen of IDH1-KI mice contained more erythroblasts than tissues of control mice (Figure 2D). We then sorted erythroblasts into 4 subpopulations according to their surface marker levels of Ter-119 and CD71.29 We found that percentages of early-stage erythroblasts were comparable in BM and spleen of control and IDH1-KI mice, including the S1 (proerythroblasts, Ter-119medCD71high) and S2 (basophilic erythroblasts, Ter-119highCD71high) stages (Figure 2E-F). However, the percentage of stage S3 cells (late basophilic and polychromatophilic erythroblasts, Ter-119highCD71med) was elevated in IDH1-KI mice, whereas the percentage of stage S4 cells (orthochromatophilic erythroblasts, Ter-119highCD71low) was significantly reduced. These data suggest that IDH1 mutation preferentially blocks the late stages of erythroid cell differentiation when heme synthesis ramps up. Lastly, when we examined cultured BFU-E cells derived from BM and spleen of IDH1-KI mice, in both cases, the relatively mature CD71+Ter-119+ erythroid cells were significantly decreased while immature CD71+Ter-119- cells were increased (Figure 2G). These results confirm that IDH1 mutation blocks erythroid differentiation at its later stages.
It should be noted that IDH1 mutation did not change the number of CD11b+ myeloid cells in BM but did increase the number of myeloperoxidase+ granulocytes (Figure 1D; supplemental Figure 5A). In addition, more granules accumulated in BM granulocytes of IDH1-KI mice. The percentage of mature granulocytes (Gr-1high CD11bhigh) was elevated in BM of IDH1-KI mice, whereas the percentage of immature granulocytes (Gr-1high CD11bint) was reduced (supplemental Figure 5B-C). To examine the effect of IDH1 mutation on erythrocyte and granulocyte differentiation in vitro, we overexpressed mutant IDH1(R132H) or WT IDH1 (control) in K562 erythroleukemia cells (supplemental Figure 5D), which can be induced to differentiate into almost any type of myeloid cell.30 In cultures of K562 cells that overexpressed mutant IDH1 (IDH1-mutant K562 cells) and were induced to undergo myeloid differentiation, numbers of myeloid cells and peroxidase granules were increased compared with controls (supplemental Figure 5E). These data suggest that mutation of IDH1 favors the maturation of granulocytic lineage cells while impeding that of erythroid cells.
IDH1 mutation causes heme and hemoglobin deficiencies in erythroblasts
The synthesis of heme and assembly of hemoglobin are major events in late erythroblasts and critical for erythropoiesis.31,32 We performed immunoblotting assays showing that IDH1 mutation significantly reduced hemoglobin levels in BM and splenic Ter-119+ erythroblasts (Figure 3A) as well as in BM lineage+ nucleated cells (supplemental Figure 6A). 3,3′-Diaminobenzidine staining revealed that heme levels were decreased in BM and spleen of IDH1-KI mice (Figure 3B). Consistent with this finding, fluorescence spectrophotometric assays showed that heme content was decreased in lineage+ and Ter-119+ nucleated cells from mutant BM (Figure 3C) as well as in Ter-119+ erythroblasts from mutant spleen (Figure 3D). However, the expressions of heme and hemoglobin in Ter-119- BM and spleen cells were not affected by IDH1 mutation. Thus, IDH1 mutation is associated with hemoglobin and heme deficiencies in erythroblasts that lead to the anemia observed in IDH-KI mice.
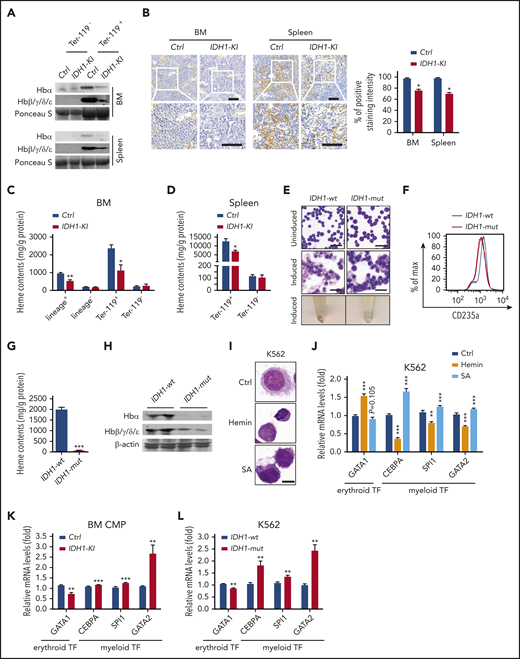
IDH1 mutation causes heme deficiency in erythroid cells. (A) Immunoblot to detect the indicated hemoglobin proteins in Ter-119+ and Ter-119– nucleated cells from BM and spleen of control and IDH1-KI mice (n = 3). Ponceau S, loading control. (B) Left, low (top) and high (insets; bottom) magnification views of 3,3′-diaminobenzidine/hematoxylin-stained sections of BM and spleen from control and IDH1-KI mice. Scale bars, 50 μm. Right, quantitation of 3,3′-diaminobenzidine staining intensities in the left panels. Data are the mean ± SEM (n = 4). (C-D) Quantitation of heme content as determined by fluorescence spectroscopy in lineage+, lineage–, Ter-119+, and Ter-119– nucleated BM cells (C) and in Ter-119+ and Ter-119– nucleated spleen cells (D) from control and IDH1-KI mice. Data are the mean ± SEM (n = 4). (E) Top and middle, representatitve May-Grünwald-Giemsa staining of K562 cells expressing WT or mutant IDH1 that were left uninduced (top) or induced with hydroxyurea plus sodium butyrate (middle). Bottom, cell pellets of the cells in the middle panel. Scale bars, 50 μm. (F) Representative flow cytometric analysis of CD235a expression by the induced K562 cells in panel E (n = 5). (G) Quantitation of heme content in the induced cells in panel E determined as in panel C (n = 5). (H) Immunoblot to detect the indicated hemoglobin proteins in the induced K562 cells in panel E (n = 3). β-actin, loading control. (I) Microscopic view of nontransfected K562 cells that were treated with either hemin or SA (heme synthesis inhibitor) and stained by using the WG-KI biochemistry method to detect peroxidase particles (n = 5). Scale bars, 10 μm. (J) Relative mRNA levels of GATA1, CEBPA, SPI1, and GATA2 in the K562 cells in panel I. Data are the mean ± SEM (n = 4). β-actin, endogenous control. (K) Relative mRNA levels of GATA1, CEBPA, SPI1, and GATA2 in BM CMPs from control and IDH1-KI mice. Data are the mean ± SEM (n = 4). β-actin, endogenous control. (L) Relative mRNA levels of GATA1, CEBPA, SPI1, and GATA2 in K562 cells overexpressing WT or mutant IDH1.Data are the mean ± SEM (n = 4). *P < .05; **P < .01; ***P < .001. β-actin, endogenous control. TF, transcription factor.
IDH1 mutation causes heme deficiency in erythroid cells. (A) Immunoblot to detect the indicated hemoglobin proteins in Ter-119+ and Ter-119– nucleated cells from BM and spleen of control and IDH1-KI mice (n = 3). Ponceau S, loading control. (B) Left, low (top) and high (insets; bottom) magnification views of 3,3′-diaminobenzidine/hematoxylin-stained sections of BM and spleen from control and IDH1-KI mice. Scale bars, 50 μm. Right, quantitation of 3,3′-diaminobenzidine staining intensities in the left panels. Data are the mean ± SEM (n = 4). (C-D) Quantitation of heme content as determined by fluorescence spectroscopy in lineage+, lineage–, Ter-119+, and Ter-119– nucleated BM cells (C) and in Ter-119+ and Ter-119– nucleated spleen cells (D) from control and IDH1-KI mice. Data are the mean ± SEM (n = 4). (E) Top and middle, representatitve May-Grünwald-Giemsa staining of K562 cells expressing WT or mutant IDH1 that were left uninduced (top) or induced with hydroxyurea plus sodium butyrate (middle). Bottom, cell pellets of the cells in the middle panel. Scale bars, 50 μm. (F) Representative flow cytometric analysis of CD235a expression by the induced K562 cells in panel E (n = 5). (G) Quantitation of heme content in the induced cells in panel E determined as in panel C (n = 5). (H) Immunoblot to detect the indicated hemoglobin proteins in the induced K562 cells in panel E (n = 3). β-actin, loading control. (I) Microscopic view of nontransfected K562 cells that were treated with either hemin or SA (heme synthesis inhibitor) and stained by using the WG-KI biochemistry method to detect peroxidase particles (n = 5). Scale bars, 10 μm. (J) Relative mRNA levels of GATA1, CEBPA, SPI1, and GATA2 in the K562 cells in panel I. Data are the mean ± SEM (n = 4). β-actin, endogenous control. (K) Relative mRNA levels of GATA1, CEBPA, SPI1, and GATA2 in BM CMPs from control and IDH1-KI mice. Data are the mean ± SEM (n = 4). β-actin, endogenous control. (L) Relative mRNA levels of GATA1, CEBPA, SPI1, and GATA2 in K562 cells overexpressing WT or mutant IDH1.Data are the mean ± SEM (n = 4). *P < .05; **P < .01; ***P < .001. β-actin, endogenous control. TF, transcription factor.
We next performed May-Grünwald Giemsa staining of IDH1-mutant K562 cells and controls that showed that mutant IDH1 expression at steady state did not alter the morphology of these cells (Figure 3E). As expected, control K562 cells induced to undergo erythroid differentiation by the addition of hydroxyurea plus sodium butyrate exhibited smaller (or even absent) nuclei and enlarged cytoplasm. When pelleted, these cells took on the expected reddish color. However, IDH1-mutant K562 cells showed significantly impaired erythroid differentiation, and flow cytometric analysis confirmed reduced levels of the erythroid marker CD235a in these cells (Figure 3F). Importantly, mutant IDH1 expression significantly decreased both intracellular heme content (Figure 3G) and hemoglobin proteins (Figure 3H) in erythroid-differentiated K562 cells.
To specifically determine the role of heme in erythroid differentiation, nontransfected K562 cells were treated with hemin, an inducer of heme synthesis, or succinylacetone (SA), a competitive inhibitor of heme synthesis. Peroxidase staining showed that exogenous hemin reduced the size of K562 cells and induced condensation of the cytoplasm and nucleus, suggesting that heme itself could induce the erythroid differentiation of K562 cells (Figure 3I). Conversely, SA treatment induced a striking accumulation of peroxidase granules in K562 cells, indicating that the inhibition of heme synthesis promotes granulocytic differentiation. At the messenger RNA (mRNA) level, hemin treatment led to upregulation of the erythroid transcription factor GATA-binding factor 1 (GATA1) but downregulated the expression of the myeloid transcription factors CCAAT/enhancer-binding protein α (CEBPA), Spi-1 proto-oncogene (SPI1), and GATA-binding factor 2 (GATA2) (Figure 3J). As expected, SA treatment induced the opposite effects on these transcription factors. We next examined the levels of these mRNAs in BM CMP from IDH1-KI mice as well as in IDH1-mutant K562 cells. In both cases, mutant IDH1 decreased GATA1 mRNA but increased mRNA levels of CEBPA, SPI1, and GATA2 (Figure 3K-L). These data indicate that the heme deficiency caused by IDH1 mutation contributes to the impaired erythroid lineage commitment and differentiation seen in IDH1-KI–mutant mice.
IDH1 mutation decreases heme synthesis and succinyl-CoA production in erythroblasts
To investigate heme biosynthesis itself in IDH1-KI mice, we examined protein and mRNA levels of the relevant enzymes and intermediates. For example, 5′-aminolevulinate synthase 1 and 2 (ALAS1 and ALAS2) are rate-limiting enzymes for heme biosynthesis that are erythrocyte-specific and nonspecific, respectively.33 We found that ALAS1 and ALAS2 were both upregulated in Ter-119+ and lineage+ nucleated cells from BM and spleen of IDH1-KI mice, but that the downstream enzymes hydroxymethylbilane synthase and ferrochelatase were unaffected (Figure 4A-B; supplemental Figure 6A). A similar result was detected in BM lineage– cells using quantitative PCR (supplemental Figure 6B). Moreover, high-performance liquid chromatography/liquid chromatography with mass spectrometry (HPLC/LC-MS) analysis showed that 5-ALA, the first key intermediate in heme synthesis, and succinyl-CoA, a substrate for heme synthesis, were consistently reduced in Ter-119+ erythroblasts from BM and spleen of IDH1-KI mice (Figure 4C).
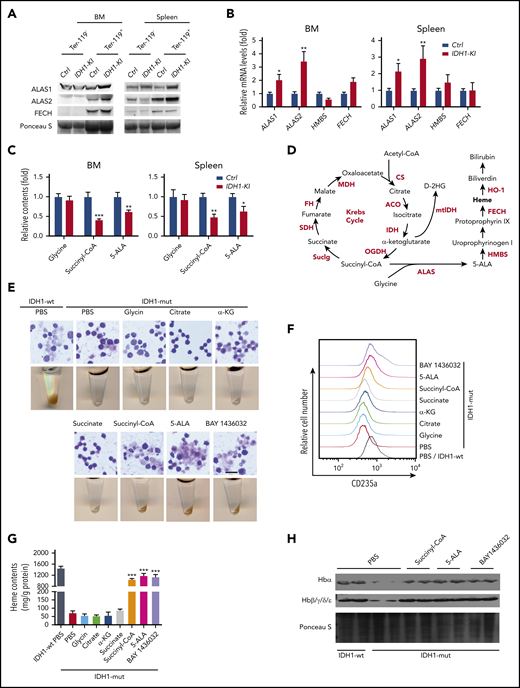
Mutant IDH1 impedes heme synthesis by reducing succinyl-CoA production. (A) Immunoblot to detect ALAS1, ALAS2, and ferrochelatase (FECH) in Ter-119+ and Ter-119– nucleated cells from BM and spleen of control and IDH1-KI mice (n = 3). (B) Relative mRNA levels of ALAS1, ALAS2, HMBS, and FECH in Ter-119+ nucleated cells from BM and spleen of control and IDH1-KI mice. Data are the mean ± SEM (n = 4). β-actin, endogenous control. (C) Relative levels of glycine, succinyl-CoA, and 5-ALA in Ter-119+ nucleated cells from BM and spleen of control and IDH1-mutant mice as determined by HPLC/LC-MS. Data are the mean ± SEM (n = 6). (D) Diagram outlining the Krebs cycle and its intersection with heme metabolism. (E) Top, microscopic views of representative May-Grünwald-Giemsa–stained mutant IDH1-expressing K562 cells that were treated with glycine, citrate, α-KG, succinate, succinyl-CoA, 5-ALA, or BAY1436032 (mutant IDH1 inhibitor). Scale bar, 50 μm. Bottom, corresponding cell pellets for the cultures in the top panels. (F) Flow cytometric determination of expression of the erythroid marker CD235a by mutant IDH1-expressing K562 cells that were treated with glycine, citrate, α-KG, succinate, succinyl-CoA, 5-ALA, or BAY1436032. Results are representative of 3 trials. (G) Quantitation of heme content in the cells in panel F. Data are the mean ± SEM (n = 5). (H) Immunoblot to detect hemoglobin proteins in mutant IDH1-expressing K562 cells that were treated with succinyl-CoA, 5-ALA, or BAY1436032 (n = 3). *P < .05; **P < .01; ***P < .001. ACO, aconitase; CS, citrate synthase; FH, fumarate hydratase; HMBS, hydroxymethylbilane synthase; MDH, malate dehydrogenase; PBS, phosphate-buffered saline; SDH, succinate dehydrogenase.
Mutant IDH1 impedes heme synthesis by reducing succinyl-CoA production. (A) Immunoblot to detect ALAS1, ALAS2, and ferrochelatase (FECH) in Ter-119+ and Ter-119– nucleated cells from BM and spleen of control and IDH1-KI mice (n = 3). (B) Relative mRNA levels of ALAS1, ALAS2, HMBS, and FECH in Ter-119+ nucleated cells from BM and spleen of control and IDH1-KI mice. Data are the mean ± SEM (n = 4). β-actin, endogenous control. (C) Relative levels of glycine, succinyl-CoA, and 5-ALA in Ter-119+ nucleated cells from BM and spleen of control and IDH1-mutant mice as determined by HPLC/LC-MS. Data are the mean ± SEM (n = 6). (D) Diagram outlining the Krebs cycle and its intersection with heme metabolism. (E) Top, microscopic views of representative May-Grünwald-Giemsa–stained mutant IDH1-expressing K562 cells that were treated with glycine, citrate, α-KG, succinate, succinyl-CoA, 5-ALA, or BAY1436032 (mutant IDH1 inhibitor). Scale bar, 50 μm. Bottom, corresponding cell pellets for the cultures in the top panels. (F) Flow cytometric determination of expression of the erythroid marker CD235a by mutant IDH1-expressing K562 cells that were treated with glycine, citrate, α-KG, succinate, succinyl-CoA, 5-ALA, or BAY1436032. Results are representative of 3 trials. (G) Quantitation of heme content in the cells in panel F. Data are the mean ± SEM (n = 5). (H) Immunoblot to detect hemoglobin proteins in mutant IDH1-expressing K562 cells that were treated with succinyl-CoA, 5-ALA, or BAY1436032 (n = 3). *P < .05; **P < .01; ***P < .001. ACO, aconitase; CS, citrate synthase; FH, fumarate hydratase; HMBS, hydroxymethylbilane synthase; MDH, malate dehydrogenase; PBS, phosphate-buffered saline; SDH, succinate dehydrogenase.
To identify the crucial heme biosynthesis metabolite compromised by IDH1 mutation, we examined the metabolic interactions between heme biosynthesis and the Krebs cycle. As illustrated in Figure 4D, the succinyl-CoA used for heme biosynthesis is derived mainly from the Krebs cycle. We selectively introduced Krebs cycle and heme synthesis–related intermediates into IDH1-mutant K562 cells and determined which were able to rescue erythropoiesis. The presence of either BAY 1436032, an inhibitor of mutant IDH1, or succinyl-CoA or 5-ALA was able to accelerate the erythroid differentiation of IDH1-mutant K562 cells (Figure 4E; supplemental Figure 7), as confirmed by an increase in CD235a expression (Figure 4F). Succinyl-CoA, 5-ALA, and BAY 1436032 also increased heme content (Figure 4G) and upregulated hemoglobin (Figure 4H) in IDH1-mutant K562 cells. To rule out the possibility that the observed decrease in heme metabolites was not just secondary to reduced activity of WT IDH1, we examined erythropoiesis in IDH1 knockout mice but found no abnormalities (supplemental Figure 8). Thus, a reduction in succinyl-CoA production seems to be the primary cause of the defective heme synthesis in IDH1-mutated cells.
D-2HG generated by mutant IDH blocks succinyl-CoA production
Within the Krebs cycle, succinyl-CoA can be derived either from α-KG via OGDH, or from succinate via succinyl-CoA ligase (Suclg). HPLC/LC-MS analyses of these metabolites were conducted in Ter-119+ erythroblasts from BM and spleen of control and IDH1-mutant mice. We observed that IDH1 mutation significantly decreased succinyl-CoA in these cells while slightly reducing succinate levels but that α-KG levels were unaffected (Figure 5A). Consistent with these results, the mRNA and protein levels of Suclg1 and succinate dehydrogenase complex subunit B were moderately decreased in mutant erythroblasts (Figure 5B-C), potentially contributing to the observed reduction in succinyl-CoA. However, exogenous succinate fails to rescue the erythropoiesis in IDH1-mutant K562 cells as shown in Figure 4E. Previous research has established that, for the large amounts of heme synthesized during late erythropoiesis, the succinyl-CoA is mainly derived from α-KG via OGDH and not from succinate via Suclg.27 Therefore, the enzyme OGDH was further investigated. The mRNA and protein levels of OGDH were unaffected by IDH1 mutation, which indicates that the decreased succinyl-CoA in IDH1-mutant cells was not due to a defect in OGDH expression.
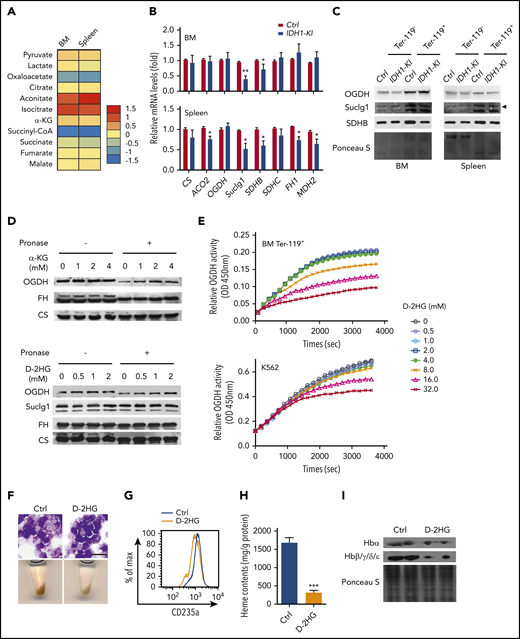
D-2HG directly inhibits the enzyme activity of OGDH. (A) Heat map displaying relative quantitation of Krebs cycle intermediates in Ter-119+ erythroblasts from BM and spleen of control and IDH1-KI mice as determined by LC-MS/MS. As indicated, the colors represent the relative abundance (fold change) of these metabolites in IDH1-KI vs control mice (n = 6). (B) Relative mRNA levels of the indicated Krebs cycle enzymes in Ter-119+ erythroblasts from BM and spleen of control and IDH1-KI mice. Data are the mean ± SEM (n = 6). β-actin, endogenous control. (C) Immunoblot to detect OGDH, Suclg1, and succinate dehydrogenase complex subunit B (SDHB) protein in Ter-119+ and Ter-119– nucleated cells from BM and spleen of control and IDH1-KI mice. Data are representative of 3 trials. (D) Drug affinity responsive target stability assays (see Materials and methods) to detect the interactions of OGDH protein with α-KG (top) or D-2HG (bottom) and Suclg1 protein with D-2HG (bottom) in nontransfected K562 cells. FH and CS proteins were used as negative control. Data are representative of 3 trials. (E) Time course of enzymatic activity of OGDH (as determined by using a colorimetric assay kit) in mouse BM Ter-119+ erythroblasts (top) or nontransfected K562 cells (bottom) that were treated with the indicated concentrations of D-2HG. Data are representative of 3 trials. (F) Top, microscopic views of representative May-Grünwald-Giemsa–stained K562 cells treated with or without cell permeable octyl-D-2HG. Scale bar, 20 μm. Bottom, corresponding cell pellets for the cultures in the top panels. (G) Flow cytometric determination of the erythroid marker CD235a expression in K562 cells treated with or without octyl-D-2HG. Data are representative of triplicate assays. (H) Quantitation of heme content in the cells in panel G. (I) Immunoblot to detect hemoglobin proteins in the cells in panel G. Data are the mean ± SEM. *P < .05; **P < .01; ***P < .001.
D-2HG directly inhibits the enzyme activity of OGDH. (A) Heat map displaying relative quantitation of Krebs cycle intermediates in Ter-119+ erythroblasts from BM and spleen of control and IDH1-KI mice as determined by LC-MS/MS. As indicated, the colors represent the relative abundance (fold change) of these metabolites in IDH1-KI vs control mice (n = 6). (B) Relative mRNA levels of the indicated Krebs cycle enzymes in Ter-119+ erythroblasts from BM and spleen of control and IDH1-KI mice. Data are the mean ± SEM (n = 6). β-actin, endogenous control. (C) Immunoblot to detect OGDH, Suclg1, and succinate dehydrogenase complex subunit B (SDHB) protein in Ter-119+ and Ter-119– nucleated cells from BM and spleen of control and IDH1-KI mice. Data are representative of 3 trials. (D) Drug affinity responsive target stability assays (see Materials and methods) to detect the interactions of OGDH protein with α-KG (top) or D-2HG (bottom) and Suclg1 protein with D-2HG (bottom) in nontransfected K562 cells. FH and CS proteins were used as negative control. Data are representative of 3 trials. (E) Time course of enzymatic activity of OGDH (as determined by using a colorimetric assay kit) in mouse BM Ter-119+ erythroblasts (top) or nontransfected K562 cells (bottom) that were treated with the indicated concentrations of D-2HG. Data are representative of 3 trials. (F) Top, microscopic views of representative May-Grünwald-Giemsa–stained K562 cells treated with or without cell permeable octyl-D-2HG. Scale bar, 20 μm. Bottom, corresponding cell pellets for the cultures in the top panels. (G) Flow cytometric determination of the erythroid marker CD235a expression in K562 cells treated with or without octyl-D-2HG. Data are representative of triplicate assays. (H) Quantitation of heme content in the cells in panel G. (I) Immunoblot to detect hemoglobin proteins in the cells in panel G. Data are the mean ± SEM. *P < .05; **P < .01; ***P < .001.
The oncometabolite D-2HG produced by mutant IDH is structurally similar to α-KG and competitively inhibits α-KG–dependent enzymes.5 Drug affinity responsive target stability assays were used to show that, as with α-KG, D-2HG can interact with the OGDH protein under physiological conditions (Figure 5D) but not with the Suclg1 proteins. Moreover, this direct binding of D-2HG to OGDH inhibited the latter’s enzymatic activity in mouse Ter-119+ erythroblasts and cultured K562 cells (Figure 5E). Finally, exogenous octyl-D-2HG impeded erythroid differentiation and decreased heme content and hemoglobin expression in K562 cells (Figure 5F-I). These data indicate that the reduced succinyl-CoA production in IDH1-mutated erythroid cells is due to an attenuation of OGDH activity caused by the high levels of D-2HG generated by the mutated IDH1 enzyme.
Heme deficiency caused by IDH1 mutation promotes the reactive oxygen species–induced death of erythroblasts
As described earlier, we found that IDH1 mutation significantly increased erythroid cell apoptosis (Figure 1J). Subsequent investigation showed that this cell death of IDH1 mutant erythroblasts was observed mainly during the late stages (S3 and S4) of erythropoiesis, the period when heme synthesis surges (supplemental Figure 9A-B). Furthermore, CMH2DCFDA staining to detect reactive oxygen species (ROS) showed that ROS levels were higher in erythroblasts from BM and spleen of IDH1-KI mice than in control cells (Figure 6A). However, HPLC/LC-MS analysis showed that IDH1 mutation did not affect the levels of NADH, NAD+, reduced NADP, or NADP+ in Ter-119+ erythroblasts (Figure 6B).
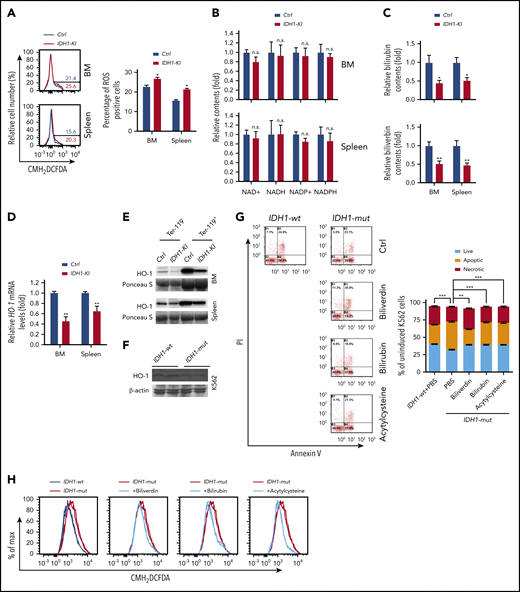
Reduced heme catabolism contributes to increased ROS and death in IDH1-mutant erythroid cells. (A) Left, representative flow cytometric analysis of ROS levels (as determined by CMH2DCFDA staining) in Ter-119+ erythroblasts from BM and spleen of control and IDH1-KI mice. Right, quantitation of the percentages of ROS positive BM and spleen Ter-119+ erythroblasts in the left panels. Data are the mean ± SEM (n = 3). (B) HPLC/LC-MS determination of relative levels of reduced NADP (NADPH), NADP+, NADH, and NAD+ in erythroblasts from BM and spleen of control and IDH1-KI mice. Data are the mean ± SEM (n = 6). (C) HPLC/LC-MS determination of relative levels of bilirubin and biliverdin in Ter-119+ erythroblasts from BM and spleen of control and IDH1-KI mice. Data are the mean ± SEM (n = 6). (D) Relative HO-1 mRNA levels in Ter-119+ erythroblasts from BM and spleen of control and IDH1-KI mice. Data are the mean ± SEM (n = 6). β-actin, endogenous control. (E) Immunoblot to detect HO-1 protein in Ter-119+ and Ter-119– nucleated cells from BM and spleen of control and IDH1-KI mice. Data are representative of 3 trials. (F) Immunoblot to detect the indicated HO-1 protein in cultures of K562 cells that expressed WT or mutant IDH1 (n = 3). β-actin, loading control. (G) Left, propidium iodide (PI) and FITC-Annexin V staining to detect cell death in K562 cells in panel F treated with or without bilirubin, biliverdin, or acetylcysteine, as indicated. Data are representative of 3 trials. Right, quantitation of the percentages of apoptotic and necrotic cells in the cultures in the top panel (n = 3). (H) CMH2DCFDA determination of ROS in the cells in panel G. Data are representative of 3 trials. *P < .05; **P < .01; ***P < .001.
Reduced heme catabolism contributes to increased ROS and death in IDH1-mutant erythroid cells. (A) Left, representative flow cytometric analysis of ROS levels (as determined by CMH2DCFDA staining) in Ter-119+ erythroblasts from BM and spleen of control and IDH1-KI mice. Right, quantitation of the percentages of ROS positive BM and spleen Ter-119+ erythroblasts in the left panels. Data are the mean ± SEM (n = 3). (B) HPLC/LC-MS determination of relative levels of reduced NADP (NADPH), NADP+, NADH, and NAD+ in erythroblasts from BM and spleen of control and IDH1-KI mice. Data are the mean ± SEM (n = 6). (C) HPLC/LC-MS determination of relative levels of bilirubin and biliverdin in Ter-119+ erythroblasts from BM and spleen of control and IDH1-KI mice. Data are the mean ± SEM (n = 6). (D) Relative HO-1 mRNA levels in Ter-119+ erythroblasts from BM and spleen of control and IDH1-KI mice. Data are the mean ± SEM (n = 6). β-actin, endogenous control. (E) Immunoblot to detect HO-1 protein in Ter-119+ and Ter-119– nucleated cells from BM and spleen of control and IDH1-KI mice. Data are representative of 3 trials. (F) Immunoblot to detect the indicated HO-1 protein in cultures of K562 cells that expressed WT or mutant IDH1 (n = 3). β-actin, loading control. (G) Left, propidium iodide (PI) and FITC-Annexin V staining to detect cell death in K562 cells in panel F treated with or without bilirubin, biliverdin, or acetylcysteine, as indicated. Data are representative of 3 trials. Right, quantitation of the percentages of apoptotic and necrotic cells in the cultures in the top panel (n = 3). (H) CMH2DCFDA determination of ROS in the cells in panel G. Data are representative of 3 trials. *P < .05; **P < .01; ***P < .001.
Heme is degraded by heme oxygenase (HO-1) to produce bilirubin and biliverdin; HO-1 and these heme catabolites are all reportedly antioxidant factors.34 We found that biliverdin and bilirubin levels were significantly decreased in Ter-119+ erythroblasts from BM and spleen of IDH1-KI mice (Figure 6C), as were mRNA and protein levels of HO-1 (Figure 6D-E). Similar results were found for BM lineage– cells and IDH1-mutant K562 cells (Figure 6F; supplemental Figure 6A-B). Among c-kit+ HSC and progenitor cells, decreased HO-1 protein, along with elevated ROS levels, were exclusively observed in BM LT-HSCs of IDH1-KI mice (supplemental Figure 10A-B). These findings may be due to the high sensitivity of LT-HSC to ROS and may partially explain the increased HSC exhaustion and LRP accumulation observed in the mutant mice. In vitro, ROS levels were increased in IDH1-mutant K562 cells, promoting cell death (Figure 6G-H). In contrast, the addition of exogenous biliverdin, bilirubin, or the ROS inhibitor acetylcysteine to IDH1-mutant K562 cells that had been induced to differentiate by treatment with hydroxyurea plus sodium butyrate abated ROS levels and reduced cell death. These results suggest that heme deficiency in IDH1-mutant erythroblasts increases their ROS levels and triggers cell death.
Discussion
In the context of the human hematologic system, IDH mutations are mainly present in myeloid disorders, including AML and MDS. Our results show that mice with a hematopoietic IDH1 mutation develop myeloid dysplasia, a preleukemic disease characterized by anemia, ineffective erythropoiesis, and increased immature progenitors and erythroblasts. MDS patients with IDH mutations transition to AML at a higher rate than patients without this alteration.35 In patients with AML, IDH1 mutation is believed to set the stage for cooccurring NPM1 or FLT3-ITD mutations.33 Therefore, it is the IDH1 mutation that is able to drive clonal hematopoiesis during the development of myeloid disorders. Interestingly, the differentiation of granulocyte-monocyte progenitors into myeloid progenitors is also required for leukemia stem cell formation and AML initiation.36 Indeed, we showed that IDH1 mutation in mice promotes granulocytic commitment and differentiation of CMP while impairing erythroid commitment and erythroblast maturation. Our data thus indicate that abnormal lineage reprogramming of HSC/progenitors driven by IDH1 mutation is a vital event in hematologic malignant transformation.
Anemia is the most common complication of MDS and AML and makes a major contribution to patient mortality and morbidity. Normal erythropoiesis is marked in its final stages by a dramatic increase in heme synthesis, which is essential for proper hemoglobinization of erythrocytes.26,37 In mammalian cells, heme biosynthesis begins with ALAS-catalyzed 5-ALA formation from glycine and succinyl-CoA.33 Although succinyl-CoA can also be synthesized from succinate by Suclg, the majority of succinyl-CoA is derived from α-KG by OGDH during the synthesis of large amounts of heme in late erythropoiesis.27 We found that IDH1 mutation had no effect on intracellular α-KG levels in mouse erythroblasts, even though the mutated IDH1 enzyme consumes α-KG derived from glucose and glutamine to produce D-2HG. Drug affinity responsive target stability assays showed that D-2HG can bind directly to the OGDH protein, inhibiting its enzymatic activity. Consistent with these metabolic alterations, succinyl-CoA, 5-ALA, and heme levels were dramatically decreased in IDH1-mutant erythroid cells. Notably, the addition of either succinyl-CoA or 5-ALA was able to rescue heme synthesis and erythropoiesis in these cells. Our results thus indicate that, in addition to driving D-2HG production, IDH1 mutation reduces succinyl-CoA production and heme biosynthesis, which further impairs erythropoiesis. However, the succinyl-CoA levels were reportedly increased in IDH1-mutant non-hematopoietic cells, because D-2HG was believed to inhibit the action of succinate dehydrogenase and block the flux from succinate to fumarate.38 Unlike nonhematopoietic cells, large amounts of succinyl-CoA is used to synthesize heme in erythroid cells, especially late erythroblasts, thus the fluxes from succinate to succinyl-CoA become an alternative metabolic pathway.39-42 This speculation is further confirmed by the elevated expressions of Suclg1, succinate dehydrogenase complex subunit B, ALALS and ferrochelatase in K562 cells (supplemental Figure 11) and in mouse erythroblasts (Figures 4A and 5C). Therefore, the succinate dehydrogenase deactivation or decreased Suclg1 expression does not lead to the increase of succinyl-CoA in IDH1-mutated erythroid cells.
Heme is an essential molecule for most living organisms.43 In addition to acting as a prosthetic group in hemoproteins, heme itself plays pivotal roles in mammalian erythropoiesis.44 Heme can bind directly to the cysteine-proline dipeptide (CP motif) present in numerous proteins and thereby performs a variety of regulatory functions. CP motif-containing proteins reportedly include heme activator protein 1 (Hap1), BTB and CNC homology 1 (BACH1) and BACH2, ALAS1, ALAS2, and heme oxygenase 2 (HO-2). In erythroid cells, heme deficiency reduces the transcriptional activity of BACH, leading to decreased expression of hemoglobin, HO-1, ferroportin, and ferritins C/EBPs, GATA1, and SPI-C.45,46
In our study, we showed that IDH1 mutation resulting in heme synthesis inhibition consistently downregulated GATA1, which triggers erythroid differentiation, but upregulated GATA2, SPI1, and C/EBPA, which drive myeloid differentiation. Therefore, heme deficiency caused by IDH1 mutation results in lineage reprogramming of HSC/progenitors and perturbation of the transcriptional program responsible for erythroid-myeloid differentiation. Accordingly, the anemia of IDH1-mutant mice can be attributed to impaired erythroid commitment and maturation due to defective heme biosynthesis caused by IDH1 mutation.
HO-1 and its products are important antioxidant, antiapoptotic, and cytoprotective factors.34 Heme deficiency reportedly inhibits HO-1 expression via transcriptional regulation.45 In our study, IDH1 mutation decreased HO-1 expression as well as the heme catabolites bilirubin and biliverdin. ROS and cell death were increased in IDH1-mutant erythroid cells, which could be partially mitigated by treatment with exogenous bilirubin and biliverdin. These results suggest that the anemia seen in IDH1-KI mice was aggravated by the excessive death of mutant erythroid cells.
The increased ROS associated with IDH1 mutation may also have affected HSCs. HSCs reside under low oxygen conditions in their BM niche and are highly sensitive to ROS. ROS elevation for any reason drives HSCs to differentiate into short-term repopulating cells and further on to myeloid cells.47,48 HO-1 deficiency also accelerates HSC mobilization and exhaustion, likely due to the excessive ROS generated in HO-1’s absence.49 Our data showed that ROS levels were elevated in IDH1-mutant mouse LT-HSCs due to reduced HO-1 expression, likely accounting for the observed decrease in HSC numbers and BM failure. Thus, in addition to lineage reprogramming, heme deficiency caused by IDH1 mutation contributes to erythroid cell death, HSC exhaustion, and BM failure, which are all important characteristics of human MDS.
Our work has clearly shown that IDH1 mutation impedes succinyl-CoA production and thereby impairs heme synthesis and metabolism, which disturbs erythroid cell commitment, differentiation and survival. This study has therefore shed light on the mechanisms of the anemia in IDH1-mutant myeloid malignancies, particularly MDS, and potentially points the way to new avenues of treatment of IDH-mutant tumors.
Requests for original data may be submitted to the corresponding authors (Jing Ye, e-mail: yejing@fmmu.edu.cn or Tak W. Mak, e-mail: tmak@uhnres.utoronto.ca).
The online version of this article contains a data supplement.
The publication costs of this article were defrayed in part by page charge payment. Therefore, and solely to indicate this fact, this article is hereby marked “advertisement” in accordance with 18 USC section 1734.
Acknowledgments
The authors are grateful to all members of the T.W.M. and J.Y. laboratories. The authors also appreciate the assistance of staff members of the Flow Cytometer Facility, Genotyping Facility, and Animal Resource Centre of the Princess Margaret Cancer Centre, and the Department of Pathology of Xijing Hospital.
This research was mainly supported by grants from the National Natural Science Foundation of China (81972342 and 81772659, J.Y.), the Natural Science Basic Research Plan in Shaanxi Province (2020JZ-29, J.Y.; 2018JM7042, Y.G.), and the State Key Laboratory of Cancer Biology of China (CBSKL2017Z20, Y.G.). This work was also supported by grants to T.W.M. from the Canadian Institutes of Health Research and the Leukemia and Lymphoma Society.
Authorship
Contribution: Y.G., R.Y., W.Y.L., Y. Yang, Y.Z., X.G., A.T., J.F., and L.Z. performed experiments; T.B., W.Z., A.W., Y. Yuan, J.L., Z.W., M.S., L.X., F.Z., and G.G. assisted with many experiments; Y.G. and J.Y. analyzed results and made the figures; T.W.M., and J.Y. designed the research; and G.Y., J.Y., and M.S. wrote the paper.
Conflict-of-interest disclosure: The authors declare no competing financial interests.
Correspondence: Jing Ye, Fourth Military Medical University, 169 Changle West Rd, Xi’an, 710032 China; e-mail: yejing@fmmu.edu.cn; or Tak W. Mak, Princess Margaret Cancer Centre, 610 University Ave, Toronto, ON, M5G 2C1 Canada; e-mail: tmak@uhnres.utoronto.ca.

This feature is available to Subscribers Only
Sign In or Create an Account Close Modal