

Key Points
iPSC-derived MKs and platelets share eQTLs and show enriched colocation with regulatory tracks important to MK biology.
These eQTLs are largely unique to MKs and platelets, with many not seen among 48 tissues in the Genotype-Tissue Expression project.

Abstract
Genome-wide association studies have identified common variants associated with platelet-related phenotypes, but because these variants are largely intronic or intergenic, their link to platelet biology is unclear. In 290 normal subjects from the GeneSTAR Research Study (110 African Americans [AAs] and 180 European Americans [EAs]), we generated whole-genome sequence data from whole blood and RNA sequence data from extracted nonribosomal RNA from 185 induced pluripotent stem cell-derived megakaryocyte (MK) cell lines (platelet precursor cells) and 290 blood platelet samples from these subjects. Using eigenMT software to select the peak single-nucleotide polymorphism (SNP) for each expressed gene, and meta-analyzing the results of AAs and EAs, we identify (q-value < 0.05) 946 cis-expression quantitative trait loci (eQTLs) in derived MKs and 1830 cis-eQTLs in blood platelets. Among the 57 eQTLs shared between the 2 tissues, the estimated directions of effect are very consistent (98.2% concordance). A high proportion of detected cis-eQTLs (74.9% in MKs and 84.3% in platelets) are unique to MKs and platelets compared with peak-associated SNP-expressed gene pairs of 48 other tissue types that are reported in version V7 of the Genotype-Tissue Expression Project. The locations of our identified eQTLs are significantly enriched for overlap with several annotation tracks highlighting genomic regions with specific functionality in MKs, including MK-specific DNAse hotspots, H3K27-acetylation marks, H3K4-methylation marks, enhancers, and superenhancers. These results offer insights into the regulatory signature of MKs and platelets, with significant overlap in genes expressed, eQTLs detected, and enrichment within known superenhancers relevant to platelet biology.
Introduction
The aggregation of activated platelets on atherosclerotic plaques is a critical pathophysiologic step in arterial thrombosis, leading to myocardial infarction, stroke, and peripheral arterial occlusion.1 Platelets normally circulate in the blood in a quiescent state but can be rapidly activated in response to a variety of stimuli.2-5 Once activated, the hemostatic process is guided by positive and negative feedback messages generated from within the platelet and surrounding cells. The propensity of platelets to aggregate and initiate thromboses is thought to be dependent on local vascular factors, systemic factors that can change over time, and genetic factors that contribute to intrinsic platelet aggregability.1,6 Prior efforts have shown that platelet aggregation is heritable7 in both African Americans (AAs) and European Americans (EAs), and there are several genetic loci that meet standard genome-wide association study (GWAS) criteria8 -11 for platelet aggregation to a variety of agonists in vitro. Platelet count and size (mean platelet volume) are also highly heritable quantitative traits with hundreds of loci identified by GWAS and exome approaches to date.12 However, the causal variant(s) from these loci have been difficult to resolve, and one of the key steps to bridging this gap would be a detailed overview of the regulatory landscape of platelets and their precursors, megakaryocytes (MKs), as determined by expression quantitative trait loci (eQTLs) incorporating DNA and RNA sequencing approaches.
Platelets are anucleate cells derived from MK precursors in bone marrow. Circulating blood platelets have a limited lifespan (7-10 days) and capacity for de novo protein translation, but no RNA transcription.13 Given that the messenger RNA in the platelet comes from its precursor, MKs are an important “target tissue” relevant to our genetic investigations of platelet aggregation loci because they are relevant to understanding the regulation of transcript and protein levels ultimately observed in platelets. Platelets are readily available in peripheral blood, and RNA-sequencing (RNA-seq) studies have recently identified >9000 genes expressed in platelets.14-16 Invasive bone marrow sampling has traditionally been required to obtain sufficient numbers of MKs for analysis. To explore the potential function of genetic variants in this context, we have produced induced pluripotent stem cells (iPSCs) from mononuclear cells in subjects from our parent platelet aggregation studies, and then successfully derived MKs from the iPSCs as previously described.17
In this work, we perform eQTL analyses of whole-genome sequence data on whole blood and RNA sequence data from platelets and iPSC-derived MKs in AAs and EAs from the Genetic Study of Atherosclerosis Risk (GeneSTAR) to define the genetic regulatory landscape of platelets and MKs. We explore the transcriptional and regulatory signal shared between these 2 tissues, and what seems to be unique to these tissues, relative to other publicly available eQTL data sets, specifically 48 tissue types from version V7 of the Genotype-Tissue Expression (GTEx) Project18 (https://gtexportal.org). We also explore gene-set enrichment and pathway analyses using the gene ontology (GO) as well as relevant pathways from the Molecular Signatures Database (MSigDB19 ), and look for enrichment of the eQTL signature to known regulatory tracks of importance in these tissues. All significant eQTL results are posted to an open-access Web site, where other investigators can use these results to assess functional relevance of their own genetic association hits. Our hope is that this resource will facilitate integration of functional data with GWAS studies in the future to identify causal/functional variants for known loci and identify additional genetic determinants with lower effect sizes.
Methods
Study participants
The GeneSTAR study population is constituted of apparently healthy siblings identified from probands with coronary artery disease before age 60, spouses of the siblings, and their adult offspring (>21 years of age), with a total n > 4000 participants.20-22 Samples underwent quality control as described in the supplemental Methods and Results, available on the Blood Web site to determine the final set for analysis, and clinical characteristics are shown by race and tissue type for each of the final included samples in supplemental Table 1 (MKs, n = 185: 84 AAs, 101 EAs; platelets, n = 290: 110 AAs, 180 EAs).
Generation of iPSC and derived MKs
The protocols used to generate the iPSCs and derive MKs are described in detail by Liu et al17 and in the supplemental Methods. There is variability in the percent CD41+CD42a+ MKs in MK pellets of our iPSCs (supplemental Table 1), which is accounted for in the transcriptomic analysis using percent CD41+CD42a+ MKs as a covariate in the model, as described in the following section.
Generation of WGS and RNA-seq data
To perform this eQTL analysis, we used whole-genome sequence (WGS) data from the GeneSTAR samples in Freeze 6a (August 2018, n = 1755) from the National Heart, Lung, and Blood Institute’s Trans Omics for Precision Medicine (TOPMed)23 program, retaining all autosomal single-nucleotide polymorphisms (SNPs) with at least 2 samples for each genotype and a call rate >80%. RNA-seq data were generated for iPSC-derived MKs and platelets using standard protocols and data processing pipelines (supplemental Methods). Genes with median fragments per kilobase per million reads mapped (FPKM) across all samples less than or equal to 1 (for MKs) or 0.3 (for platelets) were excluded (the lower cutoff for platelets is similar to prior studies [eg, Eicher et al15 and Londin et al24 ]). We used a variance stabilizing log transformation of the filtered FPKM measurements for all downstream analyses.
Cis-eQTL analysis
A detailed overview of the full analysis pipeline is presented in Figure 1. eQTL analyses were carried out within a tissue (MKs and platelets) and stratified by ancestry (AAs and EAs) with analysis performed for each gene within a 1-Mb window of each SNP, adjusting for appropriate covariates and family relatedness (see supplemental Methods for details). Results from eQTL analyses of AAs and EAs were combined within MKs and platelets, respectively, by meta-analyses using fixed effects models. We used these meta-analysis results to identify the most significant eQTL SNP for each gene using eigenMT,25 yielding a single SNP-gene pair for each gene; the P values of these SNP-gene pairs were then corrected using a false discovery rate procedure to perform multiple testing correction across genes. We called a SNP-gene pair an eQTL if the calculated q-value was below 0.05. The genes associated with the significant SNP-gene pairs are referred to here as eGenes.
![eQTL analysis pipeline. Samples were processed and analyzed separately by ethnicity (African American [AA] and European American [EA]) and tissue type (megakaryocytes [MKs] and platelets). Reads of each ethnicity/sample were aligned and assembled using the standard steps of the Tuxedo suite and the results were loaded into R using the Ballgown package. Only autosomal genes with median FPKM across samples larger than 1 (0.3 for platelets) were kept and logarithmically transformed. SNPs with less than 2 samples per genotype were excluded as were nonautosomal SNPs. Differences in gene expression between genotypes were assessed with linear models adjusting for clinical covariates, batch information, and principal components derived from gene-expression and genotype data. Meta-analysis was performed to combine results from AAs and EAs for MKs and platelets, respectively. Finally, significance of “peak” SNPs per gene were calculated by eigenMT software. Shared eQTLs between MKs and platelets were detected using these results, and the comparison with eQTLs reported at the GTEx portal was performed as well.](https://ash.silverchair-cdn.com/ash/content_public/journal/blood/137/7/10.1182_blood.2020006115/3/m_bloodbld2020006115f1.png?Expires=1763476895&Signature=RdDd62bce6FhKj4~oF4raSBtYZDkPyl66CoYAG8FYkdVzORKqwCMcFt~R3XansFf1s0n8k9G7XPVt64sgpRewnmi-Pya7SrUqs2~PjANEd3eoaatKRNJrqC~qEtYYZMMtt6cT4lWFh~L~t8QyEI6rtBABDCrNJLK6WF0b3BBHeirOygo1k297UvBPeOra8uoGVAJ6Xm3unZkJMS11xFzmBSzgb931Yb9oX3KWVk6LgxnoLtetMtpfeKYg3pyJ4fOdpZ-OAK0Hc07T9ly7nq8M9DpdcGkXJOInNF2s-WdSIb7LN2HqN5gbX0gSvW43uGMW~xhvWUsdDkoHNIho-ZUcA__&Key-Pair-Id=APKAIE5G5CRDK6RD3PGA)
eQTL analysis pipeline. Samples were processed and analyzed separately by ethnicity (African American [AA] and European American [EA]) and tissue type (megakaryocytes [MKs] and platelets). Reads of each ethnicity/sample were aligned and assembled using the standard steps of the Tuxedo suite and the results were loaded into R using the Ballgown package. Only autosomal genes with median FPKM across samples larger than 1 (0.3 for platelets) were kept and logarithmically transformed. SNPs with less than 2 samples per genotype were excluded as were nonautosomal SNPs. Differences in gene expression between genotypes were assessed with linear models adjusting for clinical covariates, batch information, and principal components derived from gene-expression and genotype data. Meta-analysis was performed to combine results from AAs and EAs for MKs and platelets, respectively. Finally, significance of “peak” SNPs per gene were calculated by eigenMT software. Shared eQTLs between MKs and platelets were detected using these results, and the comparison with eQTLs reported at the GTEx portal was performed as well.
eQTL analysis pipeline. Samples were processed and analyzed separately by ethnicity (African American [AA] and European American [EA]) and tissue type (megakaryocytes [MKs] and platelets). Reads of each ethnicity/sample were aligned and assembled using the standard steps of the Tuxedo suite and the results were loaded into R using the Ballgown package. Only autosomal genes with median FPKM across samples larger than 1 (0.3 for platelets) were kept and logarithmically transformed. SNPs with less than 2 samples per genotype were excluded as were nonautosomal SNPs. Differences in gene expression between genotypes were assessed with linear models adjusting for clinical covariates, batch information, and principal components derived from gene-expression and genotype data. Meta-analysis was performed to combine results from AAs and EAs for MKs and platelets, respectively. Finally, significance of “peak” SNPs per gene were calculated by eigenMT software. Shared eQTLs between MKs and platelets were detected using these results, and the comparison with eQTLs reported at the GTEx portal was performed as well.
Overlap of eQTLs with functional annotation tracks
To characterize the location of our eigenMT-identified peak SNPs relative to relevant functional annotations, we obtained bed-file tracks of regulatory signatures specific to MKs from the EU Blueprint project (http://www.blueprint-epigenome.eu) as well as control tracks. Enrichment of overlap of significant eigenMT results (false discovery rate-corrected P value <.05) compared with all eigenMT results was assessed using Fisher’s exact test.
Gene-set enrichment and pathway analysis
Gene-set enrichment analysis was performed to assess for enrichment of biologically relevant gene categories among highly expressed genes in MKs, relative to all known genes, using Fisher’s exact test as implemented in the topGO package26 (v2.37.0). We also investigated gene-set enrichment analysis in the set of significant eGenes to address 2 questions: (1) are the eGenes in MKs and platelets enriched for biologically meaningful pathways and (2) are the eGenes in MKs and platelets mapping to a relevant annotation track enriched for biologically meaningful pathways? Finally, we also selected genes mapping to the “platelet activation” GO category (GO:0030168) to determine if the correlation at these genes was higher than expected by chance between the MKs and platelets.
GWAS catalog overlap
To assess whether our eQTLs had previously been reported in GWAS of platelet-related traits, we downloaded the full National Human Genome Research Institute-European Bioformatics Institute GWAS catalog (v1.0.2) from https://www.ebi.ac.uk/gwas/docs/file-downloads and selected any entries where the word “platelet” was included in either the trait or the manuscript title, and which had reported GWAS P values <5 × 10⁻⁸. We compared these reported SNPs with our eQTLs and report all exact matches. We also calculated linkage disequilibrium (LD) between our eQTLs and the GWAS catalog SNPs or their closest proxies in our AA and EA data sets, and determined which of our eQTLs had an LD R2 ≥ 0.7 with a GWAS catalog SNP or its proxy.
Results
Overview of RNA-seq data
After quality control (QC) (Figure 1), we retained 9500 autosomal genes in the AA cohort (n = 84) and 9662 autosomal genes in the EA cohort (n = 101), for 9808 total genes in MKs. After QC (Figure 1), we retained 4998 autosomal genes in the AA cohort (n = 110) and 4555 autosomal genes in the EA cohort (n = 180), for 5034 total genes in platelets. A summary of the overlap of our gene expression results with those from prior publications is presented in supplemental Results.
Most platelet genes also expressed in MKs
Among the 5034 expressed genes in platelet samples, 4595 genes are also expressed in MKs corresponding to 91.3% of platelet genes. Of the 9808 expressed genes in the MKs, only 53.1% were found in platelets. Looking at 4092 genes with complete data in all individuals in both tissues, Spearman correlation of median expression across individuals was 0.46 (P value <2.2 × 10⁻¹⁶). Gene-set enrichment performed on all expressed genes in platelets and MKs revealed many significant GO terms (1015 and 622 with q-value < 0.05 in MKs and platelets, respectively; supplemental Table 2A-B). Of these significant terms, 14 and 12 from MKs and platelets, respectively, include the words “platelet,” “coagulation,” or “blood” in the associated GO term. In addition, 9 of the 10 GO terms reported by Bray et al16 as being top terms associated with platelet expression are among the significant terms for platelets in our data set.
Considering 86 genes expressed in both MKs and platelets mapping to the “platelet activation” GO category (GO:0030168), we saw higher correlation in gene median expression, comparing MKs and platelets (Spearman correlation of 72.6%, P value <2.2 × 10⁻¹⁶), than across 100 random sets of 86 genes (range of Spearman correlations, 19.4% to 61.7%; mean of the 100 reports, 43.9%; median, 44.8%; standard deviation, 9.2%).
eQTLs discovered in MKs and platelets from eigenMT
For n = 185 MK samples (n = 84 AAs and n = 101 EAs), meta-analyzed across ancestry group, we detected 946 significant eQTLs with their corresponding target eGenes (Table 1; supplemental Figure 1A). For n = 290 platelet samples (n = 110 AAs and n = 180 EAs), meta-analyzed across ancestry group, we detected 1830 significant eQTLs with their corresponding target eGenes (Table 1; supplemental Figure 1B).
Sample sizes and summary statistics for eQTL analyses (results from eigenMT)
| MKs | Platelets | |
|---|---|---|
| Individual tissue results | ||
| Samples (AA/EA) | 185 (84/101) | 290 (110/180) |
| Expressed genes | 9808 | 5034 |
| eQTLs/eGenes (q-value <0.05) | 946 | 1830 |
| eQTL/eGene overlaps (window)* | ||
| eGenes expressed in both tissues | 323 | |
| Exact matches | 57 | |
| Within ±5 kb | 121 | |
| Within ±100 kb | 256 | |
| Within ±1 Mb | 321 | |
Counts of data characteristics and eQTL results for each of MKs and platelets separately and in comparison with one another. All eQTLs/eGenes from eigenMT analysis with q-values < 0.05 were considered as candidates for overlap from 1 tissue to the other. Note that because eigenMT selects the top eQTL per gene, there is a 1:1 correspondence between eQTLs and eGenes here. However, because of differences in expression patterns and sample composition, some eQTLs/eGenes were not able to be compared. For window-based results, any significant eQTL/eGene in the second tissue within a window of ± the width value is accepted as an overlap eQTL/eGene
For cross-tissue comparison, only a subset of the eQTLs/eGenes can be tested for overlap because certain genes may only cross the expression threshold in one tissue, or certain SNPs may not be present in both data sets, and therefore may not be eligible for testing.
From these results, we identified 323 eGenes present in both tissues and 57 cis-eQTLs that were discovered in both MKs and platelets with q-values <0.05, considering exact matches (ie, eQTLs with exactly the same SNP-gene combination) (Table 1). Among these 57 shared eQTLs, 98.2% have the same direction of estimated effect (supplemental Table 3). Given that gene and variant filtering were performed separately within tissue (see “Methods”), not all SNP-gene pairs from 1 tissue were tested in the other. Of the 946 significant eQTLs in MKs, 446 (47.1%) gene-SNP combinations were tested in the platelets, and the direction of the effect is the same for 380 pairs (85.20%) (Figure 2A). Of the 1830 significant eQTLs in platelets, 1448 (79.1%) gene-SNP combinations were tested in the MKs, and the direction of the effect is the same for 1152 (79.55%) (Figure 2B).

Comparison of eQTL effect sizes between MKs and platelets. (A) Effect sizes of detected eQTLs in MKs with corresponding matches in platelets. Scatterplot of effect sizes among detected eQTLs in MKs with q-values < 0.05 and their corresponding direct matches in platelets. Among the 948 eQTLs detected in MKs, there are 446 direct gene-SNP matches in platelets and among these 446 pairs, 380 (85.2%) have the same direction of the estimated effect sizes. (B) Effect sizes of detected eQTLs in platelets with corresponding matches in MKs. Scatterplot of effect sizes among detected eQTLs in platelets with q-values < 0.05 and their corresponding direct matches in MKs. Among the 1830 eQTLs detected in platelets, there are 1448 direct gene-SNP matches in MKs and among these 1448 pairs 1152 (79.6%) have the same direction of the estimated effect sizes.
Comparison of eQTL effect sizes between MKs and platelets. (A) Effect sizes of detected eQTLs in MKs with corresponding matches in platelets. Scatterplot of effect sizes among detected eQTLs in MKs with q-values < 0.05 and their corresponding direct matches in platelets. Among the 948 eQTLs detected in MKs, there are 446 direct gene-SNP matches in platelets and among these 446 pairs, 380 (85.2%) have the same direction of the estimated effect sizes. (B) Effect sizes of detected eQTLs in platelets with corresponding matches in MKs. Scatterplot of effect sizes among detected eQTLs in platelets with q-values < 0.05 and their corresponding direct matches in MKs. Among the 1830 eQTLs detected in platelets, there are 1448 direct gene-SNP matches in MKs and among these 1448 pairs 1152 (79.6%) have the same direction of the estimated effect sizes.
In addition to examining identical SNP-gene combinations, we also considered whether eQTLs from 1 tissue fell within differently sized windows around eQTLs from the other tissue (ie, looking beyond the exact matches). As we expand the window size, we see more shared evidence for local genetic regulation of gene expression based on the presence of eQTL signals across the tissues, ranging from 17.6% overlapping for direct matches to 99.4% for a 1-Mb window (Table 1; Figure 3).

Number of shared eQTLs in MKs and platelets. Barplots represent the number of shared eQTLs in MKs and platelets for direct matches (0 kb) as well as 5-kb, 100-kb, and 1-Mb replication windows. There is greater overlap with the distance-based approach compared with the direct overlap in discovery signal. The overlap is higher when allowing for a larger overlap window.
Number of shared eQTLs in MKs and platelets. Barplots represent the number of shared eQTLs in MKs and platelets for direct matches (0 kb) as well as 5-kb, 100-kb, and 1-Mb replication windows. There is greater overlap with the distance-based approach compared with the direct overlap in discovery signal. The overlap is higher when allowing for a larger overlap window.
GWAS catalog overlap
After filtering the complete GWAS catalog (v1.0.2) for traits or manuscript titles containing the word “platelet” and limiting to curated SNPs with GWAS P values <5 × 10⁻⁸, we found 1065 distinct SNPs. Of these, 24 were significant eQTLs for at least one of our tissues, with 6 being significant in both platelets and MKs (Table 2; supplemental Table 4). An additional 46 MK eQTLs and 83 platelet eQTLs had LD R2 ≥ 0.7 with a GWAS catalog SNP or its proxy in either our EA or AA samples. The significant eQTL for the PEAR1 gene in MKs (q-value = 0.036) and platelets (q-value = 1.5 × 10⁻⁹) was rs12041331, a GWAS hit for platelet count,27 and for mean platelet volume and platelet distribution width.28 Thus, gene expression for the PEAR1 gene is significantly altered by genotype in both MKs and platelets, with a lower q-value noted in the platelets. Importantly, the PEAR1 locus is also a significant GWAS locus for platelet aggregation noted from 4 studies curated within the GWAS catalog.9,11,29,30 However, a limitation of our lookup against the GWAS catalog is that it focuses only on the sentinel curated variants; it is not an in-depth analysis across all variants mapping to a GWAS peak. In this particular case, the curated variant for platelet aggregation is rs12566888, which maps to the same GWAS peak as rs12041331, with noted linkage disequilibrium in the GeneSTAR data between the 2 (R2 of 0.41 and 0.46 in our AA MK and platelet samples, respectively; R2 of 0.91 and 0.84 in our EA MK and platelet samples, respectively; D-prime at least 0.97 in all cases).31 This explains why platelet aggregation is not directly reported in Table 2 despite prior evidence for strong colocalization between the platelet eQTL and the GWAS for platelet aggregation.32 The other 5 genes whose eQTLs in both platelets and MKs were also reported to have significance in a GWAS were TMEM50A, RHD, RHOF, SERPINE2, and HABP4 (Table 2).
Overlap between prior published GWAS catalog variants for platelet-related traits and significant eGenes in the platelet and/or MK analyses
| Chromosome | SNP position | eGene(s) in MKs | eGene(s) in platelets | GWAS phenotypes from GWAS catalog |
|---|---|---|---|---|
| chr1 | 25561667 | TMEM50A (9.58 × 10⁻⁵) | TMEM50A (8.59 × 10⁻¹⁰) | Plateletcrit |
| chr1 | 25561667 | RHD (1.03 × 10⁻²²) | RHD (7.88 × 10−37) | Plateletcrit |
| chr1 | 156869714 | PEAR1 (3.62 × 10⁻²) | PEAR1 (1.51 × 10⁻⁹) |
|
| chr1 | 8917102 | — | ENO1 (2.16 × 10⁻²⁷) | Plateletcrit |
| chr1 | 10271688 | — | KIF1B (1.54 × 10⁻¹⁹) | Mean platelet volume |
| chr1 | 202909974 | — | ADIPOR1 (2.90 × 10⁻³) | Mean platelet volume |
| chr1 | 247712303 | — | GCSAML (5.07 × 10⁻¹¹) |
|
| chr2 | 224874874 | SERPINE2 (2.22 × 10⁻¹²) | SERPINE2 (3.16 × 10−95) |
|
| chr2 | 31477838 | — | EHD3 (1.61 × 10⁻⁶) |
|
| chr3 | 56849749 | ARHGEF3 (7.46 × 10⁻²⁴) | — |
|
| chr3 | 122833003 | PDIA5 (1.21 × 10−92) | — |
|
| chr4 | 6883012 | TBC1D14 (6.08 × 10⁻⁵) | — | Platelet count |
| chr4 | 6857278 | — | TBC1D14 (2.25 × 10⁻⁶) | Platelet count |
| chr4 | 57767327 | — | POLR2B (5.81 × 10⁻³) | Platelet count |
| chr7 | 106372219 | CCDC71L (7.34 × 10⁻²⁰) | — |
|
| chr8 | 144996029 | PLEC (1.65 × 10⁻¹³) | — | Platelet count |
| chr9 | 99192919 | HABP4 (4.41 × 10−44) | HABP4 (4.55 × 10−45) |
|
| chr11 | 200343 | — | BET1L (5.93 × 10⁻¹²) | Plateletcrit |
| chr11 | 126285301 | — | ST3GAL4-AS1 (2.42 × 10⁻⁹) |
|
| chr11 | 126285301 | — | ST3GAL4 (6.39 × 10−36) |
|
| chr12 | 122216910 | — | TMEM120B (3.90 × 10⁻²) |
|
| chr12 | 122216910 | RHOF (5.33 × 10⁻¹²) | RHOF (3.87 × 10−54) |
|
| chr15 | 63341996 | — | TPM1 (2.70 × 10⁻²⁸) |
|
| chr20 | 1819280 | SIRPA (1.35 × 10⁻³) | — |
|
The GWAS catalog was examined for the following phenotypes: cardiometabolic and hematological traits, mean platelet volume, platelet count, platelet distribution width, platelet-derived growth factor BB levels, and Plateletcrit (see supplemental Methods for specific references). SNPs within the catalog were limited to those with P value <5 × 10⁻⁸, and all eGenes for this full set of curated variants are listed in this table. A total of 1065 variants were looked up, and 24 variants had a significant eGene in one or both tissues (q-values shown in parentheses).
Comparison with GTEx
Compared with all reported significant gene-SNP pairs of version V7 of the GTEx Project (https://www.gtexportal.org, 48 different tissue types), we identified that 74.9% and 84.3% of these eQTLs (using the peak SNP per gene results) were specific to MKs and platelets, respectively. This confirms the presence of a high degree of tissue-specific eQTLs in the MKs and platelets.
Comparison with published platelet eQTL results
Simon et al33 performed a platelet eQTL analysis based on 154 healthy individuals with genotype array and microarray expression data and reported 612 eGenes with a total of 44 940 associated eQTLs (SNPs) with P value <1 × 10⁻⁶ (MatrixEQTL results reported in their supplemental Table 2). Among their 612 eGenes, 489 gene symbols matched those from genes expressed in our platelet data, and 417 of these 489 genes (85%) were also identified as eGenes in our eigenMT analysis. Simon et al reported 54% of the lead SNPs to be in the gene body; we detected a similar 50.7% in platelets (compared with 42.9% in our MK data). Our larger sample size (n = 290) and expanded sensitivity from using WGS data and RNA-seq has given us the statistical power to detect nearly 3 times as many eGenes (n = 1830) as reported by Simon et al, expanding our knowledge of genetic regulation of expression in this tissue.
Overlap of eQTLs with functional annotation tracks
As expected, there was no enrichment for the presence of significant eQTLs in regions contained in either of the 2 control tracks (human mammary epithelial cells and shuffled MK superenhancer tracks, minimum P value from Fisher’s exact test from 4 comparisons = 0.04 in platelets). There was, however, significant enrichment in all other tissue relevant tracks (DNAse hotspot regions, H3K27 acetylation loci, H3K4me3 loci, enhancer elements derived by chromatin segmentation, and MK superenhancer elements), including especially strong signals for primary DNAse hotspot regions (P value = 1.2 × 10−54 and P value = 1.5 × 10−56 in platelets and MKs, respectively; all P values <5.0 × 10⁻⁹; Figure 4).
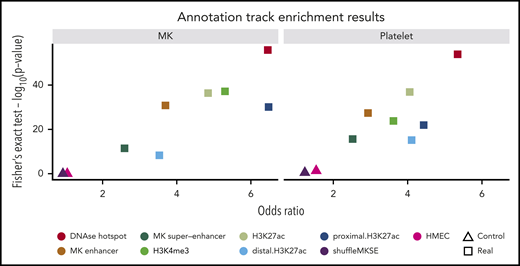
Enrichment of overlap of eigenMT eQTLs and relevant annotation tracks. Scatter plots show odds ratios (x-axis) vs -log10 (P value) from Fisher’s exact test assessing the overlap of significant eQTLs from our eigenMT analysis with the indicated annotation tracks, including 2 control tracks of no biological relevance to MKs or platelets. HMEC, human mammary epithelial cells.
Enrichment of overlap of eigenMT eQTLs and relevant annotation tracks. Scatter plots show odds ratios (x-axis) vs -log10 (P value) from Fisher’s exact test assessing the overlap of significant eQTLs from our eigenMT analysis with the indicated annotation tracks, including 2 control tracks of no biological relevance to MKs or platelets. HMEC, human mammary epithelial cells.
Gene-set enrichment and pathway analysis
For significant eGenes compared with all expressed genes, no results from the MSigDB pathway analyses or the topGO analyses were significant after multiple testing correction for either platelets or MKs. Looking specifically at significant eGenes overlapping with our 7 biologically relevant annotation tracks, we see limited significant enrichment. For the platelet eGenes, those with SNPs overlapping the MK superenhancer track showed enrichment for the TONKS_TARGETS_OF_RUNX1_RUNX1T1_FUSION_HSC_DN MSigDB pathway (q-value = 9.1 × 10⁻⁵) and the PID_ENDOTHELIN_PATHWAY and PID_LYSOPHOSPHOLIPID_PATHWAY pathways from the canonical pathways database at MSigDB (q-values both = 0.03). For the MKs, again considering eQTLs that overlap with the MK superenhancer track, there is significant enrichment of eGenes with the SMID_BREAST_CANCER_LUMINAL_B_DN MSigDB pathway (q-value = 8.8 × 10⁻⁴).
Discussion
We have recently published confirmation of the integrity of our iPSC-derived MKs: we detected a very low rate of genotype discordance, and no structural variation was generated in the iPSCs from donor DNA that was subsequently passed on to the MKs.34 Importantly, we also observed highly biologically relevant gene sets as being upregulated in MKs relative to the iPSCs: platelet activation, blood coagulation, megakaryocyte development, platelet formation, platelet degranulation, platelet aggregation, and regulation of cell proliferation.34 Our ability to generate the regulatory landscape in the anucleate platelet and the iPSC-derived megakaryocyte is a valuable bridge for our gap in knowledge with respect to these key target tissues relevant to a wide range of complex human disease (eg, hemostasis and thrombosis mediators, inflammation, cardiovascular diseases, diabetes, arthritis, cancer35 ). In this first comprehensive and well-powered approach using whole-genome and RNA-seq approaches, we find a high overlap in the transcriptional signature between the 2 target tissues, and overall good concordance in both transcript presence and abundance between our data and prior MK and platelet gene-expression data sets (supplemental Results), despite small sample sizes in prior studies. In our data, the vast majority of the genes expressed in platelets (91.3%) were also expressed in the iPSC-derived MKs, as anticipated given the lineage of the 2 tissues.
In our eQTL analysis, we observe a nearly twofold difference in the number of cis-eQTLs identified in the platelets (n = 1836) compared with MKs (n = 946). This difference reflects a combination of the larger sample size and fewer genes tested in the platelets (Table 1) as well as overall less variability of gene expression across samples in the platelets relative to the MKs (supplemental Figure 2).
Several of the 57 eGenes shared across tissue have known genetic associations with platelet-related traits, such as TMEM50A, RHD, PEAR1, SERPINE2, HABP4, and RHOF. Although we had a small number of individuals (29 EAs and 16 AAs) with data from both MKs and platelets, the correlation in gene expression across these pairs is not higher than for random pairs of individuals, and hence they are not likely to be driving the overlap we observe.
The high number of tissue-specific eQTLs in the MKs and platelets observed relative to GTEx (74.9% and 84.2% in MKs and platelets, respectively) confirms the importance of using relevant target tissues for the study of platelet related phenotypes. The percentage of expressed genes per tissue identified as eGenes ranged from 7.6% to 56.7%, with an average of 29.8%. In comparison, 36.4% and 9.6% of our tested genes were identified as eGenes in platelets and MKs, respectively. The number of eGenes in MKs is at the lower end of that range, whereas the number of eQTLs detected in platelets is in accordance with GTEx numbers. One possible explanation is the technical complexity of the gene expression data of MKs in which we observe higher variability (supplemental Figure 2). This is potentially the result of sequencing batch effects and variability in differentiation of the MKs, which we have included as a covariate within the model (ie, CD41+CD42a+) but may not be fully accounted for.
In terms of cross-tissue overlap patterns, among the 946 and 1830 eGenes detected in MKs and platelets, respectively, we detected 323 eGenes (34.1%) in common between MKs and platelets (Table 1). For comparison, between all pairs of the 48 GTEx tissues the average overlap of eGenes is 62.6% (33.7%-86.9%), putting our observed overlap on the lower end of the spectrum. However, the average tissue in GTEx had ∼5000 eGenes, much higher than what we observed in platelets and MKs, and tissues with more eGenes typically had higher levels of overlap with other tissues. Given that platelets are cell fragments that do not have the need for transcripts related to cell maintenance functions like DNA replication/repair, RNA transcription and have limited need for transcripts related to protein synthesis, which are typically common to all cells, lower overlap may reflect the true biology of platelets. Of the 57 eGenes shared between platelets and MKs, 21 are also eGenes in GTEx, but 31 are not (supplemental Table 3). The eGenes not seen in GTEx include PEAR1 and RHOF, and HABP4 was not available for comparison; this indicates a functional role for these genes which may be unique to platelets and MKs.
In both MKs and platelets, the SNP rs12041331 was a significant eQTL (q-values 0.036 and 1.5 × 10⁻⁹ in MKs and platelets, respectively), regulating expression of the PEAR1 gene. This specific variant has previously been associated with platelet count, volume and distribution width phenotypes,28 and platelet aggregation phenotypes31 in genetic association analyses. The link between this variant and gene expression of PEAR1 provides a possible functional mechanism through which genetics are contributing to platelet phenotypes. Of the 5 additional GWAS catalog SNPs significantly associated with platelet traits that were also eQTLs in both tissues, SERPINE2 (q-values 2.2 × 10⁻¹² and 3.2 × 10−95 in MKs and platelets, respectively), also known as PN1, has been shown to be present in platelet α granules and linked to vascular phenotypes,36,37 and is a potential important node in cardiometabolic traits.38 RHD (q-values 1.0 × 10⁻²² and 7.9 × 10−37 in MKs and platelets, respectively) is a blood group antigen, and the literature supports a relationship between RhD+/− status and differences in platelet transfusion/thrombocytopenia.39 Thus, platelet (and red cell) eQTLs that are common may have clinical relevance and could be linked to markers of RH type. RHOF (q-values 5.3 × 10⁻¹² and 3.9 × 10−54 in MKs and platelets, respectively) shares a gene family whose members, along with actin-cyto, are important to platelet generation and function. Although there is a negative report in a mouse study on platelet effects of Rhof−/−,40 this does not necessarily mean there is not an important functional role in human platelets. Finally, there is little known about TMEM50A (q-values 9.6 × 10⁻⁵ and 8.6 × 10⁻¹⁰ in MKs and platelets, respectively) and HABP4 (q-values 4.4 × 10−44 and 4.6 × 10−45 in MKs and platelets, respectively), so these could be exciting new genes.
Direct matchups for sentinel variants are not always an accurate measure of overlap in eQTL regulatory evidence with GWAS results, as evidenced by our results on rs12041331 as an eQTL for PEAR1 expression and GWAS signal for platelet aggregation. Notably, we observe additional eQTLs in strong LD (R2 ≥ 0.7) with a GWAS catalog variant or its proxy in our AA and EA data sets as well (46 and 83 in MKs and platelets, respectively). A full colocalization against all platelet-related GWAS data would potentially yield interesting results; however, this analysis is outside the scope of the current manuscript and is left as future work.
We saw striking enrichment of eQTLs in platelets and MKs in DNAse hotspot regions, H3K27 acetylation loci, H3K4me3 loci, enhancer elements derived by chromatin segmentation, and MK superenhancer elements (all P values <3.4 × 10⁻¹⁰), with an especially strong signal for primary DNAse hotspot regions (P value = 3.5 × 10−48 and P value = 4.6 × 10−45 in platelets and MKs, respectively). This is in marked contrast to the lack of any enrichment of eQTLs in regions mapping to control tracks (human mammary epithelial cells and shuffled MK superenhancer tracks). These results support the enrichment of the identified eQTLs in regulatory regions of the human genome that are meaningful to the specific lineage of the anucleate platelet.
Additional areas of future work include using allele-specific expression from these data to explore whether there is a link between genotypes (eQTLs) and expression of transcripts carrying certain alleles. Further exploration of downstream effects through proteomics data will also characterize which observed differences in gene expression seem to lead to differences at the protein level. Initial exploration on a limited set of samples indicates potentially interesting but inconclusive results.
Conclusion
Using a comprehensive RNA-seq approach, we have performed a thorough description and analysis of the transcriptomic signature of platelets and iPSC-derived megakaryocytes, in the largest study to date including a total of 290 platelet and 185 MK samples. We observe a high overlap in expressed genes between the anucleate platelet and its precursor, the MK. Furthermore, there is a large degree of unique regulatory evidence from these platelets and MKs relative to other tissues present in GTEx, with significant enrichment of the platelet and MK regulatory signal within MK superenhancer elements. The statistics for the full set of MatrixEQTL and eigenMT results are publicly available to the scientific community, and integration of these data with genomewide association approaches should facilitate our ability to identify causal/functional variants for loci associated with platelet-related phenotypes (https://www.biorxiv.org/content/10.1101/621565v1).
WGS variant calls are available for all samples through the Database of Genotypes and Phenotypes (dbGaP) under accession number phs001218.v2.p1.A-seq data (raw reads) are available through application and approval from the GeneSTAR Study Steering Committee: https://www.hopkinsmedicine.org/gim/research/GeneSTAR/for_researchers eQTL analysis results are hosted on the Web site: http://www.biostat.jhsph.edu/~kkammers/GeneSTAR/. Code for analyses is available from the authors upon request.
The online version of this article contains a data supplement.
The publication costs of this article were defrayed in part by page charge payment. Therefore, and solely to indicate this fact, this article is hereby marked “advertisement” in accordance with 18 USC section 1734.
Acknowledgments
The authors thank our participants and staff for their valuable contributions and gratefully acknowledge the studies and participants who provided biological samples and data for TOPMed.
GeneSTAR was supported by grants from the National Institutes of Health (NIH), National Heart, Lung, and Blood Institute (NHLBI; HL112064, U01HL107446, HL118356, HL141944) and the NIH, National Center for Advancing Translational Sciences (UL1TR001079) to the Johns Hopkins Institute for Clinical & Translational Research. K. Kammers was also supported by a Center Core Grant from the NIH, National Cancer Institute (P30-CA006973). Z.Z.W. was also supported by the NIH, National Institute of Diabetes and Digestive and Kidney Disease (R01DK106109). WGS for the TOPMed program was supported by the NIH, NHLBI. WGS for “NHLBI TOPMed: GeneSTAR” (phs001218.v2.p1) was performed at the Broad Institute of Massachusetts Institute of Technology and Harvard (grant HHSN268201500014C), Psomagen, Inc. (NIH, NHLBI grant 3R01HL112064-04S1), and Illumina Genomic Services (NIH, NHLBI grant R01HL112064). Centralized read mapping and genotype calling, along with variant quality metrics and filtering were provided by the TOPMed Informatics Research Center (NIH, NHLBI grant 3R01HL-117626-02S1, contract HHSN268201800002I). Phenotype harmonization, data management, sample-identity QC, and general study coordination were provided by the TOPMed Data Coordinating Center (NIH, NHLBI grant 3R01HL-120393-02S1, contract HHSN268201800001I). The GTEx Project was supported by the Common Fund of the Office of the Director of the NIH, and by the NIH National Cancer Institute, National Human Genome Research Institute, NHLBI, National Institute on Drug Abuse, National Institute of Mental Health, and National Institute of Neurological Disorders and Stroke. The data used for the analyses described in this manuscript were obtained from the GTEx Portal on 5 December 2018.
This study makes use of data generated by the Blueprint Consortium. A full list of the investigators who contributed to the generation of the data are available from www.blueprint-epigenome.eu. Funding for the project was provided by the European Union's Seventh Framework Programme (FP7/2007-2013) under grant agreement no 282510 BLUEPRINT.
The views expressed in this manuscript are those of the authors and do not necessarily represent the views of the National Heart, Lung, and Blood Institute, the National Institutes of Health, or the US Department of Health and Human Services.
Authorship
Contribution: R.A.M. and L.C.B. conceptualized the study; L.R.Y., J.M., K. Kammers, K. Kanchan, L.C., and Z.Z.W. undertook data curation; K. Kammers, M.A.T., and B.R. provided formal analysis; L.C.B. and R.A.M. acquired funding acquisition; K. Kammers, M.A.T., B.R., I.R., A.B., and R.A.M. undertook methodology; L.R.Y. administered the project; K. Kammers, M.A.T., and B.R. undertook software/visualization; I.R., A.D.J., J.T.L., N.F., and R.A.M. supervised; K. Kammers, M.A.T., and R.A.M. wrote the original draft; and all authors reviewed and edited the article.
Conflict-of-interest disclosure: The authors declare no competing financial interests.
Correspondence: Rasika A. Mathias, The GeneSTAR Research Program, Johns Hopkins University School of Medicine, 1830 E Monument St, Baltimore, MD 21205; e-mail: rmathias@jhmi.edu.

This feature is available to Subscribers Only
Sign In or Create an Account Close Modal