

Key Points
Gabbr1 is involved in HSPC proliferation and B-cell differentiation.
Treatment of human UCB progenitors with GABBR1 agonist results in increased long-term engraftment after transplantation.

Abstract
Hematopoietic and nervous systems are linked via innervation of bone marrow (BM) niche cells. Hematopoietic stem/progenitor cells (HSPCs) express neurotransmitter receptors, such as the γ-aminobutyric acid (GABA) type B receptor subunit 1 (GABBR1), suggesting that HSPCs could be directly regulated by neurotransmitters like GABA that directly bind to GABBR1. We performed imaging mass spectrometry and found that the endogenous GABA molecule is regionally localized and concentrated near the endosteum of the BM niche. To better understand the role of GABBR1 in regulating HSPCs, we generated a constitutive Gabbr1-knockout mouse model. Analysis revealed that HSPC numbers were significantly reduced in the BM compared with wild-type littermates. Moreover, Gabbr1-null hematopoietic stem cells had diminished capacity to reconstitute irradiated recipients in a competitive transplantation model. Gabbr1-null HSPCs were less proliferative under steady-state conditions and upon stress. Colony-forming unit assays demonstrated that almost all Gabbr1-null HSPCs were in a slow or noncycling state. In vitro differentiation of Gabbr1-null HSPCs in cocultures produced fewer overall cell numbers with significant defects in differentiation and expansion of the B-cell lineage. To determine whether a GABBR1 agonist could stimulate human umbilical cord blood (UCB) HSPCs, we performed brief ex vivo treatment prior to transplant into immunodeficient mice, with significant increases in long-term engraftment of HSPCs compared with GABBR1 antagonist or vehicle treatments. Our results indicate a direct role for GABBR1 in HSPC proliferation, and identify a potential target to improve HSPC engraftment in clinical transplantation.
Introduction
Hematopoietic stem/progenitor cells (HSPCs) maintain hematopoiesis throughout life by self-renewal or multilineage differentiation to produce mature progeny.1 The bone marrow (BM) serves as the HSPC microenvironment niche, where HSPCs receive signals regulating their proliferation, differentiation, or quiescence.2 The nervous system innervates the BM niche, and regulates HSPCs during homeostasis and tissue regeneration.3 The nervous system indirectly regulates HSPCs by modulating BM niche stromal cells.4 However, there is also evidence for expression of neuroreceptors on HSPCs.5-10
γ-Aminobutyric acid (GABA) is the main inhibitory neurotransmitter in the central nervous system. It binds GABA A ligand-gated ion channel receptors, or GABA B G protein–coupled receptors.11 GABA is also found in peripheral tissues such as pancreas, spleen, and lung.12,13 Surprisingly, human CD34+ and CD133+ HSPCs express GABA type B receptor subunit 1 (GABBR1),5,14 however, its function in hematopoiesis remains unknown. Using a CRISPR-generated global Gabbr1-knockout mouse model, we demonstrate that Gabbr1 can regulate the HSPC pool. Gabbr1-null mice showed decreased HSPC BM numbers and peripheral lymphoid cell numbers. Colony-forming unit (CFU) assays indicated that Gabbr1-null mice had few cycling progenitors. Significantly, Gabbr1-null HSPCs showed reduced proliferative ability and hematopoietic reconstitution. Expression profiling from Gabbr1-null HSPCs revealed significant deregulation of B-cell differentiation. Additionally, human CD34+ umbilical cord blood (UCB) HSPCs treated with the GABBR1 agonist, baclofen, produced sustained increases in BM chimerism and progenitor numbers for up to 16 weeks in a xenograft mouse model. This indicates that neuroreceptor GABBR1 is a critical regulator of the HSPC pool.
Materials and methods
Mouse strains
All mice were housed at University of Illinois Chicago (UIC) AAALAC-certified animal facilities. Food and water ad libitum were routinely given. The Institutional Animal Care and Use Committees of UIC approved all experimental procedures. C57/BL6 (CD45.2), CD45B6.SJL-PtprcaPep3b/BoyJ (CD45.1), and Rag1−/− mice15 were purchased from The Jackson Laboratory (Bar Harbor, ME) or Charles River (Wilmington, MA). CD45.1/2 were generated by crossing CD45.1 females with CD45.2 males. Gabbr1 C57/BL6–knockout (Gabbr1−/−) mice were generated at the University of Chicago by CRISPR/Cas9 base pair insertion leading to a nonsense mutation. Postnatal day 13 and 15 (P13 and P15) Gabbr1−/− mice were used due to survival defects at P20.16-18
Imaging mass spectrometry
Femurs were harvested from female 6- to 8-week-old C57/BL6 mice, frozen fresh in 2% carboxymethylcellulose (217277; EMD Millipore) in prechilled hexane on dry ice, and stored at −80°C. Bones were sectioned at 10 μm using MX35 blades (Thermo Scientific) on a Leica CM 1850 UV cryostat. We adhered the copper tape to the slides prior to collection and a roll plate was necessary to keep samples from fracturing. After femurs were adhered to indium tin-oxide–coated glass sides (Bruker Daltonics) using double-sided copper conductive tape (Electron Microscopy Sciences), samples were prepared for matrix-assisted laser desorption/ionization time-of-flight imaging mass spectrometry (IMS).
Analysis of hematopoietic populations
After isolation and cellularization of BM and fetal liver (FL) hematopoietic cells, antibody staining was performed, followed by flow cytometry (BD LSRFortessa Flow Cytometer; BD Biosciences). Details of antibodies are in supplemental Table 1 (available on the Blood Web site). Data were analyzed using FACSDiva 6.0 (BD Biosciences) and FlowJo software.
Noncompetitive stem cell transplantation
BM cells (1 × 10⁶) harvested from 3 pooled P15 Gabbr1+/+ or Gabbr1−/− littermate mice were transplanted into lethally irradiated CD45.1 recipients. For hematopoietic stem cell (HSC) transplantation, 350 HSCs (Lin−/Sca1+/cKit+/CD48−/CD150+) from BM of Gabbr1+/+ or Gabbr1−/− mice were injected into irradiated CD45.1 recipients with 5 × 10⁵ CD45.1/2 spleen cells. Recipients were maintained on antibiotic water for 1 week before, and 2 weeks after, transplantation. Donor reconstitution was measured in peripheral blood (PB; at 1, 2, 3 months, lysed with ACK lysis buffer), and BM at 3 months. Details of antibodies are in supplemental Table 1.
Competitive transplantation
For primary competitive transplantation, 350 HSCs (Lin−/Sca1+/cKit+/CD48−/CD150+) from 3 to 4 Gabbr1+/+ or Gabbr1−/− littermates (CD45.2) were sorted and mixed with 350 competitor HSCs pooled from 3 to 4 CD45.1/2 wild-type (WT) mice. Mixed cells were retro-orbitally transplanted into lethally irradiated congenic CD45.1 recipients with 5 × 10⁵ CD45.1 spleen cells. Donor reconstitution was evaluated as above (see "Noncompetitive stem cell transplantation"). Secondary transplants followed (see supplemental Methods).
Supplemental methods
Further details on sample processing, other assays, and bioinformatic analyses are in supplemental Methods.
Results
HSPCs express Gabbr1
We investigated receptor Gabbr1 expression in mouse HSPCs and presence of its neurotransmitter, GABA, in the BM. Published HSPC microarray and single-cell RNA-sequencing (RNA-seq) data were reanalyzed for Gabbr1 expression. A recent study19 did not score Gabbr1 as expressed in HSPCs because of low levels in bulk microarray data from Gene Expression Commons (GEXC).20 Despite low expression levels of Gabbr1 in HSPCs, relative levels are higher in HSCs compared with more differentiated progenitors, with the exception of common lymphoid progenitors (CLPs) that have the highest expression level of Gabbr1 (Figure 1A; supplemental Figure 1A).21 We analyzed single-cell RNA-seq data from 3 independent studies that detected Gabbr1 in a subset of HSPCs (Figure 1B, and data not shown).22-24 In order to confirm published results, we used flow cytometry to test for Gabbr1 receptor surface expression in BM HSPCs. A distinct population of Lin−Sca1+cKit+ (LSK) progenitors (∼12%) and HSCs (LSK/CD48−/CD150+; ∼15%) has detectable Gabbr1 surface expression (Figure 1C), indicating that Gabbr1 is expressed in a subset of BM-resident HSPCs, including HSCs.

HSPCs express GABA B receptor Gabbr1 and B-cell lineages express glutamate decarboxylase Gad1. (A) RT-qPCR of relative Gabbr1 expression in sorted HSPC populations. (B) Published single-cell RNA-seq data detected Gabbr1 in a subset of HSPCs.22 (C) Representative flow cytometry data and bar graph showing ∼12% of Lin−Sca1+cKit+ (LSK) progenitors, and ∼15% of HSCs (LSK/CD48−/CD150+) express cell-surface Gabbr1 receptor. (D) RT-qPCR analysis of Gad1 expression in sorted phenotypic B cells (B220+), CD11b+ cells, osteoblastic cells (OBCs), and BM endothelial cells (BECs) (n = 3, from 2 independent experiments). (E) Representative intracellular flow cytometry data and bar graph showing that 77.7% of B220+/CD93− cells express Gad1, compared with CD11b+ cells that express almost none (n = 3, from 2 independent experiments). ***P < .001. (F) Immunofluorescent antibody staining (scale bar, 20 μm) of sternum BM showing that Gad1 (green) is expressed in B220+ (red) B cells (arrowheads point to cells that express both markers). Gad1 is not expressed in Cd11b+/Gr1+ myeloid cells (representative of n = 9 sternum regions from n = 4 mice) (see also supplemental Figure 1). CMP, common myeloid progenitor; DAPI, 4′,6-diamidino-2-phenylindole; GMP, granulocyte-macrophage progenitor; LT-HSC, long-term HSC; MEP, megakaryocyte-erythroid progenitor; MPP, multipotent progenitor; N.D., not determined; Prog, progenitor.
HSPCs express GABA B receptor Gabbr1 and B-cell lineages express glutamate decarboxylase Gad1. (A) RT-qPCR of relative Gabbr1 expression in sorted HSPC populations. (B) Published single-cell RNA-seq data detected Gabbr1 in a subset of HSPCs.22 (C) Representative flow cytometry data and bar graph showing ∼12% of Lin−Sca1+cKit+ (LSK) progenitors, and ∼15% of HSCs (LSK/CD48−/CD150+) express cell-surface Gabbr1 receptor. (D) RT-qPCR analysis of Gad1 expression in sorted phenotypic B cells (B220+), CD11b+ cells, osteoblastic cells (OBCs), and BM endothelial cells (BECs) (n = 3, from 2 independent experiments). (E) Representative intracellular flow cytometry data and bar graph showing that 77.7% of B220+/CD93− cells express Gad1, compared with CD11b+ cells that express almost none (n = 3, from 2 independent experiments). ***P < .001. (F) Immunofluorescent antibody staining (scale bar, 20 μm) of sternum BM showing that Gad1 (green) is expressed in B220+ (red) B cells (arrowheads point to cells that express both markers). Gad1 is not expressed in Cd11b+/Gr1+ myeloid cells (representative of n = 9 sternum regions from n = 4 mice) (see also supplemental Figure 1). CMP, common myeloid progenitor; DAPI, 4′,6-diamidino-2-phenylindole; GMP, granulocyte-macrophage progenitor; LT-HSC, long-term HSC; MEP, megakaryocyte-erythroid progenitor; MPP, multipotent progenitor; N.D., not determined; Prog, progenitor.
GABA is present in the adult BM endosteal region
We set out to identify the cell type that produces GABA in BM, based on expression of glutamate decarboxylase enzymes GAD1 or GAD2 that convert glutamic acid to GABA.25 It was suggested that non-neural cells in the BM were candidates for GABA production, however, the specific cell type was not determined.19 Single-cell RNA-seq data of BM stromal cells did not reveal a cell type clearly expressing Gad1 or Gad2.26 However, Haemopedia RNA-seq and microarray data of mouse hematopoietic populations found that Gad1 (but not Gad2) was strongly enriched in B cells (supplemental Figure 1B).27,28 Quantitative reverse transcription polymerase chain reaction (RT-qPCR) analysis of sorted B cells confirmed expression of Gad1 transcript (Figure 1D). Intracellular flow cytometry analysis of B220+CD93− B cells found that 77.7% were positive for Gad1, whereas CD11b+ myeloid cells were negative (Figure 1E). These results were confirmed by immunofluorescence analysis of mouse BM sternum that showed B220+ B cells, but not CD11b+ myeloid cells, were positive for Gad1 (Figure 1F). We repeated intracellular flow cytometry and immunofluorescence analysis using BM from Rag1−/− mutants that lack B cells.15 Gad1 expression was largely absent in BM of these B-cell–deficient mutants (supplemental Figure 1C-D). Together, this establishes Gabbr1 receptor expression by a subset of HSPCs, including HSCs, and that B cells express Gad1 enzyme.
We determined whether endogenous GABA molecules are present in the BM. To achieve spatial mapping of GABA across different regions of the BM niche, we performed IMS analysis.29 IMS is label-free and allows for direct detection and relative quantification of endogenous metabolites. Femur sections from WT adult mice were spotted with commercial GABA standard as an internal control (supplemental Figure 2A-B). IMS was performed at a spatial resolution of 20 μm, and data were normalized to root mean square. GABA ions were detected in BM sections (n = 4), and both the protonated molecule (C4H10NO2+, [M + H ]+, m/z 104), as well as the dehydrated ion (C4H8NO+, [M − H2O + H ]+, m/z 86), were detected with high intensity in the standard and femur (Figure 2A-C; supplemental Figure 2A-B). Upon visual analysis of the IMS data, the m/z 86 and m/z 104 ions had the same spatial distribution in the samples (Figure 2B-C). In the standard, the limit of detection was between 100 µM and 1 mM GABA (Figure 2B-C). High-resolution detail from BM diaphysis (Figure 2D) shows m/z 86 is highly localized to the outer endosteal region.
![IMS shows GABA ion is enriched in the endosteal region of the BM. (A-C) IMS of WT bone sections (n = 2 mice). (A) “Bone regions imaged” shows slide with 3 regions selected for IMS analysis (1-3), in sum they represent an entire femur slice. The slide is spotted with commercial GABA standards. (B) Left to right, Optical images of captured regions, bone overlay of mass filter on optical image (to confirm localization to endosteum), mass filter (black background for increased visible intensity), and GABA standards (concentrations from 1 µM to 10 mM), for m/z 104 (adjusted intensity range between 7% [dark blue] and 82% [white]). (C) As in panel B, for m/z 86 (adjusted intensity range between 8% [dark blue] and 100% [white]). GABA standards show limit of detection is between 100 µM and 1 mM. (D) Detail showing endosteal enrichment of GABA signal in mass filter and bone overlay for m/z 86. (E) Quantification of IMS of femur sections from WT and Rag1−/− mice show a significant decrease of GABA ion in the Rag1−/− bones (P < .001). Error bars indicate standard deviation of data sets based on 4 measurements: 2 biological samples × 2 technical replicates per biological sample (see also supplemental Figure 2).](https://ash.silverchair-cdn.com/ash/content_public/journal/blood/137/6/10.1182_blood.2019004415/4/m_bloodbld2019004415f2.png?Expires=1770558571&Signature=V3UgfDg19Z4c3rBc9wDQzSrq~OfxD0g7jMfhhwj4RuwBxjf9epXWj-lE8E~6-klJGh7QTfDC5-ioLfTHWogBmdzVGpo3PFCihZM0BkntqsLnYl7W0WVbcg1G8AHKrxLI3hYE1Yhg8tuN~KEukheVAqQf7bDhu-Rq1OKLNw9P3CiUu1I9W7G4ZKogPpejAEAII-qi4b2CD8JqX8UeFOsMHIfKsYt3nayWsVCHG330VJAV9Dlpu0jOh57WsipieaJK0IyDQrr2IpxXw76dEIsYhKnrJei9ahRF4HAbPL4AApYgC-j3fBuwCFuvx0g3Oas~UAo6peNrAQwClAAkNIXLsQ__&Key-Pair-Id=APKAIE5G5CRDK6RD3PGA)
IMS shows GABA ion is enriched in the endosteal region of the BM. (A-C) IMS of WT bone sections (n = 2 mice). (A) “Bone regions imaged” shows slide with 3 regions selected for IMS analysis (1-3), in sum they represent an entire femur slice. The slide is spotted with commercial GABA standards. (B) Left to right, Optical images of captured regions, bone overlay of mass filter on optical image (to confirm localization to endosteum), mass filter (black background for increased visible intensity), and GABA standards (concentrations from 1 µM to 10 mM), for m/z 104 (adjusted intensity range between 7% [dark blue] and 82% [white]). (C) As in panel B, for m/z 86 (adjusted intensity range between 8% [dark blue] and 100% [white]). GABA standards show limit of detection is between 100 µM and 1 mM. (D) Detail showing endosteal enrichment of GABA signal in mass filter and bone overlay for m/z 86. (E) Quantification of IMS of femur sections from WT and Rag1−/− mice show a significant decrease of GABA ion in the Rag1−/− bones (P < .001). Error bars indicate standard deviation of data sets based on 4 measurements: 2 biological samples × 2 technical replicates per biological sample (see also supplemental Figure 2).
IMS shows GABA ion is enriched in the endosteal region of the BM. (A-C) IMS of WT bone sections (n = 2 mice). (A) “Bone regions imaged” shows slide with 3 regions selected for IMS analysis (1-3), in sum they represent an entire femur slice. The slide is spotted with commercial GABA standards. (B) Left to right, Optical images of captured regions, bone overlay of mass filter on optical image (to confirm localization to endosteum), mass filter (black background for increased visible intensity), and GABA standards (concentrations from 1 µM to 10 mM), for m/z 104 (adjusted intensity range between 7% [dark blue] and 82% [white]). (C) As in panel B, for m/z 86 (adjusted intensity range between 8% [dark blue] and 100% [white]). GABA standards show limit of detection is between 100 µM and 1 mM. (D) Detail showing endosteal enrichment of GABA signal in mass filter and bone overlay for m/z 86. (E) Quantification of IMS of femur sections from WT and Rag1−/− mice show a significant decrease of GABA ion in the Rag1−/− bones (P < .001). Error bars indicate standard deviation of data sets based on 4 measurements: 2 biological samples × 2 technical replicates per biological sample (see also supplemental Figure 2).
To confirm detection of a molecule with a different spatial distribution in the BM, we used IMS to detect heme, an indicator of erythrocyte localization. Heme was at high levels within the central sinus that carries large blood volumes. Both unbound ([M + H]+, m/z 567) and iron-bound ([M + H]+, m/z 616) heme was detected in the central region of the BM (supplemental Figure 2E), and was distinct from endosteal localization of GABA (supplemental Figure 2F).
Following our finding that B cells express the GABA-producing enzyme Gad1, and are potential sources of GABA, we used IMS to evaluate relative contributions of B cells to GABA levels in the BM. Although IMS is not completely quantitative, the limit of detection, determined by ionization efficiency of the standard, provides a general measure of GABA amounts produced in BM. We compared GABA levels in Rag1−/− and WT femur sections. GABA levels were significantly lower in Rag1−/− B-cell–deficient bones (Figure 2E). Representative IMS data show GABA levels reduced in the endosteal region of Rag1−/− femur (supplemental Figure 2G-H).
Gabbr1-null mutants have reduced numbers of hematopoietic progenitors and B lymphocytes
Reports established a neurological phenotype in Gabbr1 loss-of-function mouse mutants on various genetic backgrounds.16-18 To conduct consistent hematopoietic analysis, we generated a Gabbr1-null (Gabbr1−/−) mutant on a C57BL/6 background using CRISPR/Cas9 gene editing (supplemental Figure 3A). Guide RNAs designed to target Gabbr1 exon 5, which is shared by all isoforms, generated a nonsense mutation due to a 1-bp adenine insertion (+1 bp [A]; supplemental Figure 3A). Mutants were undersized compared with littermates (supplemental Figure 3B) and had slightly reduced body weight (supplemental Figure 3C). We confirmed loss of Gabbr1 protein by western blot of brain tissue (supplemental Figure 3D). Our Gabbr1-null mutants phenocopied those previously generated on other mutant backgrounds, as confirmed by spontaneous seizures and failure to survive beyond P20 because of neurological defects.16-18
Given specific expression of Gabbr1 in a subset of HSPCs (Figure 1B-C), we analyzed BM and PB of Gabbr1−/− mutants for hematopoietic phenotype. Due to poor survival, analysis was consistently performed at P15. Characterization of LSK progenitors showed moderate but consistent (n = 9) defects in absolute numbers of BM cells of Gabbr1−/− mice (Figure 3A). No significant differences were observed in the long-term HSC (LT-HSC) population and in total BM cellularity (Figure 3A). We analyzed other populations, such as multipotent progenitor (MPP) populations MPP1-3; all showed pronounced decreases in numbers (supplemental Figure 4A). Downstream of LSKs, we observed significant decreases only in percentages and absolute numbers of CLPs (Figure 3B; supplemental Figure 4B). We analyzed BM B-cell developmental stages by Hardy fraction markers30,31 (supplemental Figure 4C) and detected dramatic decreases in abundance of fractions B through E (supplemental Figure 4C; Figure 3E). Consistent with this, PB showed defects in white blood cells (WBCs) and lymphocytes, but not in neutrophils (Figure 3C). Flow cytometry indicated that PB B220+ B cells were significantly reduced, with no differences in CD4+ T cells, CD11b+ and Gr1+ myeloid cells (Figure 3D), or red blood cells and hemoglobin content (supplemental Figure 3E). Platelet counts were moderately decreased (supplemental Figure 3E). This indicates that loss of Gabbr1 affects abundance of LSK progenitors, without significant effects on phenotyped LT-HSCs, and that developmental defects in BM maturation of B-cell lymphocytes are the primary defects in PB.

Gabbr1−/−mutants have decreased numbers of LSK progenitors in BM and lymphocytes in PB. (A) Left panel, Representative flow cytometry gates. Right panels, There are comparable numbers of total BM cells from 2 femur and 2 tibias. The number of LSK progenitors, but not HSCs (LSK/CD48−/CD150+), is reduced in Gabbr1−/− BM (n = 5 WT vs n = 5 mutants). (B) Left panel, Representative flow cytometry gates for CLP. Right panels, The number of Lin−Sca1lowcKitlowCD135highCD127low (CLP) progenitors, but not CMP (Lin−Sca1−cKit+CD34highCD16/32low), is reduced in Gabbr1−/− BM (n = 5 WT vs n = 5 mutants). (C) WBCs and lymphocytes, but not neutrophils, were reduced in Gabbr1−/− PB (n = 5 WT vs n = 5 mutants). (D) Percentages of B220+, but not CD11b+ or Gr-1+, cells were reduced in Gabbr1−/− PB (n = 8 WT vs n = 9 mutants). (E) The analysis of Hardy B-cell fractions in the BM from Gabbr1+/+ and Gabbr1−/− mice (n = 3 WT vs n = 3 mutants). Data are represented as mean plus or minus standard deviation (SD) (*P < .05; **P < .01; ***P < .001). Analyses performed at P15 (see also supplemental Figures 3 and 4).
Gabbr1−/−mutants have decreased numbers of LSK progenitors in BM and lymphocytes in PB. (A) Left panel, Representative flow cytometry gates. Right panels, There are comparable numbers of total BM cells from 2 femur and 2 tibias. The number of LSK progenitors, but not HSCs (LSK/CD48−/CD150+), is reduced in Gabbr1−/− BM (n = 5 WT vs n = 5 mutants). (B) Left panel, Representative flow cytometry gates for CLP. Right panels, The number of Lin−Sca1lowcKitlowCD135highCD127low (CLP) progenitors, but not CMP (Lin−Sca1−cKit+CD34highCD16/32low), is reduced in Gabbr1−/− BM (n = 5 WT vs n = 5 mutants). (C) WBCs and lymphocytes, but not neutrophils, were reduced in Gabbr1−/− PB (n = 5 WT vs n = 5 mutants). (D) Percentages of B220+, but not CD11b+ or Gr-1+, cells were reduced in Gabbr1−/− PB (n = 8 WT vs n = 9 mutants). (E) The analysis of Hardy B-cell fractions in the BM from Gabbr1+/+ and Gabbr1−/− mice (n = 3 WT vs n = 3 mutants). Data are represented as mean plus or minus standard deviation (SD) (*P < .05; **P < .01; ***P < .001). Analyses performed at P15 (see also supplemental Figures 3 and 4).
Because our constitutive whole-body Gabbr1−/− mutants have an early hematopoietic phenotype at P15, we evaluated any hematopoietic development disruption in FL. Timed matings of Gabbr1+/− parents produced viable embryonic day 14.5 (E14.5) embryos with no apparent gross morphological phenotype (data not shown). FL analysis indicated no significant difference in the number of LSK progenitors and LT-HSCs between Gabbr1−/− and Gabbr1+/+ littermates (supplemental Figure 3F). To determine whether the Gabbr1-GABA axis was present in the FL, we performed mass spectrometry to detect GABA ion in whole BM of P15 mice and the FL of E14.5 embryos. We did not detect GABA in the E14.5 FL (supplemental Figure 3G). This reveals a specific BM niche requirement for Gabbr1 not applying to development of HSPCs in FL.
Hematopoietic reconstitution potential is impaired by loss of Gabbr1
Our results suggest that hematopoietic defects in P15 Gabbr1−/− mutants are specific to phenotypic LSK progenitors, but not LT-HSCs (Figure 3A). As mutants are constitutive knockouts, their hematopoietic phenotypes could be due to Gabbr1-dependent BM niche defects. To confirm that the LSK progenitor defect is cell autonomous, and to test functionality of hematopoietic cells that lack Gabbr1 because phenotype does not always recapitulate function of HSPCs,32 we performed direct transplantation of 1 × 10⁶ whole BM cells from Gabbr1+/+ or Gabbr1−/− P15 littermates into lethally irradiated CD45.1+ WT recipient mice in a noncompetitive assay (supplemental Figure 5A diagrammatic representation). Reconstitution was monitored every 4 weeks posttransplant for 3 months. Within the first 4 weeks, a significant defect in total PB reconstitution was observed in the percentage of CD45.2+Gabbr1−/− donor cells (supplemental Figure 5A). However, by 2 months posttransplant, CD45.2+Gabbr1−/− donor cells overcame this initial deficit and fully reconstituted irradiated recipients. This suggests that the phenotype 1 month posttransplant may result from defects in short-term HSCs or progenitors, and recovery of reconstitution could be due to LT-HSCs. Thus, we repeated the transplant experiment, but instead of whole BM, used 350 sorted CD45.2+ LT-HSCs (LSK/CD48−/CD150+) from BM of P15 Gabbr1+/+ or Gabbr1−/− donors, injected along with 5 × 10⁵ CD45.1/2 splenic support cells (supplemental Figure 5B). Again, CD45.1+ recipients transplanted with CD45.2+Gabbr1−/− donor cells showed initial deficit in PB reconstitution but recovered to WT levels by 2 and 3 months after transplant (supplemental Figure 5B). Although this suggested a cell-autonomous role for Gabbr1 in hematopoietic stem and/or progenitor cells, the dynamics of reconstitution by Gabbr1-null cells was still not clear.
We hypothesized that loss of Gabbr1 in a competitive transplant would permanently affect hematopoietic recovery because it would test the fitness and ability of Gabbr1-null LT-HSCs to compete for the same niche with WT LT-HSCs. We transplanted 350 sorted LT-HSCs, harvested from BM of Gabbr1+/+ or Gabbr1−/− littermates, in competition with 350 BM LT-HSCs from a CD45.1/.2 donor, along with CD45.1 splenic support cells (Figure 4A diagrammatic representation). In this competitive setting, defects in Gabbr1−/− PB reconstitution persisted for 3 months, confirming lack of Gabbr1−/− cell fitness (Figure 4B). Interestingly, lineage contributions of transplanted Gabbr1−/− HSCs to PB were reduced in lymphoid, but not myeloid, compartments (supplemental Figure 5C). Numbers of Gabbr1−/− BM CD45.2+ LSK progenitors and LT-HSCs were significantly reduced at 3 months (Figure 4C), as were several progenitor populations (supplemental Figure 5D).
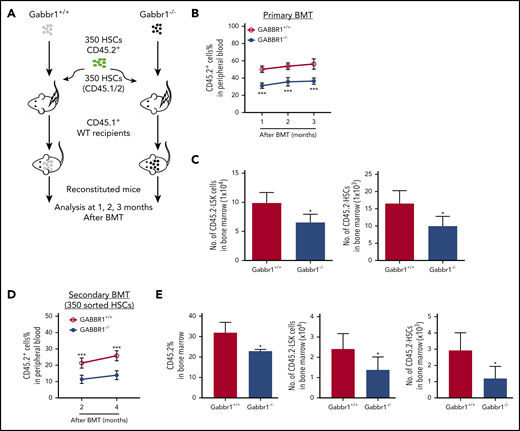
Gabbr1−/−mutant HSCs have reduced engraftment ability in competitive transplants. (A-C) Primary competitive BM transplantation (BMT). (A) Three hundred fifty HSCs from WT and Gabbr1−/− mice were sorted and transplanted into irradiated CD45.1 recipients, together with 350 HSCs from CD45.1/2 mice. (B) Mice were analyzed for reconstitution of PB with donor-derived CD45.2 cells at 1, 2, and 3 months posttransplant. (C) Three months posttransplant, BM CD45.2+ LSK progenitors and HSCs were still reduced (n = 5 recipients per group). (D-E) Secondary transplantation. Three hundred fifty WT or Gabbr1−/− mutant HSCs from primary recipient mice were sorted and transplanted into irradiated CD45.1 recipients, together with 350 sorted HSCs from CD45.1/2 mice. (D) Mice were analyzed for reconstitution of PB with donor-derived CD45.2 cells at 1, 2, and 3 months posttransplant for donor reconstitution. (E) Three months postsecondary transplant, BM CD45.2+ LSK progenitors and HSCs were still reduced (n = 5 recipients per group). Data are presented as mean plus or minus SD. (WT vs Gabbr1−/− mice: *P < .05; **P < .01; ***P < .001) (see also supplemental Figure 5).
Gabbr1−/−mutant HSCs have reduced engraftment ability in competitive transplants. (A-C) Primary competitive BM transplantation (BMT). (A) Three hundred fifty HSCs from WT and Gabbr1−/− mice were sorted and transplanted into irradiated CD45.1 recipients, together with 350 HSCs from CD45.1/2 mice. (B) Mice were analyzed for reconstitution of PB with donor-derived CD45.2 cells at 1, 2, and 3 months posttransplant. (C) Three months posttransplant, BM CD45.2+ LSK progenitors and HSCs were still reduced (n = 5 recipients per group). (D-E) Secondary transplantation. Three hundred fifty WT or Gabbr1−/− mutant HSCs from primary recipient mice were sorted and transplanted into irradiated CD45.1 recipients, together with 350 sorted HSCs from CD45.1/2 mice. (D) Mice were analyzed for reconstitution of PB with donor-derived CD45.2 cells at 1, 2, and 3 months posttransplant for donor reconstitution. (E) Three months postsecondary transplant, BM CD45.2+ LSK progenitors and HSCs were still reduced (n = 5 recipients per group). Data are presented as mean plus or minus SD. (WT vs Gabbr1−/− mice: *P < .05; **P < .01; ***P < .001) (see also supplemental Figure 5).
To determine the extent of the competitive reconstitution defect, we performed secondary transplants with either 1 × 10⁶ whole BM cells harvested from primary competitive recipients (supplemental Figure 5E), or by sorting 350 CD45.2+ LT-HSCs derived from primary recipient BM, and initiating a secondary competition with 350 HSCs from a CD45.1/.2 donor (Figure 4D). In whole BM secondary competitive transplant, the ratio of WT to Gabbr1−/− reconstitution was maintained, demonstrating that these defects were in a self-renewing HSC population (supplemental Figure 5E); terminal analysis revealed dramatic decreases in the percentage of LSK progenitors and LT-HSCs (supplemental Figure 5F). Secondary competitive transplant with 350 sorted Gabbr1−/− LT-HSCs also showed significant defects in reconstitution (Figure 4D). At the terminal 4-month time point, BM analysis of the recipients indicated decreased overall Gabbr1−/− cellularity and significant defects in LSK progenitors and LT-HSC frequency (Figure 4E). In both cases, reconstitution defects persisted up to 4 months after secondary transplants. These results support our hypothesis that there is a cell-autonomous role for GABBR1 in hematopoietic reconstitution, and in HSPC competitive fitness.
Proliferative capacity of the HSPC pool in Gabbr1−/− mutants is reduced
To understand Gabbr1 signaling in HSPCs, we performed cell-cycle and apoptotic assays in phenotypic populations of BM LSK progenitors of WT and Gabbr1−/− P15 littermates. Ki-67 and 7-aminoactinomycin D (7-AAD) counterstaining determined LSK progenitor cell-cycle progression. Flow cytometry for quantification of the LSK cell cycle indicated significant defects in Gabbr1−/− LSKs during cell growth and entry into G1 phase (Figure 5A). However, proapoptotic analysis by annexin V staining or caspase 3 activity of LSK progenitors and HSCs in the BM showed no difference between Gabbr1+/+ and Gabbr1−/− P15 littermates (supplemental Figure 6A-B).

The Gabbr1−/−mutant HSPC pool has reduced proliferative capacity. (A) Cell-cycle analysis. Left panel, Representative flow cytometry gates of cell-cycle analysis by Ki-67 and 7-AAD in LSK progenitors. Right panel, There are more cells in G0 phase in Gabbr1−/− LSK progenitors when compared with Gabbr1+/+ controls (n = 6 per group). (B-C) CFU assays were performed to determine proliferative and differentiative capacity of HSPCs. (B) Absolute numbers of progenitors were determined by plating equal numbers of BM (5 × 10⁴ cells) from WT or Gabbr1−/− tibias. (C) The tritiated thymidine incorporation assay was used to determine the cell-cycling status of BM progenitors. (D) Stimulation with poly(I:C) (10 µg/g) was done by intraperitoneal injection into WT and Gabbr1−/− mice (n = 4 per group). Forty-eight hours later, LSK progenitor number and cell cycle were analyzed. (E) BrdU incorporation assay. BrdU (50 mg/kg) was intraperitoneal injected into WT (n = 6) and Gabbr1−/− mice (n = 5). Forty-eight hours later, percentages of BrdU+ cells in LSK and LSK CD48− progenitor populations were analyzed. (F-I) In vitro B-cell differentiation assay. (F) Experimental design. Four thousand sorted LSK progenitors from WT and Gabbr1−/− mice were seeded onto OP9 cells. After 1 week, cells were passaged onto fresh OP9 cells. At day 14, all cells were collected, counted, and stained with CD45 (G), CD19 (H; left panel), B220 (H; right panel), and CD11b (I) antibodies. The absolute numbers were presented as mean plus or minus SD (data were from 2 independent experiments with 4-5 replicates.). *P < .05; **P < .02; ***P < .001; ****P = 0 vs Gabbr1+/+ controls. Analyses of panels A and D-I performed at P15; panels B and C performed at P13 and P15 (see also supplemental Figure 6).
The Gabbr1−/−mutant HSPC pool has reduced proliferative capacity. (A) Cell-cycle analysis. Left panel, Representative flow cytometry gates of cell-cycle analysis by Ki-67 and 7-AAD in LSK progenitors. Right panel, There are more cells in G0 phase in Gabbr1−/− LSK progenitors when compared with Gabbr1+/+ controls (n = 6 per group). (B-C) CFU assays were performed to determine proliferative and differentiative capacity of HSPCs. (B) Absolute numbers of progenitors were determined by plating equal numbers of BM (5 × 10⁴ cells) from WT or Gabbr1−/− tibias. (C) The tritiated thymidine incorporation assay was used to determine the cell-cycling status of BM progenitors. (D) Stimulation with poly(I:C) (10 µg/g) was done by intraperitoneal injection into WT and Gabbr1−/− mice (n = 4 per group). Forty-eight hours later, LSK progenitor number and cell cycle were analyzed. (E) BrdU incorporation assay. BrdU (50 mg/kg) was intraperitoneal injected into WT (n = 6) and Gabbr1−/− mice (n = 5). Forty-eight hours later, percentages of BrdU+ cells in LSK and LSK CD48− progenitor populations were analyzed. (F-I) In vitro B-cell differentiation assay. (F) Experimental design. Four thousand sorted LSK progenitors from WT and Gabbr1−/− mice were seeded onto OP9 cells. After 1 week, cells were passaged onto fresh OP9 cells. At day 14, all cells were collected, counted, and stained with CD45 (G), CD19 (H; left panel), B220 (H; right panel), and CD11b (I) antibodies. The absolute numbers were presented as mean plus or minus SD (data were from 2 independent experiments with 4-5 replicates.). *P < .05; **P < .02; ***P < .001; ****P = 0 vs Gabbr1+/+ controls. Analyses of panels A and D-I performed at P15; panels B and C performed at P13 and P15 (see also supplemental Figure 6).
Phenotypic analysis of HSPCs confirms their presence, but it does not allow assessment of functional characteristics of these cells (eg, their proliferative and differentiation capacity). For functional progenitor capacities, CFU assays are used. This allows one to determine proliferative capacity, and the percentage of specific progenitor cell types (CFU granulocyte macrophage [CFU-GM], burst-forming unit erythroid [BFU-E], and CFU granulocyte, erythroid, macrophage, megakaryocyte [CFU-GEMM]) in S-phase of the cell cycle (cycling rate) by using a well-established high specific activity tritiated thymidine cell-kill procedure.33-37 We evaluated functional BM progenitors CFU-GM, BFU-E, and CFU-GEMM of Gabbr1+/+ and Gabbr1−/− littermate mice (P13-15). Absolute numbers of BM CFU-GM in Gabbr1−/− mice were significantly decreased compared with Gabbr1+/+ BM (Figure 5B). Almost all Gabbr1−/− progenitors were in a slow or noncycling state (Figure 5C). No differences in size or appearance of colonies were noted.
To understand proliferation defects in Gabbr1−/− mutant HSPCs, we used a bioinformatics approach to find common characteristics among subsets of HSPCs expressing Gabbr1 (Figure 1B). We performed gene-set enrichment analysis38 based on ranked correlation of coexpressed genes from previously published single HSPC RNA-seq data.22 Four of the top 10 gene-ontology annotations that correlated positively with Gabbr1 expression were associated with type I or II interferon signaling (supplemental Figure 7; supplemental Tables 2 and 3). To test in vivo the prediction that Gabbr1 is involved in type I interferon response, a known regulator of HSPC proliferation,39 we treated WT and Gabbr1−/− P15 littermates with an intraperitoneal injection of polyinosinic:polycytidylic acid[poly(I:C)]. BM analysis of WT and Gabbr1−/− littermates 48 hours after poly(I:C) injection indicated significant decreases in numbers of Gabbr1−/− progenitors; Ki-67 and 7-AAD cell-cycle analysis further confirmed a G1-entry defect in Gabbr1−/− progenitors (Figure 5D). Poly(I:C) treatment had no effect on the proapoptotic status of Gabbr1−/− LSK progenitors (supplemental Figure 6C). To determine whether G1-entry defects in LSK progenitors continued to affect Gabbr1−/− mutants during S-phase, we injected 5-bromo-2′-deoxyuridine (BrdU) intraperitoneally in P15 WT and Gabbr1−/− littermates and analyzed BrdU incorporation by flow cytometry in LSK progenitors and long-term HSCs 48 hours later. For both populations, significant decreases in BrdU incorporation were observed (Figure 5E), confirming defects in proliferative capacity of phenotypically defined Gabbr1−/− hematopoietic progenitors and stem cells.
Differentiation of Gabbr1−/− mutant progenitors in vitro reveals proliferation defects in B-cell lineages
To directly test whether loss of Gabbr1 affects overall proliferation of progenitors, or whether it has specific consequences in lineage commitment, we used OP9 stromal cells for lymphoid and myeloid differentiation of sorted BM progenitors. Using previously described OP9 conditions,40 we differentiated 4000 LSK progenitors from P15 Gabbr1−/− or Gabbr1+/+ littermates into myeloid or B-cell lymphoid lineages (Figure 5F). After 2 weeks, overall cellular content and phenotypic analysis of differentiated lineages were conducted. Results indicated decreased overall numbers of CD45+ cells produced by Gabbr1−/− LSK progenitors (Figure 5G), in accordance with in vivo analysis of proliferation defects in the mutants. Furthermore, a significant defect in B-cell lineage development was indicated by reduced CD19+ and B220+ cells originating from Gabbr1−/− mutants (Figure 5H). No defect was detected in the myeloid compartment as indicated by presence of CD11b+ cells (Figure 5I). This was confirmed by repeating differentiation assays and supplementing promyeloid cytokines interleukin-3 and interleukin-6 in our OP9 differentiation media. There was no significant difference in expanded myeloid compartments between WT and Gabbr1−/− mutant progenitors (supplemental Figure 6D). Overall, this supports our in vivo analysis of Gabbr1−/− mutants by confirming defects in progenitor proliferation, and in B-cell differentiation.
B-cell program genes are dysregulated in Gabbr1−/− mutant HSPCs
To better understand molecular phenotypes of Gabbr1−/− mutant HSPCs, we sorted and pooled ∼12 000 LSKs from Gabbr1+/+ or Gabbr1−/− P15 BM for bulk RNA-seq analysis. After initial comparison of differentially expressed genes between WT and mutant LSKs, and Ingenuity Pathway Analysis,41 we observed significant increases in expression of genes associated with B-cell development in mutant LSKs (ratio = 0.33; −log(B-H P value) = 8.69; supplemental Table 4). To further investigate these changes, we used a recently published “blueprint” for B-cell development to generate custom gene sets.42 These sets were associated with progressive stages of in vitro MPP differentiation into B lymphocytes (Figure 6A), or sorted BM populations of phenotypically defined lymphoid-primed MPPs (LMPPs), CLP, and pro-B cells (Figure 6B). Gene signatures from the first and earliest stages of B-lineage differentiation (Figure 6A), or sorted LMPPs (Figure 6B), were significantly enriched in WT HSPCs compared with Gabbr1−/− HSPCs; alternatively, this could be interpreted as downregulation of early progenitor-associated genes in mutant HSPCs. The second stage of B-cell differentiation or “transition”42 is similar to a CLP. This gene signature is mixed, with some representative genes enriched in WT, and some in Gabbr1−/− mutant HSPCs (Figure 6A-B). Later-stage B-cell commitment and pro-B-cell gene signatures42 are very highly enriched in Gabbr1−/− mutant HSPCs (Figure 6A-B). This demonstrates significant shifts in expression profiles of LSK HSPCs from early, progenitor-like signatures to that of committed pro-B cells (Figure 6C), suggesting that Gabbr1 plays a role in differentiation of HSPCs to B-lineage cells.

Gene-signature analysis shows a shift in pooled RNA-seq expression profiles from a progenitor-like state in WT HSPCs to pro–B-cell commitment in Gabbr1−/−mutant HSPCs. Gene signatures are defined by data from Miyai et al,42 and false discovery rate (FDR) of gene-signature enrichment is shown as red bars for WT HSPCs and turquoise bars for Gabbr1−/− mutant HSPCs. (A) Gene signatures from in vitro B-cell differentiation show a progressive shift from early B-lineage markers in WT HSPCs (red text), to a mix of signatures in “transition” stage (green text), and finally to pro–B-cell commitment signatures in Gabbr1−/− mutant HSPCs (blue text). (B) This same pattern is mirrored in the gene signatures of sorted LMPPs, CLPs, and pro-B cells. (C) Diagram showing the shift in expression profiles between WT and Gabbr1−/− mutant HSPCs.
Gene-signature analysis shows a shift in pooled RNA-seq expression profiles from a progenitor-like state in WT HSPCs to pro–B-cell commitment in Gabbr1−/−mutant HSPCs. Gene signatures are defined by data from Miyai et al,42 and false discovery rate (FDR) of gene-signature enrichment is shown as red bars for WT HSPCs and turquoise bars for Gabbr1−/− mutant HSPCs. (A) Gene signatures from in vitro B-cell differentiation show a progressive shift from early B-lineage markers in WT HSPCs (red text), to a mix of signatures in “transition” stage (green text), and finally to pro–B-cell commitment signatures in Gabbr1−/− mutant HSPCs (blue text). (B) This same pattern is mirrored in the gene signatures of sorted LMPPs, CLPs, and pro-B cells. (C) Diagram showing the shift in expression profiles between WT and Gabbr1−/− mutant HSPCs.
Brief treatment with GABBR1 agonist increases long-term engraftment of human UCB HSPCs
Findings from our mouse model indicated a role for the Gabbr1 neuroreceptor in 2 aspects of hematopoiesis: proliferation of HSPCs and differentiation of B-lineage cells. To evaluate functional conservation of Gabbr1 in hematopoiesis, and translational potential of GABA signaling for HSPCs, we exposed CD34+ UCB cells for 2 hours in vitro with increasing doses of either baclofen, a clinically approved GABA agonist,43 or 2-hydroxy-saclofen, a selective antagonist of GABA B receptor.44 After treatment, cells were injected IV into sublethally irradiated NOD-scid.Il2rgnull (NSG) recipients, and xenograft outcome was assayed 16 weeks later. Treatment with 10 μM baclofen showed dramatic enhancement over vehicle control in engraftment of hCD45+ cells in NSG recipients (Figure 7A). At 16 weeks, total human blood CD45+ (Figure 7B) and progenitor-specific CD34+ (Figure 7C) BM engraftment in NSG mice exhibited a trend to increase after agonist treatment, and a significant improvement after 10 μM baclofen. 2-hydroxy-saclofen treatment did not significantly increase engraftment at any of the tested doses. Further lineage analysis of BM chimerism in vehicle control and 10 μM baclofen treatment revealed significant increases in overall engraftment (CD45+), and in progenitor engraftment (CD34+ and CD38+; Figure 7D). In the spleen of transplanted NSG mice, this pattern persisted with significant increases in overall engraftment, and a near twofold enhancement in CD19+ B-cell reconstitution (Figure 7E). At 16 weeks posttransplantation, CFU assays indicated that progenitor colonies in the BM derived from NSG mice transplanted with baclofen-treated CD34+ UCB cells were threefold higher than controls (supplemental Figure 8B). Interestingly, CD34+ UCB cells analyzed for in vitro CFUs after a 2-hour treatment, baclofen did not produce increased colonies, suggesting that conditions in vivo are required for a sustained increase in progenitor numbers (supplemental Figure 8A). This supports our conclusions that Gabbr1-mediated HSPC signaling promotes engraftment, reconstitution potential, and differentiation of the B-cell lineage.
![The GABBR1 agonist baclofen increases long-term engraftment of human UCB HSPCs. (A) Representative flow cytometry analysis of immunodeficient mouse BM 16 weeks after transplantation with human UCB HSPCs after treatment with vehicle (left) or GABBR1 agonist baclofen (right). Results show percentage engraftment of human CD45+ cells (hCD45). (B-C) Dose-dependent engraftment of human hematopoietic CD45+ cells (A), and CD34+ HSPCs (B). Compared with vehicle controls, the most effective dose is 10 μM baclofen. The GABBR1 antagonist 2-hydroxy-saclofen does not significantly increase engraftment. (D-E) Comparison of engraftment percentage of various hematopoietic populations in BM (D), and spleen (E), at the optimal dose of 10 μM baclofen (red) compared with vehicle control (blue) (n = 5 per group; Student t test; *P < .05; mean = standard error of the mean [SEM]) (see also supplemental Figure 8). Bac, baclofen; Sac, 2-hydroxy-saclofen; SSC-A, side scatter area.](https://ash.silverchair-cdn.com/ash/content_public/journal/blood/137/6/10.1182_blood.2019004415/4/m_bloodbld2019004415f7.png?Expires=1770558571&Signature=ZFBZS6o3eC1cuTFEtZd0kpAdp9r-Ol2K~jw8kRTJhQUSw3c-Ig5wnBAFyAgKClIO4yTgvFoCxroCWlHFsg8iqwwMOI5-BN2PrV8YcfPRyjg2ciY75Gr8luKaV6NTe1g2SWE0guZH0IWZ1sO8U0IrE6SmOj7t0GBwGGFcmYZdmmpnVklXll6INBb1iszznCpIaKB7-3U-4OwloLGU6tgfNcqXLdBKvEHTTfW2YHETmrpNDlINi8E~R3MbCZDRm-TQWSVj9EublWtVkYqRZ4x895hdyrCz62Nruo9ZvI5uKn5dLza6SVDSkaFNv0x1yCC4axDv8F82cx9JOXKhVpiYkg__&Key-Pair-Id=APKAIE5G5CRDK6RD3PGA)
The GABBR1 agonist baclofen increases long-term engraftment of human UCB HSPCs. (A) Representative flow cytometry analysis of immunodeficient mouse BM 16 weeks after transplantation with human UCB HSPCs after treatment with vehicle (left) or GABBR1 agonist baclofen (right). Results show percentage engraftment of human CD45+ cells (hCD45). (B-C) Dose-dependent engraftment of human hematopoietic CD45+ cells (A), and CD34+ HSPCs (B). Compared with vehicle controls, the most effective dose is 10 μM baclofen. The GABBR1 antagonist 2-hydroxy-saclofen does not significantly increase engraftment. (D-E) Comparison of engraftment percentage of various hematopoietic populations in BM (D), and spleen (E), at the optimal dose of 10 μM baclofen (red) compared with vehicle control (blue) (n = 5 per group; Student t test; *P < .05; mean = standard error of the mean [SEM]) (see also supplemental Figure 8). Bac, baclofen; Sac, 2-hydroxy-saclofen; SSC-A, side scatter area.
The GABBR1 agonist baclofen increases long-term engraftment of human UCB HSPCs. (A) Representative flow cytometry analysis of immunodeficient mouse BM 16 weeks after transplantation with human UCB HSPCs after treatment with vehicle (left) or GABBR1 agonist baclofen (right). Results show percentage engraftment of human CD45+ cells (hCD45). (B-C) Dose-dependent engraftment of human hematopoietic CD45+ cells (A), and CD34+ HSPCs (B). Compared with vehicle controls, the most effective dose is 10 μM baclofen. The GABBR1 antagonist 2-hydroxy-saclofen does not significantly increase engraftment. (D-E) Comparison of engraftment percentage of various hematopoietic populations in BM (D), and spleen (E), at the optimal dose of 10 μM baclofen (red) compared with vehicle control (blue) (n = 5 per group; Student t test; *P < .05; mean = standard error of the mean [SEM]) (see also supplemental Figure 8). Bac, baclofen; Sac, 2-hydroxy-saclofen; SSC-A, side scatter area.
Discussion
It has been known that human HSPCs express neurotransmitter receptors. However, their function in vivo has remained enigmatic. We studied the role of GABA B type receptor Gabbr1, expressed in a subset of HSPCs, in a loss-of-function mouse model. In steady state, Gabbr1−/− mutants have reduced MPP and LSK progenitors, as well as WBCs, lymphocytes, and B cells. This specific role for Gabbr1 in B-cell development was further highlighted by custom gene-signature analysis.42 Although we were directly comparing the expression profiles of phenotypic LSK progenitors isolated from WT and Gabbr1−/− mutants, we observed a significant change from the expected MPP gene signature, indicating a dysregulation of B-cell differentiation in HSPCs. Analysis of developing B cells in the BM (Hardy fractions) showed dramatic reduction in B-cell maturation. This specific defect in B-lineage potential was confirmed by in vitro differentiation of Gabbr1−/− mutant LSK progenitors. We showed a premature transcriptional B-cell program in Gabbr1−/− HSPCs, which, when combined with a pronounced defect starting as early as Hardy fraction B, suggest that loss of Gabbr1 signaling causes loss of immature B cells in the BM. Decreases in peripheral WBCs and B cells likely result from removal of highly autoreactive B cells during the pre–B-cell receptor central tolerance checkpoint.45
Transplanted HSPCs from Gabbr1−/− mutants had reduced proliferative capacity and competed poorly against WT HSPCs in a competitive transplant setting. Gene-set enrichment analysis found that the single-cell expression profile of Gabbr1-expressing HSPCs (ie, the gene set that positively correlated with Gabbr1 expression) was enriched for interferon pathway genes. Consistent with this finding, HSPC proliferation was reduced in Gabbr1−/− mutants after poly(I:C) treatment, suggesting a defective type I interferon response. Conversely, a brief ex vivo treatment of human UCB CD34+ cells with clinically approved GABA agonist, baclofen, enhanced engraftment and reconstitution of hematopoiesis in xenotransplant models.
A decrease in HSPC proliferation and function along with early defects in B-cell development indicate a unique, lineage-specific role for Gabbr1 signaling in the BM niche. IMS analysis indicated that GABA was present in the endosteal region of the BM. To better identify the cells responsible for production of GABA in the BM, we analyzed several cell types for the expression of GAD1, the enzyme required for GABA production. We showed messenger RNA and protein expression levels of GAD1 to be high in B cells. In the context of the phenotype of Gabbr1−/− mice, this indicates an intricate connection between GABA production by BM B cells with proliferation and differentiation of HSPCs. Because CLP and immature B-cell compartments are severely affected by Gabbr1 loss, this suggests a possible instructive feedback loop of GABA-Gabbr1 signaling in early B-lymphoid development.
Overall, there is still little known about GABA signaling in hematopoiesis and multilineage differentiation. Recently, a GABA A type receptor Rho 1 subunit GABRR1 was found to be expressed in HSCs and megakaryocyte progenitors,19 and played a conserved role in platelet production. Taken together with our current study, there appears to be a complex role for GABA signaling in multiple hematopoietic lineages that act via different receptors, with GABA A type receptor Rho 1 subunit GABRR1 regulating megakaryocyte progenitors, and GABA B type receptor GABBR1 regulating HSPC numbers and B-cell differentiation. Studies in Drosophila and bony fish showed that GABA signaling regulates hematopoietic progenitors, suggesting an ancient and deeply conserved role in hematopoiesis.46,47 Interestingly, genome-wide association studies have identified a rare variant in the GABBR1 locus that produces a change in WBC and lymphocyte counts.48,49 Although further mechanistic investigation is required to fully determine the role of neurotransmitter signaling in BM HSPC populations, our ex vivo findings suggest a potential direct translational application for activation of GABA signaling in enhancing engraftment during clinical transplant.
The data reported in this article have been deposited in the Gene Expression Omnibus database (accession number GSE157352).
For original data or reagents, please contact tamplin@wisc.edu or kvp@uic.edu.
The online version of this article contains a data supplement.
The publication costs of this article were defrayed in part by page charge payment. Therefore, and solely to indicate this fact, this article is hereby marked “advertisement” in accordance with 18 USC section 1734.
Acknowledgments
The authors thank Linda Degenstein and the Transgenic Mouse and Embryonic Stem Cell Facility at the University of Chicago for generation of the mouse model, Maureen Regan and Brad Merrill of the University of Illinois at Chicago Genome Editing Core for CRISPR/Cas9 design and reagents, Wendy Shao and Balaji Ganesh of the University of Illinois at Chicago Flow Cytometry Core for cell sorting, Katherine Gruner and Marc Deheeger of the Mouse Histology and Phenotyping Laboratory at Northwestern University for histology, Cece Countryman and Zarema Arbieva at the University of Illinois at Chicago Core Genomics Facility for sequencing, Haley Engle and Sweta Soni for maintaining the mouse colony, and Melissa Trowbridge and Kathy Coy at Indiana University for their expert technical assistance with xenotransplant studies.
RNA-seq data analysis was performed by Pinal Kanabar and Mark Maienschein-Cline at the UIC Research Informatics Core, supported in part by the National Institutes of Health (NIH) National Center for Advancing Translational Sciences through grant UL1TR002003. Xenotransplants were conducted by core facilities funded through the Cooperative Centers of Excellence in Hematology (NIH National Institute of Diabetes and Digestive and Kidney Diseases U54DK106846) and the Indiana University Simon Comprehensive Cancer Center (NIH National Cancer Institute P30 CA082709). Research reported in this publication was supported by: the NIH National Heart, Lung, and Blood Institute (R01HL142998 [O.J.T.], R01HL134971 [K.V.P.], R35HL139599 [H.E.B.]), the NIH National Institute of Diabetes and Digestive and Kidney Diseases (K01DK103908 [O.J.T.], R01DK109188 [H.E.B.], U54DK106846 [K.E.P. and H.E.B.), the NIH National Cancer Institute (F31CA236237 [K.E.Z.]), the NIH National Institute of General Medical Sciences (R01GM125943 [L.M.S.]), and an American Society of Hematology (ASH) Junior Faculty Scholar Award (O.J.T.). Funding was also provided by the Chicago Biomedical Consortium Catalyst Grant with support from the Searle Funds at The Chicago Community Trust (C-076 [L.M.S.]) and University of Illinois at Chicago Startup Funds (L.M.S., O.J.T., K.V.P.). B.J.C. was supported by a Tier II Canada Research Chair.
Authorship
Contribution: K.V.P. and O.J.T. conceptualized the study; K.E.P., A.L.S., B.J.B., E.C.S., S.H.C., H.E.B., K.V.P., and O.J.T. developed the study methodology; L.S., A.E.-B., K.E.Z., K.E.P., A.L.S., and E.C.S. validated the study and conducted investigations; L.S., A.E.-B., K.E.Z., B.J.C., K.E.P., A.L.S., B.J.B., and E.C.S. provided formal analysis; K.V.P., L.S., and A.E.-B. prepared and wrote the original draft; K.V.P., O.J.T., K.E.P., and H.E.B. prepared, reviewed, and edited the manuscript; L.S., K.E.Z., E.C.S., and O.J.T. prepared and visualized the study; K.E.P., L.M.S., H.E.B., K.V.P., and O.J.T. supervised the study; and L.M.S., H.E.B., K.V.P., and O.J.T. acquired funding.
Conflict-of-interest disclosure: The authors declare no competing financial interests.
Correspondence: Kostandin V. Pajcini, Department of Pharmacology, University of Illinois at Chicago, 909 S. Wolcott Ave, Chicago, IL 60612; e-mail: kvp@uic.edu; and Owen J. Tamplin, Department of Cell and Regenerative Biology, School of Medicine and Public Health, University of Wisconsin-Madison, 1111 Highland Ave, Madison, WI 53705; e-mail: tamplin@wisc.edu.

This feature is available to Subscribers Only
Sign In or Create an Account Close Modal