

Key Points
Evidence from unbiased screens shows that very long chain fatty acid metabolism is critical to AML cell survival.
Genetic knockdown or inhibition of VLCAD leads to selective AML cell death, highlighting a unique AML-specific metabolic vulnerability.

Abstract
Acute myeloid leukemia (AML) cells have an atypical metabolic phenotype characterized by increased mitochondrial mass, as well as a greater reliance on oxidative phosphorylation and fatty acid oxidation (FAO) for survival. To exploit this altered metabolism, we assessed publicly available databases to identify FAO enzyme overexpression. Very long chain acyl-CoA dehydrogenase (VLCAD; ACADVL) was found to be overexpressed and critical to leukemia cell mitochondrial metabolism. Genetic attenuation or pharmacological inhibition of VLCAD hindered mitochondrial respiration and FAO contribution to the tricarboxylic acid cycle, resulting in decreased viability, proliferation, clonogenic growth, and AML cell engraftment. Suppression of FAO at VLCAD triggered an increase in pyruvate dehydrogenase activity that was insufficient to increase glycolysis but resulted in adenosine triphosphate depletion and AML cell death, with no effect on normal hematopoietic cells. Together, these results demonstrate the importance of VLCAD in AML cell biology and highlight a novel metabolic vulnerability for this devastating disease.
Introduction
Acute myeloid leukemia (AML) is a malignant hematological disease characterized by poor patient outcomes and limited chemotherapy options. Mitochondrial phenotypes of leukemia and leukemia stem cells (LSCs) have distinguishing features that separate them from normal hematopoietic stem cells (HSCs).1-3 This altered phenotype is characterized by increased mitochondrial mass1 as well as modified metabolic features such as a greater reliance on oxidative phosphorylation (OXPHOS)1,2 and fatty acid oxidation (FAO)3 for survival. Unlike normal HSCs, LSCs are less able to compensate for added metabolic4,5 or oxidative stress,6 which further defines the mitochondria as a vulnerable target that is essential for AML and LSC survival. As such, drug-induced perturbations of mitochondrial activity through the inhibition of mitochondrial protein synthesis,1 OXPHOS,4,6 or FAO2,3,7 can induce or sensitize leukemia and LSCs to death. Given that compounds targeting these pathways and other metabolic perturbations in AML are being evaluated in human clinical trials,8 targeting mitochondria and altering leukemia cell metabolism is an attractive approach to AML therapy.
Mitochondrial FAO is the primary catabolic pathway for lipids <18 carbons in length.9 FAO supports leukemia cell survival by generating reductive equivalents (ie, NADH and FADH2) for the electron transport chain (ETC), providing acetyl-CoA to the tricarboxylic acid (TCA) cycle,3 preventing accumulation of cytosolic palmitate, and indirectly contributing to the cytosolic antioxidant pool (through NADPH).3 Pharmacological inhibition of FAO results in antileukemia activity; however, seminal studies using etomoxir (ETO; 50% effective concentration >100 µM), which blocks fatty acid entry into mitochondria by inhibiting carnitine palmitoyltransferase I (CPT1), only sensitized leukemia cells to cytarabine-induced apoptosis.3 ETO’s hepatotoxicity prevented further clinical use,10 and only a few FAO inhibitors are clinically available; they are limited by their unique tissue specificity and unknown mechanism of activity.11-16 Together, this highlights the role of FAO in AML and the need to better understand how FAO impacts AML cell metabolism.
To better understand the role of FAO in AML cell survival, we first compared gene expression profiles between normal and leukemia patient populations and found that ACADVL, the gene encoding very long chain acyl-CoA dehydrogenase (VLCAD), was elevated. We next showed that VLCAD is an enzyme that is critical to leukemia cell FAO, survival, and engraftment in vitro and in vivo. Genetic or pharmacological inhibition of VLCAD inhibited long chain FAO, the contribution of fat-derived carbons into the TCA cycle, and downstream OXPHOS. This triggered an insufficient compensatory shift in energy metabolism, ultimately resulting in selective AML cell death while sparing normal cells. Thus, we highlight a novel role for VLCAD in AML and validated a metabolic vulnerability in AML.
Materials and methods
Cell culture
TLS-ERG immortalized (TEX) leukemia cells were maintained in Iscove's Modified Dulbecco medium (IMDM), 15% fetal bovine serum, 2 mM l-glutamine, 2% penicillin-streptomycin, 20 ng/mL stem cell factor, and 2 ng/mL interleukin-3.17,18 OCI-AML2 (AML2) leukemia cells were maintained in IMDM, 10% fetal bovine serum, and 2% penicillin-streptomycin. Cells were cultured in 5% CO2 at 37°C and passaged up to 25 times. The sources for human AML and normal samples are detailed in supplemental Methods (available on the Blood Web site); AML patient cytogenetic profiles are detailed in supplemental Figure 10.
Cell growth and viability
Cell growth and viability and clonogenic growth were carried out as previously described; 7-aminoactinomycin D was used on a Guava EasyCyte 8HT flow cytometer.19 For rescue experiments, sodium heptanoate (TCI America) was solubilized, according to the manufacturer’s instructions.
Database profiling
Data sets (GSE9476, GSE13204, and GSE1159) were downloaded from the National Center for Biotechnology Information’s Gene Expression Omnibus (https://www.ncbi.nlm.nih.gov/geo/) and separated into 2 groups: normal healthy bone marrow (BM) and AML patient groups. ACADVL expression between normal healthy BM and AML patient groups were compared with a 2-tailed, unpaired Student t test in GraphPad Prism 7.0. All non-AML patient samples were excluded from the analysis.
Coimmunoprecipitation experiments
Coimmunoprecipitation (co-IP) of VLCAD was conducted using the Crosslink Magnetic Co-IP Kit (Pierce) and an anti-VLCAD antibody for co-IP (NBP2-15238; Novus Biologicals); subsequent quantification of avocadyne (AYNE) was carried out using our published method.20
Immunoblotting
Total cell lysates were prepared as described previously19 and detailed in supplemental Methods.
High-resolution respirometry
Oxygen flux was measured using a high-resolution respirometer (Oxygraph-O2k; Oroboros Instruments), with all protocols detailed in supplemental Methods. Intact cell respiration was measured as previously described21 ; fat-supported electron transfer flavoprotein (ETF) respiration with FAO substrates was assessed as previously described22 ; Complex I and II–supported respiration was assessed as previously described.23
FAO by liquid scintillation counting
FAO activity in leukemia cell lines was determined as previously described,24 with slight modification, for suspension cell lines and as detailed in supplemental Methods.
Acyl-CoA dehydrogenase activity assay
Acyl-CoA dehydrogenase (ACAD) activity was assessed as previously described25 and detailed in supplemental Methods.
RNA interference knockdown
Lentiviral transductions were performed as described19 and detailed in supplemental Methods.
Acylcarnitine profiling
Acylcarnitine (AC) profiling was carried out as previously described26 and detailed in supplemental Methods.
ATP, PDH activity, and mitochondrial mass quantification
Adenosine triphosphate (ATP; Sigma), pyruvate dehydrogenase (PDH) activity (Sigma), and mitochondrial mass (MitoTracker; Thermo Fisher) were quantified using kits and following the manufacturer’s instructions, with no deviations. Cells were supplied with 200 µM palmitic acid: bovine serum albumin (PA:BSA) and 400 µM l-carnitine for 3 hours prior to ATP and PDH quantification. Primary AML and mononuclear cells (MNCs) were treated with AYNE for 12 hours prior to ATP quantification.
UHPLC–mass spectrometry analysis of FAO, glycolysis, and TCA metabolites
TEX cells, AML2 cells, primary AML cells, or normal MNCs (2.5 × 10⁵ cells per milliliter) were treated with a solvent vehicle, AYNE, or ETO and incubated with stable 13C isotope substrates, including uniformly labeled 13C16 palmitate or uniformly labeled 13C6 glucose (both from Cambridge Isotopes), for 12 hours. Cells were then collected, counted, washed 3 times in phosphate-buffered saline, and frozen at −82°C until ultra high performance liquid chromatography (UHPLC) analysis. Additional details can be found in supplemental Methods. Cells were extracted in methanol/acetonitrile/water (5:3:2 volume-to-volume-to-volume ratio [%]) prior to UHPLC–mass spectrometry (MS) analyses (Vanquish-Q Exactive; Thermo Fisher), as described previously.27 Peak areas and isotopologue deconvolution were determined as described.27
In vivo models
Nonobese diabetic severe combined immunodeficiency γ (NSG) mice (The Jackson Laboratory, Bar Harbor, ME or Western University, London, ON) were used for xenograft and engraftment assays as previously described7,28 and detailed in supplemental Methods.
Cellular thermal shift assay
Assessment of VLCAD/drug binding was performed using a previously published protocol29 as detailed in supplemental Methods.
Statistical analysis
Unless otherwise stated, in vitro results are presented as mean ± standard deviation, whereas in vivo results are presented as mean ± standard error of the mean. Data were analyzed with GraphPad Prism 7.0 (GraphPad Software) using 1-way analysis of variance (ANOVA) with Tukey’s post hoc analysis for between-group comparisons or standard Student t tests where appropriate; Mann-Whitney U tests were used for animal experiments. P values <.05 were considered statistically significant.
Results
VLCAD is identified as a potential anti-AML target
Pharmacological inhibition of CD36 or CPT1 targeted AML mitochondrial metabolism and resensitized previously resistant cells to current induction chemotherapy.2,3,5 Given this importance of FAO in leukemia survival and relapse, we profiled levels of intramitochondrial enzymes9 associated with the carnitine shuttle; long, medium, and short chain FAO; and ACAD electron transfer in normal healthy BM and AML populations from publicly available databases (Figure 1A; supplemental Figure 1A). Across GSE9476, GSE13204, and GSE1159, the gene most consistently overexpressed among FAO enzymes in the AML patient vs normal healthy BM population was ACADVL, the gene encoding VLCAD, the enzyme catalyzing the first of the 4 steps in the intramitochondrial long chain FAO cycle (Figure 1B; supplemental Figure 1B). When expression was stratified, ACADVL was overexpressed in 8 of 12 quartiles (Figure 1C; supplemental Figure 1C). We next assessed VLCAD protein levels in patient-derived AML cells and normal mononuclear (MNC) samples and found that VLCAD levels were only elevated in AML cells (Figure 1D). Taken together, VLCAD is a previously unexplored intramitochondrial FAO enzyme that is overexpressed in the AML patient population.
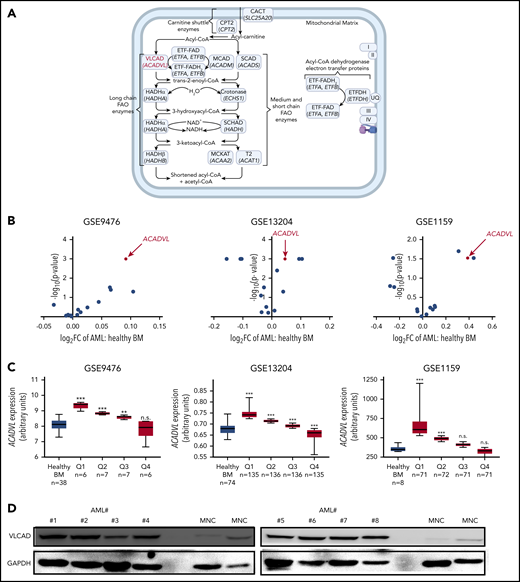
ACADVL is overexpressed in human AML. (A) Schematic diagram of the FAO pathway highlighting enzymes associated with the carnitine shuttle; long, medium, and short chain FAO; and ACAD electron transfer with the protein VLCAD, coded by the gene ACADVL (in red). Enzyme names are in roman type; corresponding gene names (beneath the protein name) are italicized. Each enzyme’s full name, short form name, and encoding gene are shown in supplemental Figure 1A. UQ, I, II, III, and IV are abbreviations for ubiquinone and complexes 1, 2, 3, and 4 of the ETC. Created using BioRender. (B) Volcano plots comparing the fold change in the expression of various intramitochondrial FAO genes between AML patient and healthy BM populations in the GSE9476, GSE13204, and GSE1159 data sets. (C) ACADVL gene overexpression between AML patient and healthy BM populations in GSE9476, GSE13204, and GSE1159. AML populations were stratified into quartiles, labeled Q1 through Q4. In (B) and (C), comparisons between genes are presented as a scatter plot with the x-axis as log2 of the fold change and the y-axis as a negative log10 of the P value for AML vs healthy BM populations. (D) Immunoblot showing VLCAD protein levels across patient-derived AML cells (#1-#8, where the number after # denotes the patient ID), isolated from peripheral blood, and normal MNCs. Patient cytogenetics are in supplemental Figure 10. **P ≤ .002, ***P ≤ .001, 2-tailed unpaired Student t test. n.s., not significant.
ACADVL is overexpressed in human AML. (A) Schematic diagram of the FAO pathway highlighting enzymes associated with the carnitine shuttle; long, medium, and short chain FAO; and ACAD electron transfer with the protein VLCAD, coded by the gene ACADVL (in red). Enzyme names are in roman type; corresponding gene names (beneath the protein name) are italicized. Each enzyme’s full name, short form name, and encoding gene are shown in supplemental Figure 1A. UQ, I, II, III, and IV are abbreviations for ubiquinone and complexes 1, 2, 3, and 4 of the ETC. Created using BioRender. (B) Volcano plots comparing the fold change in the expression of various intramitochondrial FAO genes between AML patient and healthy BM populations in the GSE9476, GSE13204, and GSE1159 data sets. (C) ACADVL gene overexpression between AML patient and healthy BM populations in GSE9476, GSE13204, and GSE1159. AML populations were stratified into quartiles, labeled Q1 through Q4. In (B) and (C), comparisons between genes are presented as a scatter plot with the x-axis as log2 of the fold change and the y-axis as a negative log10 of the P value for AML vs healthy BM populations. (D) Immunoblot showing VLCAD protein levels across patient-derived AML cells (#1-#8, where the number after # denotes the patient ID), isolated from peripheral blood, and normal MNCs. Patient cytogenetics are in supplemental Figure 10. **P ≤ .002, ***P ≤ .001, 2-tailed unpaired Student t test. n.s., not significant.
VLCAD is critical to AML cell proliferation and metabolism
Lentiviral-mediated short hairpin RNA knockdown of VLCAD protein was achieved in the AML cell lines TEX [F(2,8) = 75.16; P < .001; VLCAD knockdown lines are denoted TEX D6 and TEX D8; Figure 2A-2B] and AML2 (supplemental Figure 2A-B). A near-complete VLCAD knockdown significantly reduced leukemia cell proliferation [day 3: F(2,5) = 121.1; P = .0014; day 5: F(2,5) = 480.2; P = .0002; Figure 2C; AML2 cells, supplemental Figure 2C] and clonogenic growth [F(2,11) = 89.68; P < .001; Figure 2D; AML2 cells, supplemental Figure 2D].
![Knockdown of VLCAD decreases leukemic proliferation, clonogenic growth, and intact cellular and palmitate (C16)-supported ETF respiration. (A) Western blot showing knockdown of VLCAD in TEX cells, where D6 and D8 are knockdown constructs. (B) Densitometry of VLCAD knockdown in TEX cells. Proliferation counts after 1, 3, and 5 days (C) and colony count after 2 weeks (D) for TEX wild-type and VLCAD-knockdown cells. (E) Representative oxygraph quantifying basal and maximal respiration of intact leukemia cells (left panel). In brief, following injection into the high-resolution respirometer, cells demonstrate a basal rate of respiration. ATP synthesis is uncoupled by addition of oligomycin (OLI). Maximal respiration is stimulated with an injection of a chemical uncoupler (FCCP) and pyruvate (PYR). All mitochondrial respiration is inhibited by addition of antimycin A (ANTIA). Intact cell basal and maximal respiration of TEX wild-type and VLCAD knockdown cells (right panel). (F) Schematic diagram showing the flow of electrons following the oxidation of fats of different carbon lengths to support respiration of the ETC. Electrons supplied by VLCAD (for very long fats; 14-18 carbons long), medium chain acyl-CoA dehydrogenase (MCAD; for medium-length fats; 6-12 carbons long), and short chain acyl-CoA dehydrogenase (SCAD; for short-length fats; 4 carbons long) reduce the FAD cofactor attached to the ETF (ETF-FAD). Reduced ETF-FADH2 is oxidized by ETF dehydrogenase (ETFDH), passing electrons to ubiquinone (UQ) and then complex III (III). Malonate (MALON) and rotenone (ROT) inhibit electron flow from complexes I (I) and II (II), respectively; residual oxygen flux measured by the respirometer is exclusively ETF supported respiration, an indirect measure of VLCAD activity when palmitate is supplied. (G) Representative oxygraph quantifying C16-supported ETF respiration (left panel). In brief, permeabilized cells are injected into the respirometer. C16 in the form of palmitoyl-carnitine (PC), malate (MAL), and adenosine diphosphate (ADP) stimulate C16-supported FAO respiration. MALON and ROT inhibit any contribution of electrons from complexes I and II, allowing ETF respiration to be exclusively assessed. C16-supported (middle panel) and C8-supported (right panel) ETF respiration of TEX wild-type and VLCAD-knockdown cells. Data in (B-D, E [right panel] and G [middle and right panels]) are mean ± standard deviation. Panel F created in Biorender. *P ≤ .05, **P ≤ .002, ***P ≤ .001, 1-way ANOVA with Tukey’s post-hoc test.](https://ash.silverchair-cdn.com/ash/content_public/journal/blood/137/25/10.1182_blood.2020008551/1/m_bloodbld2020008551f2.png?Expires=1769080735&Signature=MNHVThkH~C0JW~eQfayix3k5mpop18hdJt4FJ25lDfBHX~DHk4C7LvM9Fv6-O7syMP8vP82kKk6tUdcFG4oVspISEhyuwA-mY7o4p7r~Q5Yd8ETwD~itKO5~TvGHUpVKNtR6TOxn6wB2IO7LrTneOoRk26G8QHzaL3KCDnrL5l0Yk~t~lmjNwVdo8AgiZzYpLba1Ppub46RGdMVa1~rXdssz8mZcGoqe0HEoJsZHFxqaDWZL8LAxqzd5JhvkxlhO6Y5ZfF8krKVr9mDfBW1w0MeudYIWKghdvt~86tbYCVBRQ982YQKkufhYo9iRc6ZxdUrQDOncUoMC6tBhoB4Gqg__&Key-Pair-Id=APKAIE5G5CRDK6RD3PGA)
Knockdown of VLCAD decreases leukemic proliferation, clonogenic growth, and intact cellular and palmitate (C16)-supported ETF respiration. (A) Western blot showing knockdown of VLCAD in TEX cells, where D6 and D8 are knockdown constructs. (B) Densitometry of VLCAD knockdown in TEX cells. Proliferation counts after 1, 3, and 5 days (C) and colony count after 2 weeks (D) for TEX wild-type and VLCAD-knockdown cells. (E) Representative oxygraph quantifying basal and maximal respiration of intact leukemia cells (left panel). In brief, following injection into the high-resolution respirometer, cells demonstrate a basal rate of respiration. ATP synthesis is uncoupled by addition of oligomycin (OLI). Maximal respiration is stimulated with an injection of a chemical uncoupler (FCCP) and pyruvate (PYR). All mitochondrial respiration is inhibited by addition of antimycin A (ANTIA). Intact cell basal and maximal respiration of TEX wild-type and VLCAD knockdown cells (right panel). (F) Schematic diagram showing the flow of electrons following the oxidation of fats of different carbon lengths to support respiration of the ETC. Electrons supplied by VLCAD (for very long fats; 14-18 carbons long), medium chain acyl-CoA dehydrogenase (MCAD; for medium-length fats; 6-12 carbons long), and short chain acyl-CoA dehydrogenase (SCAD; for short-length fats; 4 carbons long) reduce the FAD cofactor attached to the ETF (ETF-FAD). Reduced ETF-FADH2 is oxidized by ETF dehydrogenase (ETFDH), passing electrons to ubiquinone (UQ) and then complex III (III). Malonate (MALON) and rotenone (ROT) inhibit electron flow from complexes I (I) and II (II), respectively; residual oxygen flux measured by the respirometer is exclusively ETF supported respiration, an indirect measure of VLCAD activity when palmitate is supplied. (G) Representative oxygraph quantifying C16-supported ETF respiration (left panel). In brief, permeabilized cells are injected into the respirometer. C16 in the form of palmitoyl-carnitine (PC), malate (MAL), and adenosine diphosphate (ADP) stimulate C16-supported FAO respiration. MALON and ROT inhibit any contribution of electrons from complexes I and II, allowing ETF respiration to be exclusively assessed. C16-supported (middle panel) and C8-supported (right panel) ETF respiration of TEX wild-type and VLCAD-knockdown cells. Data in (B-D, E [right panel] and G [middle and right panels]) are mean ± standard deviation. Panel F created in Biorender. *P ≤ .05, **P ≤ .002, ***P ≤ .001, 1-way ANOVA with Tukey’s post-hoc test.
Knockdown of VLCAD decreases leukemic proliferation, clonogenic growth, and intact cellular and palmitate (C16)-supported ETF respiration. (A) Western blot showing knockdown of VLCAD in TEX cells, where D6 and D8 are knockdown constructs. (B) Densitometry of VLCAD knockdown in TEX cells. Proliferation counts after 1, 3, and 5 days (C) and colony count after 2 weeks (D) for TEX wild-type and VLCAD-knockdown cells. (E) Representative oxygraph quantifying basal and maximal respiration of intact leukemia cells (left panel). In brief, following injection into the high-resolution respirometer, cells demonstrate a basal rate of respiration. ATP synthesis is uncoupled by addition of oligomycin (OLI). Maximal respiration is stimulated with an injection of a chemical uncoupler (FCCP) and pyruvate (PYR). All mitochondrial respiration is inhibited by addition of antimycin A (ANTIA). Intact cell basal and maximal respiration of TEX wild-type and VLCAD knockdown cells (right panel). (F) Schematic diagram showing the flow of electrons following the oxidation of fats of different carbon lengths to support respiration of the ETC. Electrons supplied by VLCAD (for very long fats; 14-18 carbons long), medium chain acyl-CoA dehydrogenase (MCAD; for medium-length fats; 6-12 carbons long), and short chain acyl-CoA dehydrogenase (SCAD; for short-length fats; 4 carbons long) reduce the FAD cofactor attached to the ETF (ETF-FAD). Reduced ETF-FADH2 is oxidized by ETF dehydrogenase (ETFDH), passing electrons to ubiquinone (UQ) and then complex III (III). Malonate (MALON) and rotenone (ROT) inhibit electron flow from complexes I (I) and II (II), respectively; residual oxygen flux measured by the respirometer is exclusively ETF supported respiration, an indirect measure of VLCAD activity when palmitate is supplied. (G) Representative oxygraph quantifying C16-supported ETF respiration (left panel). In brief, permeabilized cells are injected into the respirometer. C16 in the form of palmitoyl-carnitine (PC), malate (MAL), and adenosine diphosphate (ADP) stimulate C16-supported FAO respiration. MALON and ROT inhibit any contribution of electrons from complexes I and II, allowing ETF respiration to be exclusively assessed. C16-supported (middle panel) and C8-supported (right panel) ETF respiration of TEX wild-type and VLCAD-knockdown cells. Data in (B-D, E [right panel] and G [middle and right panels]) are mean ± standard deviation. Panel F created in Biorender. *P ≤ .05, **P ≤ .002, ***P ≤ .001, 1-way ANOVA with Tukey’s post-hoc test.
Because VLCAD plays a critical role in FAO, we investigated the impact of protein knockdown on mitochondrial respiration of intact cells and, specifically, on palmitate (C16)-supported respiration through the ETF (Figure 1A). Basal respiration of intact cells is supported by substrates supplied in media and is tightly coupled to ATP production; maximal respiration is the highest respiration rate following ATP synthase uncoupling (Figure 2E).21 Knockdown of VLCAD significantly decreased intact cell respiration [Basal F(2,8) = 9.881; P = .01; maximal F(2,8) = 24.76; P = .001; Figure 2E; AML2 cells, supplemental Figure 2E]. In permeabilized cells, ETF receives electrons from multiple dehydrogenases and passes them directly to complex III via ubiquinone, bypassing complex I and II. Inhibiting these latter complexes and supplying palmitate results in the exclusive contribution of VLCAD to ETF-supported respiration (ie, indirect measure of VLCAD activity; Figure 2F).22 Loss of VLCAD decreased C16-supported, but not C8-supported, ETF respiration [C16: F(2,8) = 141; P < .001; Figure 2G; AML2 cells: supplemental Figure 2F; C8: F(2,8) = 0.1179; P = .89; Figure 2G; AML2 cells: supplemental Figure 2F]. These results suggest that decreased C16-supported ETF respiration is specific to the knockdown of VLCAD and not the general family of ACADs.
In response to the loss of VLCAD, PDH activity [F(2,8) = 28.7; P = .0008; Figure 3A; AML2 cells: supplemental Figure 2G] was significantly increased, and ATP levels were decreased [F(2,8) = 50.15, P < .001; Figure 3B; AML2 cells, supplemental Figure 2H]. However, mitochondrial mass of the knockdown cells was unchanged, confirming that the observed mitochondrial functional changes (eg, ETF respiration, PDH, and ATP) were not due to a loss of mitochondria numbers [F(2,8) = 0.1281; P = .8821; Figure 3C; AML2 cells, supplemental Figure 2I]. The failure of PDH as a compensatory mechanism to maintain ATP levels further highlights the importance of VLCAD to AML mitochondrial metabolism.

Knockdown of VLCAD alters mitochondrial metabolism and reduces leukemia cell engraftment. Quantification of PDH activity (A), ATP levels (B), and (C) mitochondrial mass of TEX wild-type and VLCAD-knockdown cells. (D) Schematic diagram of the study, highlighting injection of an equal number of TEX wild-type or D6 cells into the tail vein of NSG mice. Engraftment levels were quantified at an intermediate time point of 5 weeks, via BM, and at the planned end point at day 101. Created using BioRender. (E) Engraftment levels of TEX wild-type and VLCAD-knockdown cells at the end point. (F) Overall survival of mice engrafted with TEX wild-type or D6 cells. *P = .0134, log-rank (Mantel-Cox) test. *P ≤ .05, **P ≤ .002, ***P ≤ .001, 1-way ANOVA with Tukey’s post hoc test (A-C); Mann-Whitney U test (E). With the exception of (D), all data are mean ± standard deviation.
Knockdown of VLCAD alters mitochondrial metabolism and reduces leukemia cell engraftment. Quantification of PDH activity (A), ATP levels (B), and (C) mitochondrial mass of TEX wild-type and VLCAD-knockdown cells. (D) Schematic diagram of the study, highlighting injection of an equal number of TEX wild-type or D6 cells into the tail vein of NSG mice. Engraftment levels were quantified at an intermediate time point of 5 weeks, via BM, and at the planned end point at day 101. Created using BioRender. (E) Engraftment levels of TEX wild-type and VLCAD-knockdown cells at the end point. (F) Overall survival of mice engrafted with TEX wild-type or D6 cells. *P = .0134, log-rank (Mantel-Cox) test. *P ≤ .05, **P ≤ .002, ***P ≤ .001, 1-way ANOVA with Tukey’s post hoc test (A-C); Mann-Whitney U test (E). With the exception of (D), all data are mean ± standard deviation.
To confirm the role of VLCAD in AML engraftment, the ability of knockdown cells to repopulate NSG mouse BM was examined (Figure 3D). Injection of an equal number of TEX cells with endogenous or reduced (TEX D6) VLCAD protein levels showed that loss of VLCAD significantly hindered leukemia cell engraftment and increased survival time more than twofold (P = .03, Mann-Whitney U test = 0; Figure 3E; P = .0134, log-rank test; Figure 3F). Taken together, VLCAD is critical to leukemia mitochondrial metabolism, proliferation, and engraftment; loss of VLCAD in leukemia cells prolongs mouse survival.
Identification of a chemical VLCAD inhibitor
To identify a pharmacological inhibitor that could recapitulate the genetic loss of VLCAD (ie, no experimental or clinical-grade compound currently exists), a respirometry-based screen of an in-house chemical library was executed. A polyhydroxylated fatty alcohol with a terminal alkyne, avocadyne (AYNE; 16-heptadecyne-1,2,4-triol), was identified as the most potent small molecule capable of inhibiting C16-supported ETF respiration (Figure 4A).
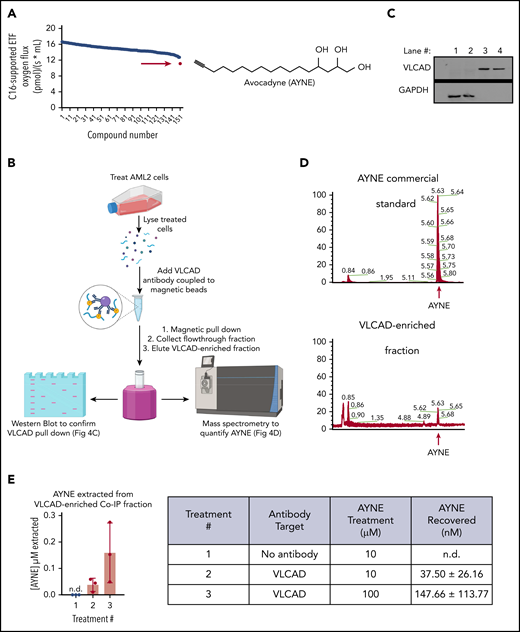
A high-resolution respirometer (HRR)-based screen identifies AYNE as a pharmacological inhibitor of VLCAD. (A) An HRR screen identified AYNE as an inhibitor of C16-supported ETF respiration. AML2 cells were incubated with a screen compound (10 µM) or a solvent vehicle for 1 hour, and C16-supported ETF respiration was assessed. AYNE (compound 151) is highlighted by a red arrow. Structure of AYNE is to the right. (B) Schematic diagram highlighting the pull-down of VLCAD in AYNE-treated AML2 cells. In brief, following a 3-hour treatment, AYNE-treated AML2 cells were lysed and exposed to an anti-VLCAD antibody coupled to magnetic beads. Magnetic separation produces 2 fractions from the lysate: the flow-through fraction (containing all lysate components except VLCAD) and the VLCAD-enriched fraction (containing only VLCAD). Both fractions underwent immunoblotting to confirm VLCAD pull-down or MS analysis to quantify AYNE. Created using BioRender. (C) Immunoblot showing isolation of VLCAD from the flow-through fractions (lanes 1 and 2) into VLCAD-enriched fractions (lanes 3 and 4) by magnetic co-IP. (D) Identification of AYNE in VLCAD-enriched fractions: chromatograms showing elution of a commercial AYNE standard (top panel) and a VLCAD-enriched fraction (bottom panel). The red arrows indicate AYNE elutes at 5.6 minutes. (E) MS quantification of AYNE in VLCAD-enriched fractions from AYNE-treated AML2 cells. Data in (E) are mean ± standard deviation; n.d., not detected.
A high-resolution respirometer (HRR)-based screen identifies AYNE as a pharmacological inhibitor of VLCAD. (A) An HRR screen identified AYNE as an inhibitor of C16-supported ETF respiration. AML2 cells were incubated with a screen compound (10 µM) or a solvent vehicle for 1 hour, and C16-supported ETF respiration was assessed. AYNE (compound 151) is highlighted by a red arrow. Structure of AYNE is to the right. (B) Schematic diagram highlighting the pull-down of VLCAD in AYNE-treated AML2 cells. In brief, following a 3-hour treatment, AYNE-treated AML2 cells were lysed and exposed to an anti-VLCAD antibody coupled to magnetic beads. Magnetic separation produces 2 fractions from the lysate: the flow-through fraction (containing all lysate components except VLCAD) and the VLCAD-enriched fraction (containing only VLCAD). Both fractions underwent immunoblotting to confirm VLCAD pull-down or MS analysis to quantify AYNE. Created using BioRender. (C) Immunoblot showing isolation of VLCAD from the flow-through fractions (lanes 1 and 2) into VLCAD-enriched fractions (lanes 3 and 4) by magnetic co-IP. (D) Identification of AYNE in VLCAD-enriched fractions: chromatograms showing elution of a commercial AYNE standard (top panel) and a VLCAD-enriched fraction (bottom panel). The red arrows indicate AYNE elutes at 5.6 minutes. (E) MS quantification of AYNE in VLCAD-enriched fractions from AYNE-treated AML2 cells. Data in (E) are mean ± standard deviation; n.d., not detected.
To confirm a physical interaction, AML2 cells were treated with AYNE, and VLCAD was isolated by co-IP (Figure 4B). Magnetic co-IP produced a flow-through fraction, containing all protein with the exception of VLCAD, and a VLCAD-enriched fraction containing only VLCAD. Fraction purity was confirmed by immunoblotting (Figure 4C); VLCAD was isolated in lanes #3 and #4 from the flow-through fraction in lanes #1 and #2. AYNE was then quantified in the VLCAD-enriched fraction using a validated liquid chromatography–MS method and compared with a commercially available analytical standard (Figure 4D).20 AYNE was detected in VLCAD-enriched fractions in a dose-dependent manner (Figure 4E), suggesting a physical interaction between VLCAD and AYNE.
Pharmacological inhibition of VLCAD imparts anti-AML activity
Death of AML cells, as determined using a 7-aminoactinomycin D exclusion assay and flow cytometry, was observed following pharmacological inhibition of VLCAD using AYNE (IC50 for TEX cells: 3.10 ± 0.12 µM; IC50 for AML2 cells: 11.39 ± 0.90 µM; Figure 5A). Similarly, clonogenic growth of patient-derived AML cells was suppressed, with no effect on the normal hematopoietic population [AML cells: t(4) = 8.871; P < .001; normal cells: t(4) = 1.26; P = .25; Figure 5B]. This demonstrates that inhibition of VLCAD imparts selective death to AML cells. Using respirometry and a standard substrate-uncoupler-inhibitor-titration (SUIT) protocol (as outlined in "Materials and methods"), VLCAD inhibition suppressed basal and maximal mitochondrial respiration of intact leukemia cells [TEX cells, basal: F(2,8) = 21.53; P = .002; TEX cells, maximal: F(2,8) = 25.86; P = .001; AML2 cells, basal: F(2,8) = 6.57; P = .004; AML2 cells, maximal: F(2,8) = 36.75; P = .001; Figure 5C]. Similarly, VLCAD inhibition resulted in complete FAO inhibition, as determined by liquid scintillation counting using radiolabeled palmitate [TEX cells: F(4,14) = 27.28; P < .001; AML2 cells: F(4,14) = 48.59; P < .001; Figure 5D]. Therefore, inhibition of VLCAD decreased FAO in leukemia cells resulting in selective AML cell death.
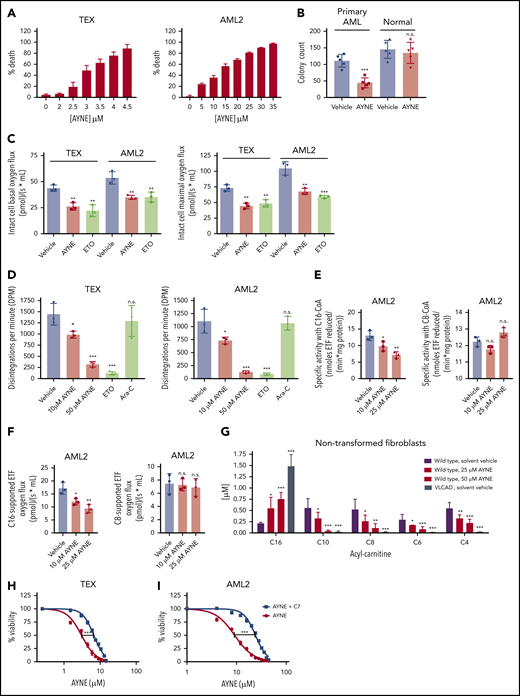
AYNE eliminates the leukemic population and hinders clonogenic growth by targeting long chain FAO at the site of VLCAD. (A) Death of leukemia cell lines TEX (left panel) and AML2 (right panel) following 72-hour treatment with AYNE. (B) Clonogenic growth of primary AML cells (#9-#13) and normal MNCs (n = 5) following a 2-week treatment with solvent vehicle or 10 µM AYNE. (C) Intact leukemia cell basal respiration (left panel) and maximal respiration (right panel) following 1-hour treatment with a solvent vehicle or 10 µM AYNE or 100 µM ETO. (D) Rates of complete FAO, using radiolabeled palmitate, in AML cell lines following 3-hour treatment with a solvent vehicle, AYNE (10 or 50 µM), ETO (100 µM; positive control for FAO inhibition), or cytarabine (Ara-C; 1 µM, negative control for FAO inhibition). (E) Following 12-hour treatment with a solvent vehicle or AYNE (10 or 25 µM), ACAD activity in AML2 cells was directly quantified with a fluorescence-based assay and palmitoyl-CoA (C16-CoA) or octanoyl-CoA (C8-CoA) to assess VLCAD or MCAD activity, respectively. (F) Following 1-hour treatment with a solvent vehicle or AYNE (10 or 25 µM), ACAD activity in AML2 cells was indirectly quantified via ETF respiration with palmitoyl-carnitine or octanoyl-carnitine to assess VLCAD or MCAD activity, respectively. (G) AC profiling after 96 hours in spent media of human nontransformed fibroblasts treated with a solvent vehicle or AYNE (25 or 50 µM). Viability of TEX cells (H) and AML2 cells (I) following 72-hour treatment with sodium heptanoate (C7) and AYNE. In (A,H-I), the 7-aminoactinomycin D exclusion assay was used for all viability experiments in which cells were treated for 72 hours. Data in (B-G) are mean ± standard deviation (SD). *P ≤ .05, **P ≤ .002, ***P ≤ .001, 2-tailed paired Student t test (B); 1-way ANOVA with Tukey’s post hoc test (C-G). In (H-I), 50% inhibitory concentrations were calculated using the dose response–inhibition equation using GraphPad Prism 7.0 and then compared as mean ± SD using a 2-tailed unpaired Student t test.
AYNE eliminates the leukemic population and hinders clonogenic growth by targeting long chain FAO at the site of VLCAD. (A) Death of leukemia cell lines TEX (left panel) and AML2 (right panel) following 72-hour treatment with AYNE. (B) Clonogenic growth of primary AML cells (#9-#13) and normal MNCs (n = 5) following a 2-week treatment with solvent vehicle or 10 µM AYNE. (C) Intact leukemia cell basal respiration (left panel) and maximal respiration (right panel) following 1-hour treatment with a solvent vehicle or 10 µM AYNE or 100 µM ETO. (D) Rates of complete FAO, using radiolabeled palmitate, in AML cell lines following 3-hour treatment with a solvent vehicle, AYNE (10 or 50 µM), ETO (100 µM; positive control for FAO inhibition), or cytarabine (Ara-C; 1 µM, negative control for FAO inhibition). (E) Following 12-hour treatment with a solvent vehicle or AYNE (10 or 25 µM), ACAD activity in AML2 cells was directly quantified with a fluorescence-based assay and palmitoyl-CoA (C16-CoA) or octanoyl-CoA (C8-CoA) to assess VLCAD or MCAD activity, respectively. (F) Following 1-hour treatment with a solvent vehicle or AYNE (10 or 25 µM), ACAD activity in AML2 cells was indirectly quantified via ETF respiration with palmitoyl-carnitine or octanoyl-carnitine to assess VLCAD or MCAD activity, respectively. (G) AC profiling after 96 hours in spent media of human nontransformed fibroblasts treated with a solvent vehicle or AYNE (25 or 50 µM). Viability of TEX cells (H) and AML2 cells (I) following 72-hour treatment with sodium heptanoate (C7) and AYNE. In (A,H-I), the 7-aminoactinomycin D exclusion assay was used for all viability experiments in which cells were treated for 72 hours. Data in (B-G) are mean ± standard deviation (SD). *P ≤ .05, **P ≤ .002, ***P ≤ .001, 2-tailed paired Student t test (B); 1-way ANOVA with Tukey’s post hoc test (C-G). In (H-I), 50% inhibitory concentrations were calculated using the dose response–inhibition equation using GraphPad Prism 7.0 and then compared as mean ± SD using a 2-tailed unpaired Student t test.
Direct inhibition of VLCAD was confirmed [AML2 cells: F(2,8) = 14.79; P = .005; Figure 5E; TEX cells: supplemental Figure 3A], with no effect on medium chain acyl-CoA dehydrogenase (MCAD) [AML2 cells: F(2,8) = 10.8; P = .095; Figure 5E; TEX cells: supplemental Figure 3A], complex I (AML2 cells: supplemental Figure 4), or complex II (AML2 cells: supplemental Figure 4). Importantly, C16-supported ETF respiration (ie, very long chain FAO) was hindered by direct VLCAD inhibition [AML2 cells: F(2,8) = 14.97; P = .005; Figure 5F; TEX cells: supplemental Figure 3B], with no effect on C8-supported ETF respiration [ie, medium chain FAO; AML2 cells: F(2,8) = 0.158; P = .86; Figure 5F; TEX cells: supplemental Figure 3B]. This confirms that inhibition of VLCAD with AYNE recapitulates the effects of VLCAD knockdown on impairing mitochondrial respiration and decreasing FAO in leukemia cells.
Profiling of ACs, which are FAO metabolites, is a clinical screening tool that is used to identify and diagnose patients with FAO deficiencies.26,30 Deficient VLCAD activity results in a characteristic accumulation of long chain AC, one of which is fully saturated C16, the substrate of VLCAD. As a result of the upstream blockage of long chain FAO, there is a subsequent decrease in fully saturated medium and short chain ACs.26,30 Thus, to further confirm VLCAD inhibition, we compared AC profiles from AYNE-treated nontransformed fibroblasts with functional VLCAD and nontransformed fibroblasts from a patient with VLCAD deficiency. In these studies, cells were placed in minimal essential medium supplemented with palmitate–bovine serum albumin and carnitine (ie, to promote FAO); the spent cell media was subjected to AC profiling by tandem MS.26 Treatment with AYNE resulted in a similar AC profile to fibroblasts lacking VLCAD with noted accumulations in C16 carnitine and depletions in C10, C8, C6, and C4 carnitines [C16 carnitine: F(3,16) = 52.78; P < .001; C10 carnitine: F(3,16) = 20.48; P < .001; C8 carnitine: F(3,16) = 12.10; P < .001; C6 carnitine: F(3,16) = 17.35; P < .001; C4 carnitine: F(3,16) = 31.83; P < .001) (Figure 5G).
The specificity of AYNE for VLCAD was further confirmed using cell lines with partial VLCAD knockdown (denoted as D5, D7, and D9; supplemental Figure 5A). D5 and D9 showed moderate, but significant, VLCAD knockdown, whereas D7 did not have any change in VLCAD compared to the parental line. Interestingly, partial VLCAD knockdown coincided with reduced C16-supported ETF respiration in D5 and D9 (supplemental Figure 5C), which was further suppressed with the addition of AYNE (supplemental Figure 5D). Consistent with VLCAD specificity, FAO inhibitors that do not target VLCAD (eg, ETO and ranolazine [RAN]) did not have any effect (supplemental Figure 5D). Taken together, we confirm that AYNE is an FAO inhibitor that specifically targets VLCAD.
Sodium heptanoate is the salt of the active metabolite of triheptanoin, a glycerol esterified to 3 seven-carbon (C7) fatty acids used to treat long chain FAO disorders.31 To confirm that AYNE causes a blockade of long chain FAO, we coincubated cells with C7, a medium chain fatty acid. Medium chain fatty acids bypass long chain mitochondrial FAO enzymes (ie, VLCAD) to be broken down by medium and short chain FAO enzymes, forming TCA cycle–bound acetyl-CoA and propionyl-CoA.31 As such, we reasoned that treatment with C7 would bypass VLCAD inhibition and rescue AML cell viability. Indeed, cotreatment with C7 increased the 50% inhibitory concentration twofold, reducing AYNE-imparted cell toxicity in TEX cells [t(4) = 14.59; P < .001; Figure 5H] and AML2 cells [t(4) = 12.25; P < .001; Figure 5I].
VLCAD inhibition decreases contribution of palmitate to the TCA cycle without activation of compensatory glycolysis
To characterize the effects of inhibiting VLCAD, we assessed viability and ATP levels in primary AML and normal populations following CD34+ cell isolation (supplemental Figure 6). VLCAD inhibition did not have any effect on CD34+ normal cell viability [t(4) = 0.2992; P = .78], but it was cytotoxic to bulk primary AML cells [t(4) = 6.793; P = .002] and CD34+ primary AML cells [t(6) = 6.047; P < .001] (Figure 6A). Preceding AML cell death, ATP levels were depleted; ATP levels were not depleted in normal CD34+ cells coinciding with cell survival [AML #18 cells: t(6) = 5.609; P = .001; AML #20 cells: t(4) = 52.23; P < .001; AML #21 cells: t(4) = 35.41, P < .001; normal CD34+ #1: t(4) = 0.239, P = .82; #2: t(4) = 0.8484, P = .44; #3; t(4) = 0.2689; P = .8) (Figure 6B).
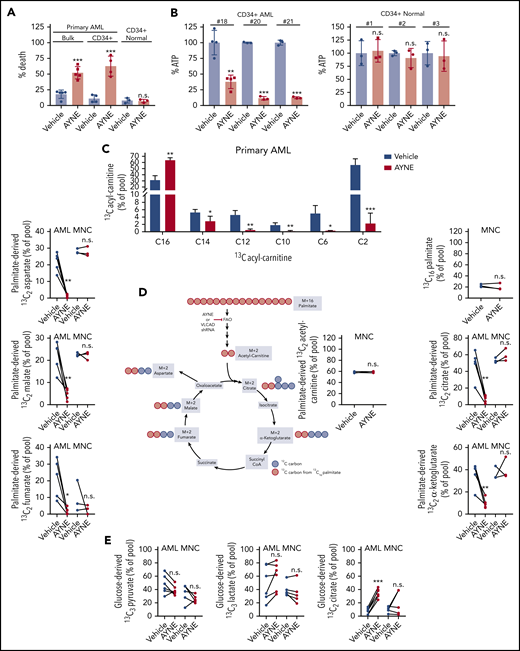
AYNE inhibits palmitate contribution to the TCA cycle, resulting in primary AML cell death while sparing normal cells. (A) Viability of primary bulk AML cells (#14-#18), primary CD34+ AML cells (#2, #3, #15, #19), and normal CD34+ cells (n = 3) treated for 24 hours. (B) Quantification of ATP levels in primary CD34+ AML and CD34+ normal cells after 12-hour treatment. (C) Levels of 13C-labeled ACs in primary AML cells (#4, #22, #23, #24, #27) after 12 hours. (D) Enrichment of 13C atoms into FAO and TCA metabolites following 12-hour treatment with a uniformly labeled 13C16 palmitate tracer in primary AML cells (#4, #22, #23, #24, #27) and normal MNCs (n = 3). Created using BioRender. (E) Levels of 13C3 lactate, 13C3 pyruvate, 13C2 citrate following 12-hour treatment with a 13C6 glucose tracer in primary AML cells (#3, #15, #16, #19, #25, #26) and normal MNCs (n = 5). In all experiments, primary AML cells and normal MNCs were treated with a solvent vehicle or 50 µM AYNE. In (A-E), data are mean ± standard deviation. Summary of patient cytogenetics are shown in supplemental Figure 10. Summary of statistics for (C-E) are shown in supplemental Figure 11. *P ≤ .05, **P ≤ .002, ***P ≤ .001, 2-tailed unpaired Student t test. shRNA, short hairpin RNA.
AYNE inhibits palmitate contribution to the TCA cycle, resulting in primary AML cell death while sparing normal cells. (A) Viability of primary bulk AML cells (#14-#18), primary CD34+ AML cells (#2, #3, #15, #19), and normal CD34+ cells (n = 3) treated for 24 hours. (B) Quantification of ATP levels in primary CD34+ AML and CD34+ normal cells after 12-hour treatment. (C) Levels of 13C-labeled ACs in primary AML cells (#4, #22, #23, #24, #27) after 12 hours. (D) Enrichment of 13C atoms into FAO and TCA metabolites following 12-hour treatment with a uniformly labeled 13C16 palmitate tracer in primary AML cells (#4, #22, #23, #24, #27) and normal MNCs (n = 3). Created using BioRender. (E) Levels of 13C3 lactate, 13C3 pyruvate, 13C2 citrate following 12-hour treatment with a 13C6 glucose tracer in primary AML cells (#3, #15, #16, #19, #25, #26) and normal MNCs (n = 5). In all experiments, primary AML cells and normal MNCs were treated with a solvent vehicle or 50 µM AYNE. In (A-E), data are mean ± standard deviation. Summary of patient cytogenetics are shown in supplemental Figure 10. Summary of statistics for (C-E) are shown in supplemental Figure 11. *P ≤ .05, **P ≤ .002, ***P ≤ .001, 2-tailed unpaired Student t test. shRNA, short hairpin RNA.
FAO supplies fat-derived acetyl-CoA to the TCA cycle.9 To assess the contribution of FAO to TCA metabolism, we conducted stable isotope tracing experiments with a uniformly labeled 13C16 palmitate tracer in leukemia cell lines (TEX and AML2 cells; supplemental Figure 7A), patient-derived AML cells (Figure 6C-D), and normal MNC samples (Figure 6D). In TEX and AML2, treatment with AYNE and ETO, a positive control for FAO inhibition, as well as the loss of VLCAD induced an accumulation of 13C16 palmitate and a depletion of 13C2 acetyl-carnitine (below the detection limit), confirming FAO inhibition (supplemental Figure 7A). In patient-derived AML cells, AYNE also inhibited FAO, with a similar accumulation in 13C16 palmitate and a decrease in 13C2 acetyl-carnitine (Figure 6C). Similar to our AC profiling with the nontransformed fibroblasts (Figure 5G), we noted significant decreases in medium and short chain ACs derived from the 13C16 palmitate tracer, further confirming long chain FAO inhibition (Figure 6C). Following VLCAD knockdown or pharmacological inhibition of VLCAD in AML lines (supplemental Figure 7A) or primary AML (Figure 6D), we observed significantly decreased enrichment of fat-derived carbon into TCA metabolites. At the concentration (50 µM) and time point (12 hours) that suppressed AML mitochondrial metabolism, normal MNC samples did not alter the enrichment of fat-derived 13C atoms into FAO or TCA metabolites.
To assess potential compensatory glycolysis in response to FAO inhibition, the enrichment of glucose-derived 13C atoms from a 13C6 glucose tracer into pyruvate, lactate, and citrate pools were quantified in AML2 cells (supplemental Figure 7B), primary AML, and normal MNC samples (Figure 6E). Pyruvate, the terminal metabolite of glycolysis, stands at the junction between lactate production and mitochondrial oxidation.32 Across AML2 and primary AML cells, FAO inhibition did not alter levels of 13C3 pyruvate, confirming no alteration of glycolysis. Lactate production is also viewed as a measure of glycolytic activity.6,33-35 VLCAD knockdown in AML2 cells resulted in a slight increase in 13C3 lactate (supplemental Figure 7B). In contrast, pharmacological inhibition of FAO did not alter levels of 13C3 lactate in AML2 (supplemental Figure 7B) or primary AML cells (Figure 6E). Compared to the vehicle control, there was no significant change in 13C3 pyruvate or 13C3 lactate, which suggests no compensatory upregulation of glycolysis or lactate production in response to pharmacological VLCAD inhibition.
Enrichment of glucose-derived carbons into the 13C2 citrate isotopomer is used as an analog to measure PDH activity.36,37 Knockdown or pharmacological inhibition of VLCAD in AML2 cells (supplemental Figure 7B) and primary AML cells (Figure 6E) resulted in significantly increased 13C2 citrate, in agreement with increased PDH activity as confirmed earlier with a commercial kit (Figure 3A; supplemental Figure 2G). In normal MNCs receiving 13C16 palmitate tracer, there was no significant change in 13C2 TCA metabolites, coinciding with no FAO inhibition at this concentration (50 µM) and time point (12 hours) (Figure 6D). Normal MNCs also did not alter the levels of 13C3 pyruvate, 13C3 lactate, or 13C2 citrate following incubation with the 13C6 glucose tracer (Figure 6E). Statistical values for all tracer experiments (Figure 6C-E; supplemental Figure 7) are presented in supplemental Figure 11. Together, this confirms that basal levels of glycolysis are not upregulated in response to VLCAD inhibition; however, compensatory PDH activation occurs but is ultimately insufficient to prevent death of leukemia cell lines or patient-derived AML cells. Thus, the selective nature of VLCAD inhibition, in exclusively impairing altered AML cell metabolism, results in the death of AML but not normal cells.
Inhibition of VLCAD imparts selective anti-AML activity in vivo
Pharmacological inhibition of VLCAD was tested in vivo in a functionally defined subset of primitive human AML and normal hematopoietic cell populations using a mouse engraftment assay (Figure 7A). Normal HSCs were injected into the tail vein of NSG mice. After 1 week, intraperitoneal injections of AYNE (300 mg/kg per week) were administered for 6 weeks (U = 1; P = .06; Figure 7B). There was no significant effect on the repopulation potential of normal human myeloid cells (CD33+/CD45+) in mouse BM compared with vehicle control, as measured by flow cytometry (Figure 7B).
![AYNE selectively eliminates the AML population and targets VLCAD in vivo. (A) Schematic diagram of the study highlighting the injection of patient-derived AML or normal cord blood MNC into tail veins of NSG mice. After an engraftment period during which human cells localize to BM, mice were divided into 2 groups (vehicle or AYNE) and then treated 3 times weekly for 4 or 6 weeks. Mice were then euthanized, femurs were flushed, and human CD33+/CD45+ cells were quantified via flow cytometry. Created using BioRender. Human cells were given 1 week (B-D) or 4 weeks (E) to engraft prior to starting treatment. (B) Engraftment of healthy cord cells following treatment with 300 mg/kg per week of AYNE or vehicle control for 6 weeks. Engraftment of patient-derived AML cells following treatment with vehicle or AYNE [225 mg/kg per week (C) or 300 mg/kg per week (D)] for 6 weeks. (E) Engraftment of patient-derived AML cells following treatment with vehicle or AYNE (200 mg/kg per week) for 4 weeks. (F) Schematic diagram of the study highlighting injection of patient-derived AML cells into the tail vein of NSG mice. After 8 weeks, mice were divided into 2 groups (vehicle or AYNE) and treated with a bolus dose of AYNE (150 or 200 mg/kg) or a vehicle control. Twenty-four hours later, mice were euthanized, femurs were flushed, and cells were recovered for downstream applications. The mix of human and mice cells recovered from the femurs was quantified via flow cytometry before (G) and after (H) column purification. C16-supported ETF respiration (I) and thermostabilization of VLCAD (J) were assessed in human cells recovered from mice that received vehicle or AYNE (150 or 200 mg/kg). In (B-E,I-J), data are mean ± standard deviation. *P ≤ .05, **P ≤ .002, ***P ≤ .001, Mann-Whitney U test (B-E); 1-way ANOVA with Tukey’s post hoc test (I-J).](https://ash.silverchair-cdn.com/ash/content_public/journal/blood/137/25/10.1182_blood.2020008551/1/m_bloodbld2020008551f7.png?Expires=1769080735&Signature=4UZMaTcNgU0nlCddx1H8~~g15kwmH2DgbFHWa44d~iiiBajquKDQgL4Cy8dL3O3UoGz8NjTBF3uRYwpU6MFVnNL00LuvwVyvfBjqc5seq-MYiFTrsh2Su99mlnOYPly3ts-LnzLyzgMYyupoLo6V2w52hVwI2WIDxn6vMTE95CazZrg6mxyT5QDX86OlDnsiZqxBRyXlgVoQdWppZHy5yq7sPd38UpdmrU3LTL~Ymmqt1Nk7MCq-kSySCk3T4Q60s3wh27JdwDfaBwGCIxETlbuIBeAIQEgV3j4o62m33AWpjUYMZ~prnJUwTmOjzdT7D5DNFuP4Fe-KgS1vFYH~Dw__&Key-Pair-Id=APKAIE5G5CRDK6RD3PGA)
AYNE selectively eliminates the AML population and targets VLCAD in vivo. (A) Schematic diagram of the study highlighting the injection of patient-derived AML or normal cord blood MNC into tail veins of NSG mice. After an engraftment period during which human cells localize to BM, mice were divided into 2 groups (vehicle or AYNE) and then treated 3 times weekly for 4 or 6 weeks. Mice were then euthanized, femurs were flushed, and human CD33+/CD45+ cells were quantified via flow cytometry. Created using BioRender. Human cells were given 1 week (B-D) or 4 weeks (E) to engraft prior to starting treatment. (B) Engraftment of healthy cord cells following treatment with 300 mg/kg per week of AYNE or vehicle control for 6 weeks. Engraftment of patient-derived AML cells following treatment with vehicle or AYNE [225 mg/kg per week (C) or 300 mg/kg per week (D)] for 6 weeks. (E) Engraftment of patient-derived AML cells following treatment with vehicle or AYNE (200 mg/kg per week) for 4 weeks. (F) Schematic diagram of the study highlighting injection of patient-derived AML cells into the tail vein of NSG mice. After 8 weeks, mice were divided into 2 groups (vehicle or AYNE) and treated with a bolus dose of AYNE (150 or 200 mg/kg) or a vehicle control. Twenty-four hours later, mice were euthanized, femurs were flushed, and cells were recovered for downstream applications. The mix of human and mice cells recovered from the femurs was quantified via flow cytometry before (G) and after (H) column purification. C16-supported ETF respiration (I) and thermostabilization of VLCAD (J) were assessed in human cells recovered from mice that received vehicle or AYNE (150 or 200 mg/kg). In (B-E,I-J), data are mean ± standard deviation. *P ≤ .05, **P ≤ .002, ***P ≤ .001, Mann-Whitney U test (B-E); 1-way ANOVA with Tukey’s post hoc test (I-J).
AYNE selectively eliminates the AML population and targets VLCAD in vivo. (A) Schematic diagram of the study highlighting the injection of patient-derived AML or normal cord blood MNC into tail veins of NSG mice. After an engraftment period during which human cells localize to BM, mice were divided into 2 groups (vehicle or AYNE) and then treated 3 times weekly for 4 or 6 weeks. Mice were then euthanized, femurs were flushed, and human CD33+/CD45+ cells were quantified via flow cytometry. Created using BioRender. Human cells were given 1 week (B-D) or 4 weeks (E) to engraft prior to starting treatment. (B) Engraftment of healthy cord cells following treatment with 300 mg/kg per week of AYNE or vehicle control for 6 weeks. Engraftment of patient-derived AML cells following treatment with vehicle or AYNE [225 mg/kg per week (C) or 300 mg/kg per week (D)] for 6 weeks. (E) Engraftment of patient-derived AML cells following treatment with vehicle or AYNE (200 mg/kg per week) for 4 weeks. (F) Schematic diagram of the study highlighting injection of patient-derived AML cells into the tail vein of NSG mice. After 8 weeks, mice were divided into 2 groups (vehicle or AYNE) and treated with a bolus dose of AYNE (150 or 200 mg/kg) or a vehicle control. Twenty-four hours later, mice were euthanized, femurs were flushed, and cells were recovered for downstream applications. The mix of human and mice cells recovered from the femurs was quantified via flow cytometry before (G) and after (H) column purification. C16-supported ETF respiration (I) and thermostabilization of VLCAD (J) were assessed in human cells recovered from mice that received vehicle or AYNE (150 or 200 mg/kg). In (B-E,I-J), data are mean ± standard deviation. *P ≤ .05, **P ≤ .002, ***P ≤ .001, Mann-Whitney U test (B-E); 1-way ANOVA with Tukey’s post hoc test (I-J).
Next, patient-derived AML cells were injected into the tail vein of NSG mice, and AYNE or a vehicle control was administered after 7 or 28 days. Inhibition of VLCAD significantly reduced the repopulation potential of leukemia cells compared with vehicle control–treated mice (U = 0; P = .03; Figure 7C; U = 0; P = .02; Figure 7D; U = 0; P = .005; Figure 7E). Analysis of complete blood counts, bilirubin, serological markers (ie, alkaline phosphatase and creatine kinase, which are markers of kidney function and liver function, respectively), and mouse body weights did not reveal any differences between the control and AYNE treatment groups (supplemental Figure 8). Together, these demonstrate the selective activity of VLCAD inhibition against primitive leukemia cells in established preclinical models.
To confirm VLCAD inhibition in vivo, patient-derived cells from AML #28 were injected into NSG mice and allowed to engraft for 8 weeks (Figure 7F). Mice were then given a bolus dose of AYNE (150 or 200 mg/kg) or a vehicle control. After 24 hours, femoral BM was harvested (Figure 7G), and human myeloid cells (CD33+/CD45+) were isolated and purified (Figure 7H). C16-supported ETF respiration, as an indirect measure of VLCAD activity, and a cellular thermal shift assay, as a measure of drug-target binding, were performed. Prior to the cellular thermal shift assay with primary leukemia cells, the melting point of VLCAD was determined to be 60°C with AML2 cells (supplemental Figure 9). Isolated engrafted human cells (>95% pure) from mice treated with AYNE showed inhibition of ETF respiration [F(2,7) = 13.29; P = .01; Figure 7I] and a shift in VLCAD melting temperature, which confirmed inhibition of VLCAD activity and an AYNE-VLCAD interaction, respectively [F(2,8) = 14.95; P = .005; Figure 7J]. Taken together, these studies confirm in vivo efficacy against leukemia populations, while sparing hematopoietic cells, as well as pharmacological inhibition of VLCAD.
Discussion
Compared with the hematopoietic population, leukemia cells have higher rates of FAO that contribute to dysregulated metabolism, resulting in altered rates of proliferation and increased survival during chemotherapy.2,3 Although FAO is potentially a novel pharmacological target in AML, previous reports have focused on inhibiting the entry of fats into the cytoplasm via CD365 or into the mitochondria via CPT1.2,3 In this study, we investigated intramitochondrial FAO enzymes to determine a novel anti-AML target. Database profiling confirmed that ACADVL, the gene encoding the enzyme catalyzing the first intramitochondrial step of long chain FAO (ie, VLCAD),9 is overexpressed in AML. Although VLCAD in AML has not been explored previously, we show here that it plays a critical role in FAO, downstream oxidative metabolism, and overall AML cell survival. Indeed, protein knockdown or pharmacological inhibition of VLCAD resulted in selective toxicity of AML cells in vitro and in vivo. Thus, this study highlights the importance of VLCAD in AML and validates a novel metabolic target of this disease.
VLCAD is a homodimer that is anchored to the inner mitochondrial membrane and interacts with the ETF, an electron acceptor protein equipped with a FAD cofactor.38 Long chain acyl substrates are oxidized by VLCAD, which introduces a double bond across carbons 2 to 3 while reducing the FAD cofactor.38 Through a series of redox reactions, electrons are transferred by ETF dehydrogenase from ETF to ubiquinone and, finally, to complex III.9 In this study, we identified a crucial role for VLCAD in altered leukemia cell metabolism. In leukemia cell lines, loss of VLCAD activity inhibited C16-supported ETF respiration to hinder mitochondrial FAO and decrease fat-derived 13C atom enrichment into the TCA cycle, while triggering insufficient compensatory PDH activity. This resulted in reduced proliferation, clonogenic potential, and engraftment, confirming that VLCAD is critical to leukemia cell growth and repopulation potential.
VLCAD deficiency is a rare human disorder that is defined by a mutation in the ACADVL gene causing decreased VLCAD enzymatic activity.39 A range of clinical symptoms with varied severity are due to the depletion of ATP and TCA metabolites.31,39 Adult VLCAD-deficient patients manage the severity of their symptoms by avoiding a diet high in long chain fats, stress, cold exposure, fasting, and strenuous exercise.39 Although the severe form of VLCAD deficiency can present with cardiomyopathy and rhabdomyolysis, hypoketotic hypoglycemia is also a typical symptom.39 Xiong et al demonstrated cardiomyopathy in murine cardiomyocytes upon conditional ACADVL deletion.40 In a previously published pharmacokinetic study by our group, we demonstrated that AYNE was detected in murine cardiac tissue.41 Although studies reported here showed that 6 weeks of repeated AYNE therapy was well tolerated, direct cardiotoxicity needs be confirmed in future murine studies.
Pharmacological inhibition of FAO has been applied with varying success in preclinical AML studies.2,3,5,7 Clinical FAO inhibitors exist, most of which target components of the mitochondrial trifunctional protein12,16 ; however, no experimental or clinical VLCAD-specific inhibitors are available. In this study, AYNE recapitulated the effects of VLCAD knockdown, resulting in selective toxicity of primary AML cells in vitro and in vivo. In primary AML cells, chemical inhibition of VLCAD blocked FAO to decrease enrichment of 13C atoms from the 13C16 palmitate tracer into TCA metabolites. FAO inhibition did not significantly upregulate glycolysis with no changes in glucose-derived carbon enrichment into pyruvate and lactate. Despite no change in glycolysis, primary leukemia cells increased PDH activity that was ultimately insufficient to prevent ATP depletion or cell death. At the dose and time point that eliminated primary AML cells, donor-derived normal MNCs were spared from FAO inhibition, resulting in no change in ATP levels or viability. The divergent metabolic fates observed with primary AML and normal MNCs demonstrate a therapeutic window for VLCAD inhibition in AML. Together, this study highlights VLCAD as a novel drug target that, when inhibited, results in selective leukemia cell death due to AML metabolic inflexibility.
Glucose,42 fatty acid,3,43 and amino acid35 oxidation are rewired to support the energy demands of rapidly proliferating leukemia cells. Specific leukemia subpopulations harboring these metabolic dependencies are unable to upregulate alternative catabolic processes under metabolic stress. In contrast, normal cells switch to compensatory metabolism for survival, further demonstrating the therapeutic potential of targeting altered AML metabolism.6 In agreement with numerous studies that used pharmacological inhibitors of mitochondrial proteins (ie, BCL2, complex I) or substrate withdrawal,6,33-35 inhibition or genetic knockdown of VLCAD results in no compensatory glycolysis, leading to leukemia cells with greatly reduced proliferation and engraftment potential. Downstream from glycolysis, AYNE and VLCAD knockdown increased 13C2 citrate levels from the 13C6 glucose tracer, suggesting increased PDH activity. Previously, increased PDH activity supported leukemia mitochondrial respiration and ATP production, resulting in decreased proliferation and engraftment potential.44,45 In agreement with these previous observations, the increase in PDH activity could explain the decreased proliferation and engraftment observed upon VLCAD knockdown. Despite demonstrating significantly increased PDH activity, primary AML samples still showed significant cell death, confirming that this compensatory increase was insufficient to rescue the leukemia population.
Interestingly, although unable to use other fuel substrates, depletion of ATP and TCA metabolites can be averted by supplementing starved leukemia cells with a downstream product of the inhibited pathway.27,46 For example, inhibition of glutaminolysis by CB-839 or glutamine starvation could be rescued with exogenous α-ketoglutarate27 or oxaloacetate,46 averting ATP depletion and apoptosis. Similarly, medium chain triglyceride oils are provided to patients with VLCAD deficiency with varied clinical success. In our study, supplying leukemia cells with a medium chain fat partially attenuated AYNE-induced cell death by bypassing the blockage at long chain FAO.31 Taken together, alterations in leukemia cell metabolism caused by substrate inhibition (ie, fatty acids3,43 or amino acids35 ), reductions in TCA cycle activity, or perturbations of OXPHOS6,8 resulted in selective cell death.
AML is a highly heterogeneous cancer with diverse patient cytogenetics. Although this study confirmed FAO inhibition and reduced contributions of fat-derived carbon to the TCA cycle in primary AML samples, additional samples are required to make a conclusive statement about whether VLCAD inhibition, or, more generally, FAO inhibition will be particularly efficacious in a specific AML patient subpopulation. Therefore, future studies will correlate primary AML sample sensitivity with VLCAD activity.
In summary, VLCAD plays a central role in AML metabolism. Decreased VLCAD activity reduced AML cell viability, which resulted in an insufficient metabolic response that was mechanistically defined by no change in glycolysis, insufficient compensatory PDH activity, a decreased contribution of fat-derived carbons to the TCA cycle, and ultimately, ATP depletion. These results highlight, for the first time, VLCAD as a novel metabolic regulator of AML cell viability.
Data sharing requests should be sent to Paul A. Spagnuolo (paul.spagnuolo@uoguelph.ca).
The online version of this article contains a data supplement.
The publication costs of this article were defrayed in part by page charge payment. Therefore, and solely to indicate this fact, this article is hereby marked “advertisement” in accordance with 18 USC section 1734.
Acknowledgments
The authors thank John Dick for the generous gift of TEX cells.
This work was supported by grants from the Leukemia Research Foundation (P.A.S.), Cancer Research Society (P.A.S.), National Sciences and Engineering Research Council (P.A.S.), the Ontario Institute for Cancer Research (P.A.S.), and by National Institutes of Health, National Institute of Diabetes and Digestive and Kidney Diseases grant R01-DK78755 (J.V.).
Authorship
Contribution: P.A.S. conceived the project and designed experiments; M.T. designed and performed experiments; A.R. and P.J. conducted in vivo experiments; N.A., R.W.S., A.D., and E.B. conducted UHPLC and/or MS analyses; M.D.M., D.A.H., and K.H. provided primary human samples; K.A.R. and T.A.A. conducted liquid scintillation counting; A.-W.M. and J.V. conducted AC profiling experiments; and A.D.S. and J.V. provided technical advice.
Conflict-of-interest disclosure: A.D.S. has received honoraria or consulting fees from Novartis, Jazz Pharmaceuticals, Otsuka, and Takeda Pharmaceuticals and research support from Medivir AB and Takeda. A.D.S. owns stock in AbbVie Pharmaceuticals. A.D.S. and P.A.S. are named on a patent application for the use of avocado compounds for the treatment of leukemia; however, this patent was not pursued passed the jurisdictional phase. P.A.S. has received honoraria from the Hass Avocado Board. The remaining authors declare no competing financial interests.
Correspondence: Paul A. Spagnuolo, Department of Food Science, University of Guelph, 50 Stone Rd, Guelph, ON N1G 2W1, Canada; e-mail: paul.spagnuolo@uoguelph.ca.

This feature is available to Subscribers Only
Sign In or Create an Account Close Modal