

Key Points
ROR1 is an actionable tumor-specific target in RS.
The novel ADC VLS-101 induces complete tumor regressions and prolongs survival in RS-PDXs.

Abstract
Richter syndrome (RS) represents the transformation of chronic lymphocytic leukemia (CLL), typically to an aggressive lymphoma. Treatment options for RS are limited and the disease is often fatal. Receptor tyrosine kinase–like orphan receptor 1 (ROR1) is expressed on CLL cells and other cancers but not on healthy adult tissues, making it an attractive, tumor-specific therapeutic target. VLS-101 is being developed as an antibody-drug conjugate (ADC) for therapy of ROR1-expressing (ROR1+) cancers. VLS-101 comprises UC-961 (a humanized immunoglobulin G1 monoclonal antibody that binds an extracellular epitope of human ROR1), a maleimidocaproyl-valine-citrulline-para-aminobenzoate linker, and the antimicrotubule cytotoxin monomethyl auristatin E (MMAE). VLS-101 binding to ROR1 results in rapid cellular internalization and delivery of MMAE to induce tumor cell death. We studied 4 RS patient-derived xenografts (RS-PDXs) with varying levels of ROR1 expression (11%, 32%, 85%, and 99% of cells). VLS-101 showed no efficacy in the lowest-expressing RS-PDX but induced complete remissions in those with higher levels of ROR1 expression. Responses were maintained during the posttherapy period, particularly after higher VLS-101 doses. In systemic ROR1+ RS-PDXs, VLS-101 dramatically decreased tumor burden in all RS-colonized tissues and significantly prolonged survival. Animals showed no adverse effects or weight loss. Our results confirm ROR1 as a target in RS and demonstrate the therapeutic potential of using an ADC directed toward ROR1 for the treatment of hematological cancers. A phase 1 clinical trial of VLS-101 (NCT03833180) is ongoing in patients with RS and other hematological malignancies.
Introduction
Receptor tyrosine kinase–like orphan receptor 1 (ROR1) is a member of the ROR family of type I transmembrane receptors with ligand-binding extracellular and intracellular tyrosine kinase domains.1 ROR1 binds to Wnt5a, a noncanonical Wnt-signaling member, with consequent activation of guanine-exchange factors and the phosphoinositol-3 kinase/Jnk-signaling pathway.2 During embryogenesis, ROR1 has a physiological role in neural, auditory, skeletal, and vascular organogenesis, but its expression decreases during fetal development and is absent or expressed at low levels in most adult tissues as indicated by immunohistochemistry (IHC) and western blot analyses.3-5
As an oncofetal protein, ROR1 can reappear on hematological cancers and solid tumors, particularly those with high-grade histology,6-9 and may promote tumor cell migration through Wnt5a signaling or interactions with other receptors.10-13 Although ROR1 is completely absent on mature healthy B cells, it is expressed on chronic lymphocytic leukemia (CLL) cells, and high levels of ROR1 identify patients with more aggressive disease course.14-16 In mouse models of human CLL, ROR1 expression accelerates the development and progression of leukemia, likely by sustaining hyperactivation of the TCL1-signaling cascade.17
To date, nothing has been known regarding ROR1 expression in Richter syndrome (RS), the histological transformation of CLL into an aggressive lymphoma. The most common presentation of RS is a diffuse large B-cell lymphoma (DLBCL), with the majority of cases showing a clonal relationship with the preceding CLL.18-20 Despite a revolution in therapeutic options for patients with CLL,21 the experience with these novel agents is still limited with only few phase 1/2 clinical trials ongoing. Most of the clinical trials are currently testing different drug combinations, including venetoclax plus REPOCH (rituximab, etoposide phosphate, prednisone, vincristine sulfate, cyclophosphamide, doxorubicin hydrochloride), nivolumab plus ibrutinib, and selinexor plus RICE (rituximab, ifosfamide, carboplatin, etoposide), among others.22 In addition, cellular-based immune therapy exploiting CD19-directed chimeric antigen receptor–modified T cells are currently under evaluation for patients with RS.23-25 Even though early encouraging results have been published,26-29 RS treatment remains an unmet medical need.22 Given its tumor-specific expression pattern, ROR1 represents an attractive therapeutic target in patients who have RS that has transformed from ROR1-expressing CLL.
A humanized immunoglobulin G1 (IgG1) monoclonal antibody (UC-961, informally known as cirmtuzumab) was developed to target an epitope on the extracellular domain of ROR1.30 The antibody was shown to internalize and block Wnt5a-induced effects on CLL cells, thereby inhibiting in vitro migration and proliferation.12,17 When evaluated in a phase 1 clinical trial in 26 patients with CLL, UC-961 was very safe and showed ROR1 binding, downregulation of ROR1-mediated signaling on CLL cells, and excellent tolerability.31 However, the naked UC-961 antibody lacked clinical antitumor activity. The findings confirmed UC-961 targeting of tumor cells but suggested that inhibition of ROR1 signaling alone might not be sufficient for clinical efficacy.
These results have prompted development of VLS-101, an antibody-drug conjugate (ADC), combining UC-961 as the ROR1-targeting moiety with a proteolytically cleavable linker, and the antimicrotubule agent, monomethyl auristatin E (MMAE). VLS-101 has been designed to exploit the internalizing properties of UC-961 to deliver the ADC-ROR1 complex to tumor cell lysosomes for release of MMAE via lysosomal proteolytic cleavage and subsequent cell-cycle arrest and apoptotic tumor cell death. In nonclinical models of CLL and mantle cell lymphoma (MCL), VLS-101 has demonstrated promising antitumor activity.32
In the current study, we examined the ex vivo and in vivo effects of VLS-101 in RS-patient–derived xenograft (PDX; RS-PDX) models with different levels of ROR1 expression.
These findings document the presence of the oncofetal protein ROR1 on the surface of RS cells, indicate that ROR1 represents a novel therapeutic target for delivery of an ADC, and support the translation of this approach into the clinic in patients with ROR1-expressing RS.
Materials and methods
VLS-101 generation
VLS-101 comprises UC-961, a proteolytically cleavable linker, and the antimicrotubule cytotoxic agent MMAE. The protocol to generate the ADC is described in supplemental Materials and methods (available on the Blood Web site).
VLS-101 cellular binding
A binding assay of the naked antibody (UC-961) and the ADC (VLS-101) to the ROR1+ MCL cell line (JeKo-1) and primary CLL cells, obtained from different patients, was performed. Cells were incubated with serial dilutions of drugs and assessed by flow cytometry for drug binding. Half-maximal effective concentration (EC50) values were calculated as described in supplemental Materials and methods.
VLS-101 internalization
To determine whether UC-961 and VLS-101 internalize similarly into cells, experiments were performed on the ROR1+ MCL cell line, JeKo-1, and in primary cells purified from patients with CLL. Cells were incubated with each drug and the proportion of cell-surface drug remaining over a 4-hour time course was evaluated by flow cytometry as detailed in supplemental Materials and methods.
PDX models
Four different RS-PDX models were used. RS9737 and RS1316 were previously fully genetically characterized, whereas RS1050 and IP867/17 were more recently established using the same experimental approach. Genetic features of these models are reported in supplemental Table 1 and supplemental Figure 1: of note, both of them are characterized by a biallelic inactivation of TP53 (point mutations and 17p deletion), and IP867/17 carries an amplification of region 8q24 involving the MYC gene.33 Three of the models (RS9737, RS1316, and RS1050) were established from patients who had undergone extensive prior therapy and were resistant to conventional chemotherapy and/or targeted therapies (including rituximab plus cyclophosphamide, doxorubicin, vincristine, and prednisone [R-CHOP] and ibrutinib). In contrast, IP867/17 was established from a therapy-naive patient.
All of the RS-PDX models maintain the same genetic and phenotypic features of the primary samples and are stable over time. Specifically, in all cases, the B-cell receptor (BCR) rearrangement is the same as that of the primary sample: the immunoglobulin heavy-chain genes expressed by the cells are reported in supplemental Table 2. In addition, the majority of the single- or multinucleotide variants of the 4 PDX models were already present in the primary samples (supplemental Table 3). A further confirmation of the consistency of these PDX models was highlighted by an unsupervised analysis of the transcriptomic profile, showing a clear clustering between primary samples and their corresponding PDX (supplemental Figure 2). Lastly, for the 2 novel RS-PDX models, the immunophenotype is shown in supplemental Figure 3. All PDX models are Epstein-Barr virus negative (supplemental Figure 4).
ROR1 expression by flow cytometry, immunoblotting, qRT-PCR, and IHC
ROR1 expression was assessed by flow cytometry using an anti-ROR1 UC-961-fluorescein isothiocyanate–conjugated antibody (provided by VelosBio) on RS cells purified from tumor masses. Expression of the protein was also evaluated by western blotting, IHC staining, and quantitative reverse transcription polymerase chain reaction (qRT-PCR; full details are reported in supplemental Materials and methods).
Primary samples of lymph node or bone marrow (BM) biopsies obtained from patients diagnosed with RS were also analyzed, by IHC, as detailed in supplemental Materials and methods.
ROR1 signaling in RS cells
The ROR1-signaling pathway was analyzed as described in supplemental Materials and methods.
In vivo experiments
For the subcutaneous engraftment experiments, RS cells (5 × 10⁶) were resuspended in Matrigel (Becton Dickinson, Milan, Italy), injected (double flank) into 8-week-old NOD/SCID/γ-chain−/− (NSG) mice, and left to engraft. When a mass could be detected (volume of ∼0.2 cm3), mice were randomly assigned to one of the following treatment groups: vehicle (phosphate-buffered saline [PBS]), VLS-101 2.5 mg/kg, or VLS-101 5 mg/kg. Tumor masses were measured by caliper 1 to 2 times per week. Mice were euthanized when tumor mass volumes exceeded 1.5 cm3.
For the systemic models, RS cells (1 × 10⁷) were resuspended in PBS and injected into the tail vein of NSG mice. After 10 to 14 days of engraftment, mice were randomly assigned to treatment with vehicle (PBS), VLS-101 2.5 mg/kg, or VLS-101 5 mg/kg. In indicated experiments, all mice were euthanized at the end of treatment and peripheral blood (PB), kidneys, spleen, BM, lung, liver, and brain were collected to evaluate disease spread by flow cytometry, using anti-human antibodies (CD45PerCPCy5.5 and CD19APC; Becton Dickinson). Sectioned portions of each organ were formalin-fixed and paraffin-embedded and localization of tumor cells was confirmed by IHC. In other experiments, after treatment administration, all mice were monitored for survival and euthanized when showing a clear disease-related morbidity (weight loss >20% or distress).
Treatment was administered IV every 4 days for 6 total infusions. The adopted schedule was based on VLS-101 pharmacokinetics data, showing an ∼2.5-day half-life for this ADC and on its cellular 50% inhibitory concentration (∼11-30 μg/mL), as detailed in supplemental Materials and methods and supplemental Tables 4 and 5. In 1 experiment, the UC-961 antibody at 10 mg/kg or PBS were administered IV every 7 days for 4 total infusions.
The institutional animal care and use committee approved these experiments. Mice were treated following European guidelines for animal use in scientific research and with the approval of the Italian Ministry of Health (authorization #116/2018-PR; protocol #CC652.75).
Statistical analysis
Statistical analyses were performed with GraphPad v6 (GraphPad Software, La Jolla, CA). Differences were considered significant when P values were ≤.05.
Additional materials and methods are provided in supplemental Materials and methods.
Results
VLS-101 is an ADC that targets ROR1 to deliver MMAE
VLS-101 is an ADC comprising the humanized IgG1 monoclonal antibody UC-961, a proteolytically cleavable maleimidocaproyl-valine-citrulline-para-aminobenzoate (mc-vc-PAB) linker, and the antimicrotubule cytotoxic agent MMAE (Figure 1A). The UC-961 antibody is conjugated to the linker and toxin via thioether bonds. On average, each antibody molecule undergoes reduction of 2 of its interchain disulfides and the resulting cysteine residues are alkylated with mc-vc-PAB-MMAE. An average of 2 interchain disulfides per molecule are left intact. One drug-conjugation site is located in the light chain and 3 conjugation sites are located in the heavy chain, resulting in multiple active forms with up to 8 possible conjugation sites per antibody and an average drug-to-antibody ratio (DAR) of 4 with a distribution from 0 to 8 (Figure 1B).
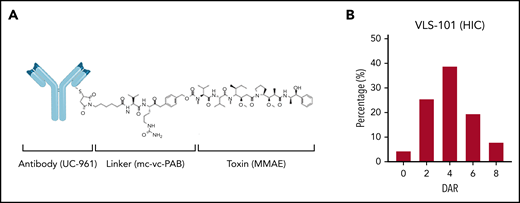
VLS-101 structure and its HIC profile. (A) VLS-101 is composed of the anti-ROR1 antibody, UC-961, conjugated to the antimicrotubule cytotoxic agent MMAE by a proteolytically cleavable mc-vc-PAB linker. (B) DAR of VLS-101, as analyzed by HIC, displaying an average DAR of 4 and a distribution from 0 to 8. DAR, drug-antibody ratio; HIC, hydrophobic interaction chromatography; mc-vc-PAB, maleimidocaproyl-valine-citrulline-para-aminobenzoate.
VLS-101 structure and its HIC profile. (A) VLS-101 is composed of the anti-ROR1 antibody, UC-961, conjugated to the antimicrotubule cytotoxic agent MMAE by a proteolytically cleavable mc-vc-PAB linker. (B) DAR of VLS-101, as analyzed by HIC, displaying an average DAR of 4 and a distribution from 0 to 8. DAR, drug-antibody ratio; HIC, hydrophobic interaction chromatography; mc-vc-PAB, maleimidocaproyl-valine-citrulline-para-aminobenzoate.
VLS-101 and UC-961 bind and internalize into tumor cells
Binding assays demonstrated that UC-961 and VLS-101 showed comparable binding profiles both in the ROR1+ MCL cell line and in primary CLL cells tested, with EC50 values that were universally <50 ng/mL (Table 1).
Cell binding of UC-961 and VLS-101
| ROR1+ cell line | Cancer type | UC-961 EC50, ng/mL | VLS-101 EC50, ng/mL |
|---|---|---|---|
| JeKo-1 | MCL | 17.0 | 13.6 |
| Patient sample #1 | CLL | 14.2 | 17.4 |
| Patient sample #2 | CLL | 16.8 | 18.9 |
| Patient sample #3 | CLL | 13.3 | 14.4 |
| ROR1+ cell line | Cancer type | UC-961 EC50, ng/mL | VLS-101 EC50, ng/mL |
|---|---|---|---|
| JeKo-1 | MCL | 17.0 | 13.6 |
| Patient sample #1 | CLL | 14.2 | 17.4 |
| Patient sample #2 | CLL | 16.8 | 18.9 |
| Patient sample #3 | CLL | 13.3 | 14.4 |
Cultured ROR1+ JeKo-1 cell line and 3 ROR1+ primary CLL patient samples were harvested and incubated at 4°C with UC-961 or VLS-101 followed by a fluorophore-conjugated secondary antibody and viability staining, and then analyzed by flow cytometry. The table provides the EC50 of the viable cell population. Comparable data were obtained from at least 3 independent experiments.
Comparable time- and temperature-dependent internalization of UC-961 and VLS-101 were observed in the JeKo-1 cell line and in primary CLL cells (Table 2), with ∼80% and 90% disappearance of drugs from the cell surface after 4 hours at 37°C, respectively, whereas no change occurred at 4°C. These results demonstrate that both the naked antibody (UC-961) and the ADC (VLS-101) equally and efficiently internalize into target cells, supporting the ability of VLS-101 to deliver a conjugated cytotoxin.
Internalization of UC-961 and VLS-101 into tumor cells
| Time, h | % ROR1 cell-surface receptor relative to time 0 | ||||
|---|---|---|---|---|---|
| UC-961, mean ± SD | VLS-101, mean ± SD | ||||
| Jeko-1 | Primary CLL | Jeko-1 | Primary CLL | ||
| 0 | 100.0 ± 0 | 100.0 ± 0 | 100.0 ± 0 | 100 ± 0 | |
| 0.5 | 60.7 ± 9.3 | 40.5 ± 7.0 | 54.1 ± 1.9 | 37.7 ± 4.5 | |
| 1 | 53.0 ± 5.6 | 35.0 ± 4.2 | 48.7 ± 4.7 | 30.7 ± 1.5 | |
| 2 | 45.0 ± 5.0 | 29.0 ± 3.1 | 42.2 ± 6.4 | 26.0 ± 1.7 | |
| 4 | 23.3 ± 7.2 | 12.0 ± 1.5 | 22.7 ± 7.7 | 10.0 ± 3.6 | |
JeKo-1 or CLL cells were harvested and incubated at 4°C with saturating concentrations of UC-961 or VLS-101 (60 µg/mL), washed, and then incubated at 37°C for the indicated times (h). After incubation, cells were washed and stained with a fluorophore-conjugated secondary antibody and then analyzed by flow cytometry. The degree of receptor internalization was determined using the amount of UC-961 or VLS-101 present at each time point when compared with the amount of receptor present at time 0 in 2 independent experiments for the JeKo-1 cells and 3 different primary CLL patient samples.
SD, standard deviation.
ROR1 is expressed at variable levels in RS-PDX–derived cells
In this cohort of RS-PDX–derived cells, ROR1 was expressed at varying levels as assessed by flow cytometry, with IP867/17, RS1316, RS1050, and RS9737 showing very high, high, intermediate, or minimal expression, respectively (Figure 2A). Moreover, its expression on RS-PDXs was stable over time as indicated by the narrow variability of the bar plots (Figure 2A) and by overlapping profiles when comparing RS cells purified from different in vivo passages (supplemental Figure 5). IHC, western blotting, and qRT-PCR confirmed the different levels of ROR1 expression among the models (Figure 2B-C).
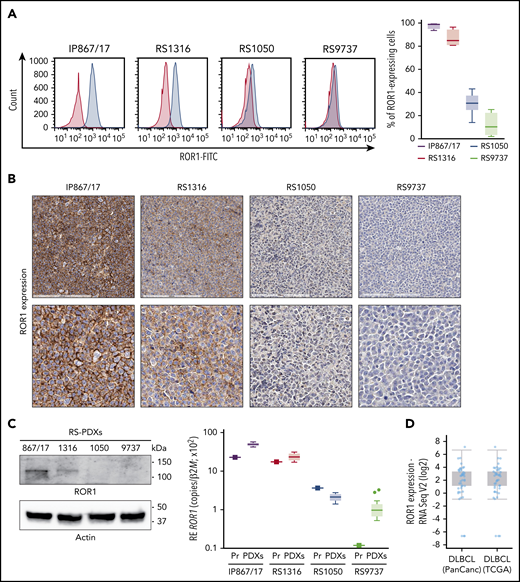
Expression of ROR1 in RS-PDX models and in DLBCL in TCGA data sets. (A) Representative histogram plots and a cumulative ROR1+ cells (%, n = 4) box plot, obtained by measuring ROR1 expression in RS cells after in vivo growth. Box plots show the distribution of values: median, interquartile range, minimum and maximum values. ROR1 expression was analyzed by flow cytometry using a specific anti-human ROR1 antibody in the 4 RS-PDX models available. RS-PDXs are represented with the indicated color coding. (B) IHC analysis of ROR1 expression in tissue sections of tumor masses obtained from the RS-PDXs using an anti-ROR1 antibody (mouse clone OTI3D11). Slides were developed with DAB (3,3'‑diaminobenzidine) and counter-stained with hematoxylin and eosin. Slides were scanned using an Aperio AT Turbo system to produce whole slide images. A .jpeg image of each stain is shown. Original magnification ×20 (top panel) and ×40 (bottom panel). (C) Western blots and qRT-PCR data showing the expression of ROR1. Actin was used as a loading control in western blot. qRT-PCR data (from primary RS samples and at least 4 different tumor masses) are reported as relative expression (RE) of the target gene over β2-microglobulin (B2M). Box plots show the distribution of values: median, interquartile range, minimum and maximum values (Tukey representation). Squares represent the primary samples. (D) Expression of ROR1 obtained from RNA-sequencing (RNA Seq) data in large data sets of DLBCL samples. Data are reported in The Cancer Genome Atlas (TCGA). Box plots show the distribution of values: median, interquartile range, minimum and maximum values. FITC, fluorescein isothiocyanate; PanCanc, pan cancer; Pr, primary samples.
Expression of ROR1 in RS-PDX models and in DLBCL in TCGA data sets. (A) Representative histogram plots and a cumulative ROR1+ cells (%, n = 4) box plot, obtained by measuring ROR1 expression in RS cells after in vivo growth. Box plots show the distribution of values: median, interquartile range, minimum and maximum values. ROR1 expression was analyzed by flow cytometry using a specific anti-human ROR1 antibody in the 4 RS-PDX models available. RS-PDXs are represented with the indicated color coding. (B) IHC analysis of ROR1 expression in tissue sections of tumor masses obtained from the RS-PDXs using an anti-ROR1 antibody (mouse clone OTI3D11). Slides were developed with DAB (3,3'‑diaminobenzidine) and counter-stained with hematoxylin and eosin. Slides were scanned using an Aperio AT Turbo system to produce whole slide images. A .jpeg image of each stain is shown. Original magnification ×20 (top panel) and ×40 (bottom panel). (C) Western blots and qRT-PCR data showing the expression of ROR1. Actin was used as a loading control in western blot. qRT-PCR data (from primary RS samples and at least 4 different tumor masses) are reported as relative expression (RE) of the target gene over β2-microglobulin (B2M). Box plots show the distribution of values: median, interquartile range, minimum and maximum values (Tukey representation). Squares represent the primary samples. (D) Expression of ROR1 obtained from RNA-sequencing (RNA Seq) data in large data sets of DLBCL samples. Data are reported in The Cancer Genome Atlas (TCGA). Box plots show the distribution of values: median, interquartile range, minimum and maximum values. FITC, fluorescein isothiocyanate; PanCanc, pan cancer; Pr, primary samples.
The heterogeneous ROR1 expression in these RS cell lines is consistent with recent data from a large series of patients with CLL16 and also from a DLBCL cohort included in The Cancer Genome Atlas (TCGA) database (http://www.cbioportal.org; Figure 2D).34,35
In lymph node or BM biopsies obtained from patients with RS, ROR1 was not homogeneously expressed. Some patients were characterized by strong ROR1 expression as evidenced by high H scores, others presented intermediate ROR1 expression, whereas in others, ROR1 was undetectable with an H score of 0 (Figure 3). These results suggest that when a validated clinical assay becomes available, evaluating ROR1 may be useful to identify patients with RS who might benefit from selective ROR1 targeting.
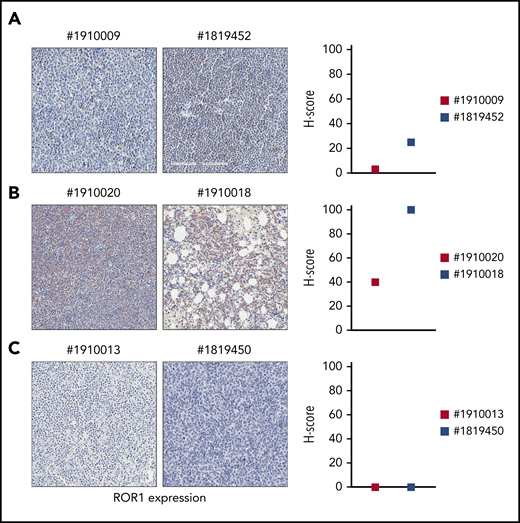
ROR1 expression on primary RS samples. ROR1 expression was analyzed by IHC staining in primary samples of BM or lymph node biopsies from patients with RS using an anti-ROR1 antibody (mouse clone OTI3D11). Slides were scanned using an Aperio AT Turbo system to produce whole slide images. Slides were developed with DAB (3,3'‑diaminobenzidine) and counter-stained with hematoxylin and eosin. (A-C) A .jpeg image of each stain is shown. Original magnification ×20. An H score (range of 0-300) was calculated based on the summation of the product of the percentage of cells stained at each intensity using the following equation: (3 × % cells staining at 3+) + (2 × % cells staining at 2+) + (1 × % cells staining at 1+) to estimate ROR1 expression. ROR1 was heterogeneously expressed, ranging from highly positive to completely negative cases. Primary samples with an intermediate expression of ROR1 (A); with a high expression of ROR1 (B); and with no ROR1 expression (C).
ROR1 expression on primary RS samples. ROR1 expression was analyzed by IHC staining in primary samples of BM or lymph node biopsies from patients with RS using an anti-ROR1 antibody (mouse clone OTI3D11). Slides were scanned using an Aperio AT Turbo system to produce whole slide images. Slides were developed with DAB (3,3'‑diaminobenzidine) and counter-stained with hematoxylin and eosin. (A-C) A .jpeg image of each stain is shown. Original magnification ×20. An H score (range of 0-300) was calculated based on the summation of the product of the percentage of cells stained at each intensity using the following equation: (3 × % cells staining at 3+) + (2 × % cells staining at 2+) + (1 × % cells staining at 1+) to estimate ROR1 expression. ROR1 was heterogeneously expressed, ranging from highly positive to completely negative cases. Primary samples with an intermediate expression of ROR1 (A); with a high expression of ROR1 (B); and with no ROR1 expression (C).
The ROR1-signaling pathway shows limited activity in RS, but the receptor represents a good ADC target
Our findings of protein expression in RS cells suggest that ROR1 represents an appealing therapeutic target in the disease. However, pathway and functional analyses using RS cells indicate that the signaling capability of ROR1 is lower in RS cells compared with CLL cells, with heterogenous levels of phosphorylation of known ROR1 targets, including NF-κB, Jnk, and Akt pathways, among the RS-PDX models (supplemental Figure 6A). Similar results were obtained when analyzing the guanosine triphosphate/guanosine diphosphate exchange factors, Rac1 and RhoA, which were expressed at variable levels in these models (supplemental Figure 6B-C). Specifically, the very high and high ROR1 models, IP867/17 and RS1316, showed only mild activation of RhoA and Rac1, respectively, whereas no activation was detected in the RS1050 model with intermediate ROR1 expression (Figure 4A).
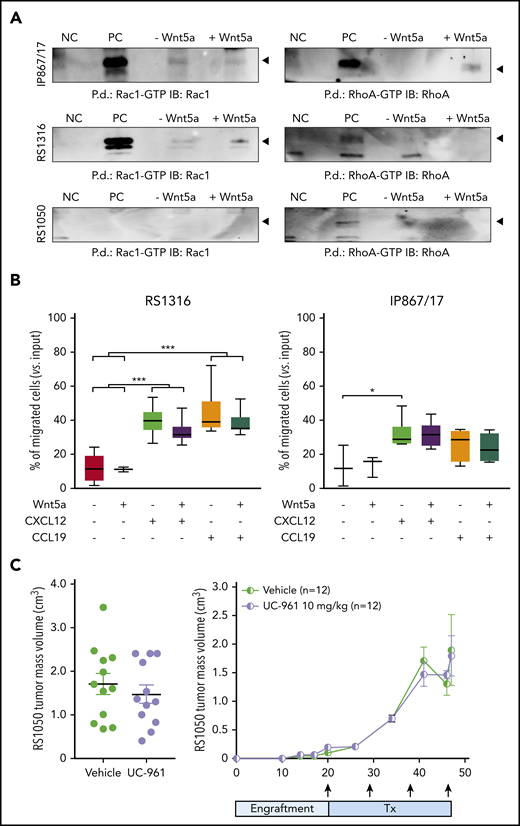
Signaling properties of ROR1 in RS cells and targeting with UC-961 antibody. (A) Pull-down (P.d.) assays were performed to study the activation of Rac1 and RhoA in the presence/absence of Wnt5a in the RS-PDX models. (B) Chemotaxis of RS1316 and IP867/17 PDX-derived cells in response to CXCL12 or CCL19 chemokines, used alone or in the presence of Wnt5a (≥3 independent experiments). Data are reported as percentage of migrated cells, calculated as number of migrated cells over the total number of cells seeded in the upper chamber of the Boyden chamber. Statistical analysis was performed using the Mann-Whitney test. Box plots show the distribution of values: median, interquartile range, minimum and maximum values. *P < .05; ***P < .001. (C) ROR1 targeting with UC-961 antibody, which prevents the binding of Wnt5a to ROR1, in a subcutaneous model of RS-PDX. Tumor volume (day 47; left panel) and growth kinetics (right panel) are depicted. Arrows indicate treatment (Tx) administration. Mean and standard deviation are displayed in both graphs. Statistical analysis was performed using the Mann-Whitney test; results were nonsignificant. GTP, guanosine triphosphate; IB, immunoblot; NC, negative control; PC, positive control.
Signaling properties of ROR1 in RS cells and targeting with UC-961 antibody. (A) Pull-down (P.d.) assays were performed to study the activation of Rac1 and RhoA in the presence/absence of Wnt5a in the RS-PDX models. (B) Chemotaxis of RS1316 and IP867/17 PDX-derived cells in response to CXCL12 or CCL19 chemokines, used alone or in the presence of Wnt5a (≥3 independent experiments). Data are reported as percentage of migrated cells, calculated as number of migrated cells over the total number of cells seeded in the upper chamber of the Boyden chamber. Statistical analysis was performed using the Mann-Whitney test. Box plots show the distribution of values: median, interquartile range, minimum and maximum values. *P < .05; ***P < .001. (C) ROR1 targeting with UC-961 antibody, which prevents the binding of Wnt5a to ROR1, in a subcutaneous model of RS-PDX. Tumor volume (day 47; left panel) and growth kinetics (right panel) are depicted. Arrows indicate treatment (Tx) administration. Mean and standard deviation are displayed in both graphs. Statistical analysis was performed using the Mann-Whitney test; results were nonsignificant. GTP, guanosine triphosphate; IB, immunoblot; NC, negative control; PC, positive control.
RS cell chemotaxis in response to CXCL12 and CCL19 was heterogeneous, with marked responses to both chemokines in RS1316 and IP867/17 (Figure 4B) and limited responses in RS1050 and RS9737 (supplemental Figure 7). In all models tested, addition of Wnt5a did not result in significant enhancement of the chemotactic behavior of RS cells, independent of ROR1 expression (Figure 4B; supplemental Figure 7).
Similarly, ex vivo exposure of RS cells to Wnt5a did not induce any significant enhancement in RS cell proliferation. Given the limited proliferation rate of these cells in culture, we moved to in vivo conditions, exploiting a subcutaneous RS-PDX model. In line with the in vitro data, treatment with the naked UC-961 antibody did not reduce tumor proliferation relative to vehicle and there were no significant differences in tumor volume or survival between the animals (Figure 4C).
These results demonstrate that ROR1 has a limited role as a signaling molecule in RS and that the naked antibody is ineffective, prompting us to explore alternative strategies to harness UC-961 to target ROR1 and treat RS. Rather than interfering with ROR1 signaling, we used VLS-101 to bind to the receptor, enter the cell, and release a cytotoxic payload.
VLS-101 induces cell-cycle arrest and apoptosis in RS cells ex vivo
First, we studied the effects induced by VLS-101 in an ex vivo setting. In keeping with the activity of the MMAE toxin, which blocks tubulin, VLS-101 caused cell-cycle arrest, with cells accumulating in the S and G2/M phases starting 48 hours posttreatment. Concomitantly, cells in the G0/G1 phase significantly decreased and the apoptotic population increased (Figure 5A).
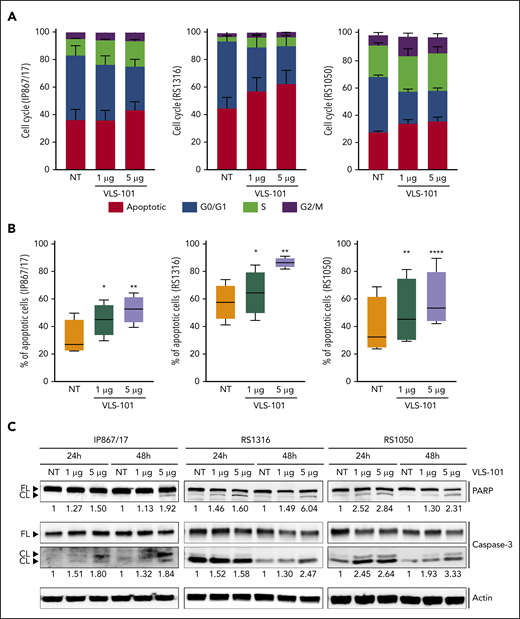
Ex vivo effects of VLS-101 on RS cells. (A-B) Cell-cycle (A) and cell-viability (B) analyses, obtained by flow cytometry, after ex vivo incubation of RS cells from the 3 ROR1-expressing RS-PDX models (IP867/17, RS1316, and RS1050) with VLS-101 at the indicated doses for 72 hours and 48 hours, respectively (data from at least 3 independent experiments). Data are reported as a percentage of cells in the different cell-cycle phases (mean with standard error of the mean) (A) or percentage of apoptotic cells (B) and statistical analyses performed using the paired Student t test. Box plots of apoptotic data show the distribution of values: median, interquartile range, minimum and maximum values. (C) Western blot confirmation of the activation of the apoptotic cascade, by checking cleavage of poly (ADP-ribose) polymerase (PARP) and caspase-3, in RS cells treated ex vivo with VLS-101 at the indicated doses at 24 and 48 hours of exposure. Actin was used as a loading control. Numbers below bands indicate the mean fold change of VLS-101–treated cells over vehicle-treated ones (3 independent experiments). The fold change was calculated as follows: intensity of cleaved band over intensity of full-length band, both normalized over actin band. *P < .05; **P < .01; ***P < .001; ****P < .0001. CL, cleaved; FL, full-length; NT, vehicle-treated samples.
Ex vivo effects of VLS-101 on RS cells. (A-B) Cell-cycle (A) and cell-viability (B) analyses, obtained by flow cytometry, after ex vivo incubation of RS cells from the 3 ROR1-expressing RS-PDX models (IP867/17, RS1316, and RS1050) with VLS-101 at the indicated doses for 72 hours and 48 hours, respectively (data from at least 3 independent experiments). Data are reported as a percentage of cells in the different cell-cycle phases (mean with standard error of the mean) (A) or percentage of apoptotic cells (B) and statistical analyses performed using the paired Student t test. Box plots of apoptotic data show the distribution of values: median, interquartile range, minimum and maximum values. (C) Western blot confirmation of the activation of the apoptotic cascade, by checking cleavage of poly (ADP-ribose) polymerase (PARP) and caspase-3, in RS cells treated ex vivo with VLS-101 at the indicated doses at 24 and 48 hours of exposure. Actin was used as a loading control. Numbers below bands indicate the mean fold change of VLS-101–treated cells over vehicle-treated ones (3 independent experiments). The fold change was calculated as follows: intensity of cleaved band over intensity of full-length band, both normalized over actin band. *P < .05; **P < .01; ***P < .001; ****P < .0001. CL, cleaved; FL, full-length; NT, vehicle-treated samples.
Exposure of ROR1+ RS cells to increasing concentrations of VLS-101 induced dose-dependent apoptosis peaking at 72 hours posttreatment (Figure 5B). VLS-101–mediated apoptosis in RS cells was confirmed at the biochemical level, in independent experiments, by showing an increase in the cleavage of caspase-3 and poly (ADP-ribose) polymerase in all ROR1+ models analyzed, more pronounced at the higher dose (Figure 5C). In contrast, the viability of the relatively ROR1− RS model (RS9737) was unaffected by treatment with the ADC (supplemental Figure 8).
VLS-101 significantly blocks in vivo tumor growth in subcutaneous RS-PDX models
The efficacy of VLS-101 was then tested in an in vivo setting. In the very highly ROR1+ RS-PDX model (IP867/17), VLS-101 was administered at 2.5 or 5 mg/kg every 4 days for 3 weeks. At the end of the 3 weeks, vehicle-treated animals showed tumor masses with a mean volume of 4 cm3, whereas tumor masses were only barely palpable (0.5 cm3) or completely absent in animals treated with VLS-101 at 2.5 mg/kg or 5 mg/kg, respectively (Figure 6A, left panel). Mice were then monitored over a period of 120 days for tumor regrowth. All animals treated with the 2.5 mg/kg dose relapsed and were euthanized by 40 days after discontinuation of treatment, whereas mice treated with the 5 mg/kg dose remained tumor-free at the end of posttreatment observation (73 days after discontinuation of treatment), with only 1 of 6 mice (17%) showing tumor regrowth in a single flank (Figure 6A, middle panel).
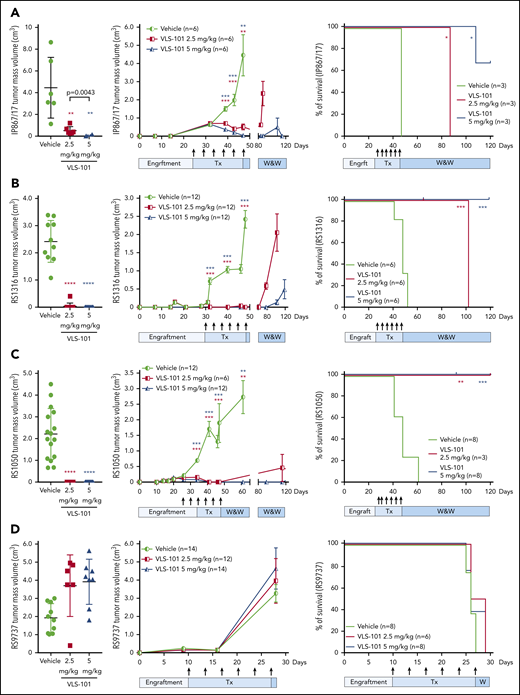
VLS-101 inhibits tumor growth in subcutaneous RS-PDX models. For the RS-PDX models IP867/17 (A), RS1316 (B), RS1050 (C), and RS9737 (D), RS cells were subcutaneously injected into both flanks of NSG mice. After palpable tumors were evident (tumor volume of ∼0.2 cm3), animals were randomly assigned to vehicle, VLS 101 2.5 mg/kg or VLS-101 5 mg/kg. Drugs were administered IV every 4 days as indicated by arrows (Tx) and mice were monitored for tumor growth in a watch-and-wait (W&W) period after the conclusion of therapy. Tumor masses were measured using a digital caliper. Left panels display individual mean and standard deviation values for tumor masses at the end of treatment on days 47 (A), 48 (B), 47 (C), and 28 (D) with data evaluated using Mann-Whitney tests. Center panels display mean and standard error of the mean values for tumor masses with data evaluated using the multiple-sample Student t tests. Right panels display Kaplan-Meier survival curves for mice with tick marks indicating censored values and comparisons analyzed with log-rank Mantel-Cox tests. In all figures, comparisons are to vehicle treatment. *P < .05; **P < .01; ***P < .001; ****P < .0001.
VLS-101 inhibits tumor growth in subcutaneous RS-PDX models. For the RS-PDX models IP867/17 (A), RS1316 (B), RS1050 (C), and RS9737 (D), RS cells were subcutaneously injected into both flanks of NSG mice. After palpable tumors were evident (tumor volume of ∼0.2 cm3), animals were randomly assigned to vehicle, VLS 101 2.5 mg/kg or VLS-101 5 mg/kg. Drugs were administered IV every 4 days as indicated by arrows (Tx) and mice were monitored for tumor growth in a watch-and-wait (W&W) period after the conclusion of therapy. Tumor masses were measured using a digital caliper. Left panels display individual mean and standard deviation values for tumor masses at the end of treatment on days 47 (A), 48 (B), 47 (C), and 28 (D) with data evaluated using Mann-Whitney tests. Center panels display mean and standard error of the mean values for tumor masses with data evaluated using the multiple-sample Student t tests. Right panels display Kaplan-Meier survival curves for mice with tick marks indicating censored values and comparisons analyzed with log-rank Mantel-Cox tests. In all figures, comparisons are to vehicle treatment. *P < .05; **P < .01; ***P < .001; ****P < .0001.
In the RS1316 model expressing ROR1 at high levels, VLS-101 administration for 3 weeks resulted in complete inhibition of tumor growth, with no detectable tumor masses in VLS-101–treated animals at both doses compared with vehicle-treated mice (Figure 6B, left panel). When monitoring mice posttreatment, in the VLS-101 2.5 mg/kg group, tumor regrowth was observed at 30 days after discontinuation of treatment, with all animals euthanized by the end of posttreatment observation (tumor mass mean volume of 2.0 cm3). In contrast, the majority of the mice in the higher-dose group were disease-free at the end of posttreatment observation, with only very small tumor masses (mean, <0.5 cm3) in a single flank in 4 of 12 mice (33%) (Figure 6B, middle panel).
Similar to the RS1316 model, RS1050-injected mice (intermediate ROR1 expression) showed complete tumor regressions upon completion of treatment with VLS-101 2.5 or 5 mg/kg (Figure 6C, left panel). In contrast to the previous models, VLS-101 was able to induce durable tumor responses even at the lower dose in the RS1050 model, with no evidence of disease relapse at 73 days after discontinuation of treatment in all mice, expect for a single flank in 1 of 6 mice (17%) (Figure 6C, middle panel).
All of the ROR1+ RS-PDX models displayed rapid tumor growth kinetics and vehicle-treated mice died due to disease burden by 45 to 60 days after tumor cell injection. In all ROR1+ models, VLS-101 caused a statistically significant increase in survival at both dose levels, as shown by Kaplan-Meier curves (Figure 6A-C, right panels). In the highest ROR1-expressing models, IP867/17 and RS1316, the 2.5 mg/kg dose, while resulting in significant decreases in tumor volume, did not completely eradicate the disease and mice were ultimately euthanized at respective ∼90 and 110 days after tumor cell injection because of off-therapy growth of tumor volumes to the ethically allowable limits. However, in both of these models, the 5 mg/kg VLS-101 dose was able to induce prolonged tumor suppression, with the majority of mice (67% and 100%, respectively, by model) remaining tumor-free off of therapy at the end of the observation period (120 days after tumor cell injection). Of interest, mice bearing RS1050, characterized by intermediate ROR1 expression, showed no relapse after discontinuation of VLS-101 treatment, independent of the dose level administered (Figure 6C, right panel).
To determine whether tumor regrowth after discontinuation of treatment was due to downmodulation of ROR1 on the cell surface of RS cells during VLS-101 administration, we compared ROR1 expression on tumor masses obtained from vehicle- and VLS-101–treated mice, observing comparable ROR1-expression levels (supplemental Figure 9). These findings suggest that tumor regrowth may be due to insufficient delivery of toxin.
Contrasting with the VLS-101 efficacy observed in RS-PDXs expressing higher levels of ROR1, VLS-101 at 2.5 or 5 mg/kg did not inhibit tumor growth in the relatively ROR1− RS9737 model (Figure 6D, left panel). Tumor masses continued to grow similarly to vehicle-treated mice (Figure 6D, middle panel), confirming the selectivity of the ADC. At the end of treatment, all mice were euthanized due to disease burden, with no differences in tumor growth kinetics or survival among the groups (Figure 6D).
Independent of the RS-PDX model tested, VLS-101 appeared well tolerated, with no signs of toxicity as indicated by a lack of distress and no body weight loss during treatment.
Anti-ROR1 ADC treatment prolongs in vivo survival in systemic RS-PDX models
We then evaluated ROR1-targeted therapy in systemic models more representative of human RS. In these models, RS1316 and RS1050 cells were IV injected and allowed to engraft for 10 to 14 days before randomization and initiation of treatment.
In the first set of experiments, after treatment with VLS-101 2.5 or 5.0 mg/kg every 4 days for a total of 6 administrations, disease spreading was evaluated. RS1316 xenografts homed mainly to the spleen, BM, and PB, with some involvement of the liver and brain. Treatment with VLS-101 induced dramatic decreases in RS cells to almost undetectable levels in all compartments, reaching statistical significance in the spleen, BM, and PB. Results were comparable in both VLS-101–treated groups (Figure 7A).
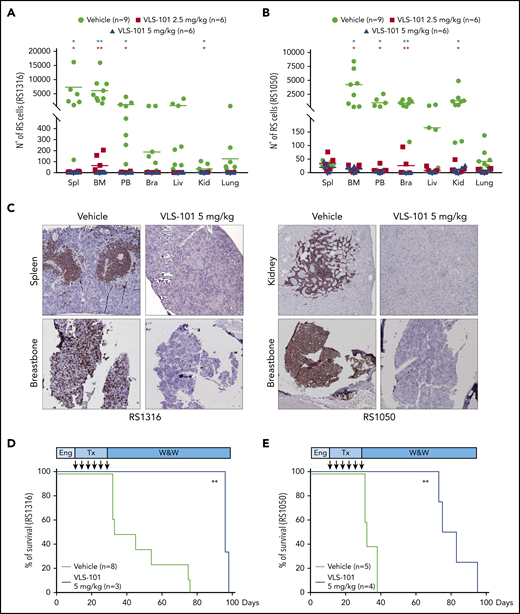
VLS-101 blocks tumor growth and prolongs survival in a systemic model of RS. RS cells were IV injected, left to engraft and mice were randomly assigned to treatment with vehicle, VLS-101 2.5 mg/kg, or VLS-101 5.0 mg/kg every 4 days for a total of 6 doses. At the end of drug administration, mice were evaluated for disease spreading to target organs by tracing RS cells by flow cytometry. (A-B) Data from RS1316 (A) and RS1050 (B) are shown. Data are reported as scattered plot with mean values. Statistical analyses were performed using a multiple Student t test. (C) Results were confirmed also by IHC staining using an anti-CD20 antibody to mark RS cells. Slides were developed with DAB (3,3'‑diaminobenzidine) and counter-stained with hematoxylin and eosin. Images were acquired with an AXIO Laboratory.A1 microscope (Zeiss), equipped with a Canon EOS600D reflex camera; original magnification ×20. (D-E) In another set of experiments, injected mice were assessed for survival after 1 cycle of treatment (Tx) with vehicle or VLS-101. Kaplan-Meier curves of RS1316 (D) and RS1050 (E) are reported and statistical analyses for survival were made using log-rank Mantel-Cox test. Bra, brain; Eng, engraftment; Kid, kidney; Liv, liver; Spl, spleen; W&W, watch and wait. *P < .05; **P < .01.
VLS-101 blocks tumor growth and prolongs survival in a systemic model of RS. RS cells were IV injected, left to engraft and mice were randomly assigned to treatment with vehicle, VLS-101 2.5 mg/kg, or VLS-101 5.0 mg/kg every 4 days for a total of 6 doses. At the end of drug administration, mice were evaluated for disease spreading to target organs by tracing RS cells by flow cytometry. (A-B) Data from RS1316 (A) and RS1050 (B) are shown. Data are reported as scattered plot with mean values. Statistical analyses were performed using a multiple Student t test. (C) Results were confirmed also by IHC staining using an anti-CD20 antibody to mark RS cells. Slides were developed with DAB (3,3'‑diaminobenzidine) and counter-stained with hematoxylin and eosin. Images were acquired with an AXIO Laboratory.A1 microscope (Zeiss), equipped with a Canon EOS600D reflex camera; original magnification ×20. (D-E) In another set of experiments, injected mice were assessed for survival after 1 cycle of treatment (Tx) with vehicle or VLS-101. Kaplan-Meier curves of RS1316 (D) and RS1050 (E) are reported and statistical analyses for survival were made using log-rank Mantel-Cox test. Bra, brain; Eng, engraftment; Kid, kidney; Liv, liver; Spl, spleen; W&W, watch and wait. *P < .05; **P < .01.
RS1050 was mainly characterized by localization of tumor cells in the BM, PB, brain, and kidneys. In this model, treatment with VLS-101 resulted in significant reductions of disease burden in all compartments, at both doses administered (Figure 7B).
These results were confirmed by IHC staining with an anti-CD20 antibody. Vehicle-treated mice presented a high disease burden in the spleen/kidneys and breastbone, considered a surrogate for the BM, whereas no or very limited anti-CD20 staining was present in these compartments in VLS-101–treated mice (Figure 7C).
VLS-101 significantly prolonged animal survival as shown by Kaplan-Meier analysis. When compared with vehicle, VLS-101 extended lifespan in the RS1316 model by a median of 22 days (P < .0066) and by a median of 57 days (P < .006; Figure 7E) in the RS1050 model.
Collectively, these data demonstrate the efficacy of VLS-101 ADC in RS-PDX models and strongly suggest that ROR1 may be targeted to treat patients with RS.
Discussion
RS is a rare and life-threatening complication of CLL involving the development of an aggressive lymphoma, typically DLBCL.36 Debate is still open on whether BCR antagonists and Bcl-2 inhibitors, increasingly used in the management of CLL patients, will modify the incidence of the disease or contribute to clonal selection.22 From a genetic point of view, ∼50% of patients with RS carry inactivating mutations/deletions in TP53. Other recurrent genetic defects include NOTCH1 and CDKN2A mutations. The clinical outcome is influenced by the clonal relationship to the precedent CLL, with clonally related patients demonstrating inferior responses to treatment and having a worse prognosis.18 No therapies are approved for RS and therapies targeting BCR or Bcl-2 are largely ineffective for these patients.37
PDXs are highly informative tools for studying the genetic architecture, mutation hierarchy, and molecular pathways of cancer cells. Moreover, PDXs represent a successful platform for uncovering potentially actionable drug candidates and for validating novel therapeutic strategies.
By exploiting our recently established RS-PDX models, which recapitulate the variability of the human disease in terms of genetic profile and phenotype, we found heterogeneous ROR1 expression, with very high, high, and intermediate levels in the IP867/17, RS1316, and RS1050 models, respectively. ROR1 was essentially absent in the RS9737 model, allowing this RS-PDX to serve as a negative control. The extent of ROR1 expression in the IP867/17, RS1316, and RS1050 models was consistent with data reported for non-RS DLBCL cases and with ROR1 expression detected in primary RS samples by IHC staining.
ROR1 expressed by CLL cells mediates chemotactic and proliferative signals from the Wnt5a ligand.31 However, in RS cells, we found that signaling through ROR1 induced only limited activation of downstream targets and phosphorylation of the p65 subunit of NF-κB and Jnk, with no significant modification of proliferation or migration. Consistent with this observation, treatment of RS-PDX models with UC-961, a recombinant humanized IgG1 monoclonal antibody with specificity for the extracellular domain of human ROR1, did not show tumor growth inhibition. However, when we tested VLS-101, an ADC that links the ROR1-targeting UC-961 to the antimicrotubule cytotoxic agent MMAE, we could demonstrate substantial tumor-specific antitumor activity. Upon binding to ROR1, the ADC was internalized, releasing MMAE to exert its cytotoxic effect. Because this is the main mechanism of action of VLS-101, its effects may be tested in immunocompromised mice.
After confirming that the ADC (VLS-101) and the antibody (UC-961) show comparable tumor cell binding and internalization, we documented that VLS-101 induced time- and dose-dependent cell-cycle progression arrest and apoptosis in RS cells purified from PDX tumor masses. We further demonstrated that VLS-101 was highly efficacious in subcutaneous and systemic RS-PDX models, including models harboring prognostically adverse TP53 mutations. In the subcutaneous models, VLS-101 caused highly significant tumor growth inhibition in the 3 ROR1-expressing models, resulting in disease regression. Moreover, after drug discontinuation, VLS-101–treated mice showed no tumor regrowth for several weeks posttreatment, with markedly increased survival. The results obtained in these subcutaneous models were confirmed in systemic ROR1-expressing RS-PDX models. VLS-101 eliminated cancer cells in the BM, PB, and spleen, the main sites of RS cell colonization, significantly increasing the survival of ADC-treated mice over vehicle-treated controls. Further studies are needed to optimize the treatment schedule, particularly for the systemic models, to achieve complete remission of the disease. One possibility to investigate is whether additional cycles of VLS-101 treatment could eradicate all RS cells in all tumor-colonized tissue districts, preventing relapse. Future combination approaches may offer additional therapeutic options.
It is notable that VLS-101 therapy was highly specific because in vivo ADC efficacy was not observed in RS9737 with low to undetectable ROR1, but was observed in RS1050, which expresses low levels of the target. This cytotoxic activity on adjacent tumor cells that do not express ROR1 is likely due to the “bystander effect,” a well-known mechanism for certain ADCs.38,39
Our data indicate that ROR1 is expressed on RS cells and suggest that it might be diagnostically evaluated in patients undergoing biopsy for RS transformation to select or stratify patients who might most benefit from an anti-ROR1 ADC regimen. Some open points remain regarding the development and validation of a diagnostic tool to be used in determining ROR1 expression in RS cells as well as identification of an appropriate cutoff criterion for ROR1 expression. One option for testing could be flow cytometry, which represents a rapid and reproducible technique that could be readily standardized across diagnostic laboratories but requires fresh tissue. Alternatively, qRT-PCR might prove to be a reasonable approach for negative selection of patients with RS lacking sufficient ROR1 levels and consequent ROR1 expression on the cell surface. Indeed, we found a direct correlation between the number of messenger RNA copies and protein expression on the cell surface in our models (supplemental Figure 10). IHC offers the flexibility of evaluation of archival materials but may result in false-negative results due to the lability of cell-surface receptors during tissue fixation, processing, antigen retrieval, and storage. It is worth noting that even in our RS-PDX model with modest ROR1 expression (32% of cells), VLS-101 resulted in complete tumor regression, possibly due to a bystander effect of the ADC.39 This observation supports the potential that VLS-101 might treat patients with a broad spectrum of ROR1 expression, and emphasizes the need for clinical studies to correlate biomarker results with efficacy so as to establish the most suitable detection methods and predictive expression thresholds.
In summary, these data support targeting of ROR1 with an ADC to selectively treat RS in patients with CLL who have experienced disease transformation. Based in part on our findings, a phase 1 clinical trial of VLS 101 (NCT03833180) is ongoing in patients with RS and other hematological malignancies.
For original data, please contact tiziana.vaisitti@unito.it
The online version of this article contains a data supplement.
The publication costs of this article were defrayed in part by page charge payment. Therefore, and solely to indicate this fact, this article is hereby marked “advertisement” in accordance with 18 USC section 1734.
Acknowledgments
The authors thank Peter Riebling at VelosBio, Inc who provided editorial support during manuscript writing.
This work was supported by a VelosBio research grant (S.D.); by the Italian Association for Cancer Research (AIRC) (My First AIRC grant MFAG-23107 [T.V.]; Investigator grant IG-23095 [S.D.]); by the Italian Ministry of Health (GR-2016-02364298 [T.V.]); and by the Ministry of Education, University and Research (MIUR) “Progetto strategico di Eccellenza Dipartimentale” (#D15D18000410001 [S.D.] as part of the Department of Medical Sciences, University of Turin).
Authorship
Contribution: T.V., B.J.L., K.A.J., and S.D. designed research; A.C., A.D.N., J.N.A., R.R.F., and K.A.J. provided material; T.V., F.A., N.V., T.-T.L., M.K., A.C., E.B., and A.I. performed experiments; T.V., L.L.M., B.J.L., K.A.J., and S.D. analyzed results, produced the figures, and wrote the manuscript; and all authors approved the final version of the manuscript.
Conflict-of-interest disclosure: T.-T.L. and M.K. are employed by VelosBio and hold ownership interests in VelosBio. J.N.A. has consulted with Pharmacyclics, AbbVie, Janssen, AstraZeneca, Genentech, Ascentage Pharma Group, Cellectar and Beigene; has received research funding from Celgene, Janssen, TG Therapeutics, and Genentech; and has received honoraria from Janssen, AstraZeneca, and AbbVie. R.R.F. has consulted with AbbVie, Acerta, AstraZeneca, Beigene, Genentech, Janssen, Loxo Oncology, Oncotracker, Pharmacyclics, Sunesis, TG Therapeutics, and Verastem Oncology; has received research funding from AstraZeneca, Janssen, and TG Therapeutics; and has received honoraria from Janssen. L.L.M. is employed by VelosBio; has consulted for AI Therapeutics, Catalys Pacific, Cleveland BioLabs, Incuron, VelosBio, and Zentalis; and holds ownership interests in AbbVie, AI Therapeutics, AstraZeneca, Cancer Genetics, Cleveland Biolabs, EpiThany, Gilead Sciences, VelosBio, and Zentalis. B.J.L. is employed by VelosBio and holds ownership interests in Gilead Sciences and VelosBio. K.A.J. is employed by VelosBio and holds ownership interests in eFFECTOR and VelosBio. S.D. has received research funding from Heidelberg Pharma, Sunesis, VelosBio, and Verastem. The remaining authors declare no competing financial interests.
Correspondence: Silvia Deaglio, University of Torino, Via Nizza 52, 10126 Turin, Italy; e-mail: silvia.deaglio@unito.it; and Tiziana Vaisitti, University of Torino, Via Nizza 52, 10126 Turin, Italy; e-mail: tiziana.vaisitti@unito.it.
