

Key Points
Avadomide induces type I and II IFN signaling in T cells, triggering a feedforward cascade of reinvigorated anti-CLL immune responses.
IFN-driven promotion of a CD8+ T cell-inflamed microenvironment by avadomide enhances anti-PD-L1/PD-1 efficacy in preclinical models.

Abstract
Cancer treatment has been transformed by checkpoint blockade therapies, with the highest anti-tumor activity of anti-programmed death 1 (PD-1) antibody therapy seen in Hodgkin lymphoma. Disappointingly, response rates have been low in the non-Hodgkin lymphomas, with no activity seen in relapsed/refractory chronic lymphocytic leukemia (CLL) with PD-1 blockade. Thus, identifying more powerful combination therapy is required for these patients. Here, we preclinically demonstrate enhanced anti-CLL activity following combinational therapy with anti-PD-1 or anti-PD-1 ligand (PD-L1) and avadomide, a cereblon E3 ligase modulator (CELMoD). Avadomide induced type I and II interferon (IFN) signaling in patient T cells, triggering a feedforward cascade of reinvigorated T-cell responses. Immune modeling assays demonstrated that avadomide stimulated T-cell activation, chemokine expression, motility and lytic synapses with CLL cells, as well as IFN-inducible feedback inhibition through upregulation of PD-L1. Patient-derived xenograft tumors treated with avadomide were converted to CD8+ T cell-inflamed tumor microenvironments that responded to anti-PD-L1/PD-1-based combination therapy. Notably, clinical analyses showed increased PD-L1 expression on T cells, as well as intratumoral expression of chemokine signaling genes in B-cell malignancy patients receiving avadomide-based therapy. These data illustrate the importance of overcoming a low inflammatory T-cell state to successfully sensitize CLL to checkpoint blockade-based combination therapy.
Introduction
Immune checkpoint blockade has demonstrated that reinvigorating anti-tumor immune activity can induce durable responses across multiple cancer types.1-3 Anti-programmed death 1 (PD-1) is expressed by T cells following activation and remains on exhausted T cells within a chronic inflammatory environment. PD-1 transmits inhibitory signals into T cells at the immunological synapse following engagement with its ligands anti-PD-1 ligand (PD-L1) or PD-L2 expressed on tumor cells or antigen-presenting cells.4 Constitutive expression of PD-1 ligands through genomic amplification is seen in Hodgkin lymphoma (HL).5 In addition, pro-inflammatory cytokines including interferon-γ (IFN-γ) contribute to PD-L1 expression in the tumor microenvironment (TME).2 Blocking the interaction of PD-1 with its ligands prevents inhibitory signaling and allows tumor-specific T cells to remain activated against tumor cells. The most promising clinical responses to PD-1 blockade have been seen in HL.5,6 However, the efficacy of anti-PD-1 immunotherapy in non-HLs (NHLs) including diffuse large B-cell lymphoma (DLBCL) has been more modest.7 Unexpectedly, no activity was seen in a trial of anti-PD-1 therapy for relapsed/refractory (R/R) chronic lymphocytic leukemia (CLL),8 even although PD-L1-PD-1-mediated T-cell dysfunction has been described.9-11 This clinical experience suggests that profound immunosuppressive barriers operate within the TME.
Clinical activity of checkpoint inhibitors in cancer has been correlated with reduced disease burden,12 strong PD-L1 expression in the TME,5,13,14 tumor neoantigen load,15 and mutations in antigen presentation and IFN-γ pathways.16-18 Additional studies have implicated T-cell state, including the number of tumor-infiltrating cytotoxic CD8+ T cells19 and IFN-γ response immune signatures.20,21 Strong expression of PD-L1 is thought to reflect active anti-tumor T-cell activity and represent a marker of adaptive IFN-inducible immune resistance,19 that characterizes T cell-inflamed microenvironments.22 However, studies suggest that PD-L1 expression in the CLL TME is relatively low.8,10,23,24 Furthermore, although CLL cells are capable of responding to IFN-γ and their major histocompatibility complex molecules are intact,9,25 a low frequency of neoantigen generation26,27 likely fosters poor tumor immunogenicity. In addition, CLL cells express low levels of adhesion and costimulatory molecules required for effective immune recognition.28,29 T-cell dysfunction in CLL has been linked to tumor-induced cytoskeletal reprogramming,30 and a defective ability to migrate31,32 and form immune synapses.9,29,33 Thus, identifying effective therapies capable of reestablishing immune effector functions could offer hope for R/R patients, as well as deepen targeted agent-induced responses.34
Avadomide (CC-122) is a cereblon E3 ligase modulator (CELMoD) drug that has demonstrated clinical activity in DLBCL.35 Avadomide, like the immunomodulatory drug lenalidomide, binds to the protein target cereblon, a substrate receptor in the cullin4 E3 ligase complex, that promotes recruitment, ubiquitination, and subsequent proteasomal degradation of the hematopoietic transcription factors Aiolos and Ikaros.36,37 Mechanistically, avadomide triggers an IFN response in DLBCL cells that induces direct tumor apoptosis.38 In contrast, avadomide is not directly cytotoxic to CLL cells, but has been reported to possess anti-proliferative activity.39 Advantageously, degradation of Aiolos and Ikaros in T cells by CELMoDs derepresses interleukin-2 (IL-2) transcription and production, leading to activation.38,40 The ability of avadomide to directly inhibit tumor cells while stimulating immune cells, suggests that it could represent a complementary treatment partner for checkpoint blockers.
Here, we demonstrate that avadomide induces type I and II IFN signaling in previously exhausted patient T cells using CLL as a model B-cell malignancy. Our studies reveal that the ability of this immunomodulatory drug to stimulate this immune compartment triggers a potent cascade reaction, that pairs effectively with PD-L1/-PD-1 axis blockade, leading to enhanced T cell-mediated CLL killing.
Methods
Patient samples
All patient- and age-matched healthy samples were obtained after written informed consent, in accordance with the Declaration of Helsinki and approved by the National Research Ethics Committee. All CLL samples (n = 138) were previously untreated and selected to represent the heterogeneity of the disease. In vivo avadomide and obinutuzumab (CC-122-CLL-001; NCT02406742) and ibrutinib-based therapy samples (E1912; NCT02048813) came from review board-approved clinical trials.
Antibodies/drugs
Avadomide, nivolumab (anti-PD-1) and durvalumab (anti-PD-L1) were provided by Bristol-Myers Squibb. Checkpoint blocking antibodies were used at 10 µg/mL. Avadomide (reconstituted in dimethyl sulfoxide) was used at 0.5 µM final concentration unless otherwise stated (supplemental Methods, available on the Blood Web site). Specific doses were optimized for each immune modeling assay depending on the duration of treatment and addition of anti-CD3 + anti-CD28 T-cell receptor stimulation. Vehicle-treated cells were cultured with dimethyl sulfoxide alone or isotype control antibodies.
Statistical analysis
Normality was assessed using the Shapiro-Wilk test. Paired t test (parametric) or Wilcoxon signed-rank test (nonparametric) were used to compare paired measurements between 2 experimental groups. Alternatively, unpaired t test (parametric) or Mann-Whitney test (nonparametric) was used to compare unpaired measurements between 2 experimental groups. Multiple group comparisons were performed using a 1-way or 2-way analysis of variance (ANOVA) test (unpaired, parametric) or a repeated-measures ANOVA with a Tukey’s multiple comparisons test (paired data, parametric). For nonparametric datasets, multiple group comparisons were performed using a Kruskal-Wallis test (unpaired data) or a Freidman test with Dunn’s multiple comparisons test (paired data). P < .05 was considered statistically significant. Statistical analysis was performed using GraphPad Prism.
Additional methods can be found in the supplemental Methods.
Results
Anti-PD-L1 is superior to anti-PD-1 but both elicit only partial anti-CLL T-cell responses
To better understand the activity of immunotherapy, we first modeled the capability of checkpoint inhibitors alone to break T-cell tolerance against autologous CLL cells using a quantitative cytotoxicity assay. Anti-PD-1 antibody treatment triggered a small but nonsignificant improvement in T-cell killing function when compared with vehicle treatment (Figure 1A). We confirmed that PD-1 was expressed by a proportion of both unstimulated and stimulated patient CD4+ and CD8+ T cells (Figure 1B; supplemental Figure 1A).29,41 Interestingly, this analysis revealed that patient T-cell populations also expressed PD-L1, which increased significantly following stimulation (Figure 1C; supplemental Figure 1A). PD-L1 positivity on baseline CLL cells was in agreement with previous reports.9,10 This led us to model the anti-CLL effect of anti-PD-L1 antibody treatment that showed significantly increased CLL death compared with vehicle-treated patient cells (Figure 1A). However, although anti-PD-L1 was superior to anti-PD-1 at eliciting anti-CLL T cell activity, both treatments only partially reactivated patient T-cell killing function when compared with the cytolytic activity of healthy donor T cells.
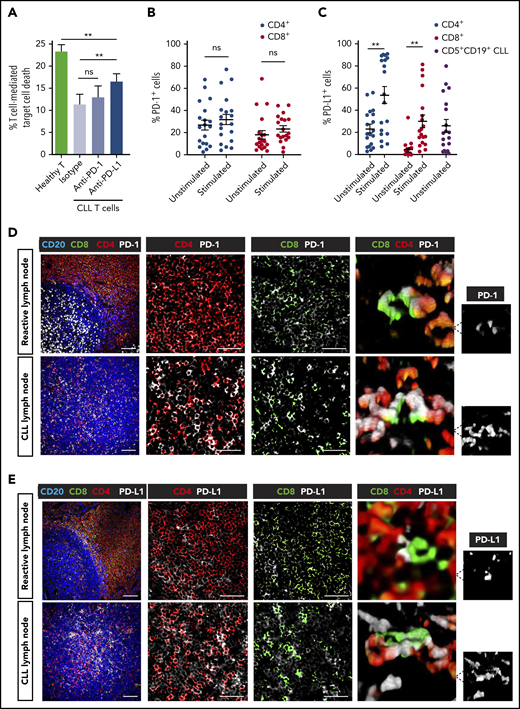
Partial T-cell responses to anti-PD-1 or anti-PD-L1 alone and evidence of a noninflamed TME in CLL. (A) Autologous T-cell killing function against patient CLL cells pulsed with superantigen (sAg) (target cells) (n = 10) as detected by cytotoxicity assays following treatment with isotype control antibody (Ab), anti-PD-1, or anti-PD-L1 blocking Abs. Data presented as mean ± standard error of the mean (SEM). Aged-matched healthy donor T cell activity against autologous B cells pulsed with sAg (target cells) was included as controls. Percentage positive PD-1+ cells (B) and PD-L1+ cells (C) on unstimulated or anti-CD3 + anti-CD28 stimulated patient T cells (CD4+, CD8+) (n = 19). PD-L1 expression on freshly isolated CD5+ CD19+ CLL cells is also shown in panel C. Representative multispectral immunofluorescence images of nonmalignant reactive (n = 5) or CLL/SLL (n = 34) lymph node formalin-fixed paraffin-embedded biopsy tissues for (D) PD-1 (white) and (E) PD-L1 (white) expression on T cells (CD4, red; CD8, green) and B cells (CD20, blue). Original magnification, ×20 medial optical section images (far left, scale bar = 100 μm), cropped images (middle panels, scale bars = 50 μm) and 3D volume rendered confocal images of intercellular PD-1+ or PD-L1+ T-cell interactions (far right) (cropped, ×20 images). **P < .01; ns, not significant using a repeated measures 1-way ANOVA with Tukey's multiple comparisons test (or an unpaired t test for comparing CLL T-cell activity with healthy donor T cells) (A) and Wilcoxon signed-rank tests for comparisons between unstimulated and stimulated T-cell subsets (B-C). Data presented as mean ± SEM.
Partial T-cell responses to anti-PD-1 or anti-PD-L1 alone and evidence of a noninflamed TME in CLL. (A) Autologous T-cell killing function against patient CLL cells pulsed with superantigen (sAg) (target cells) (n = 10) as detected by cytotoxicity assays following treatment with isotype control antibody (Ab), anti-PD-1, or anti-PD-L1 blocking Abs. Data presented as mean ± standard error of the mean (SEM). Aged-matched healthy donor T cell activity against autologous B cells pulsed with sAg (target cells) was included as controls. Percentage positive PD-1+ cells (B) and PD-L1+ cells (C) on unstimulated or anti-CD3 + anti-CD28 stimulated patient T cells (CD4+, CD8+) (n = 19). PD-L1 expression on freshly isolated CD5+ CD19+ CLL cells is also shown in panel C. Representative multispectral immunofluorescence images of nonmalignant reactive (n = 5) or CLL/SLL (n = 34) lymph node formalin-fixed paraffin-embedded biopsy tissues for (D) PD-1 (white) and (E) PD-L1 (white) expression on T cells (CD4, red; CD8, green) and B cells (CD20, blue). Original magnification, ×20 medial optical section images (far left, scale bar = 100 μm), cropped images (middle panels, scale bars = 50 μm) and 3D volume rendered confocal images of intercellular PD-1+ or PD-L1+ T-cell interactions (far right) (cropped, ×20 images). **P < .01; ns, not significant using a repeated measures 1-way ANOVA with Tukey's multiple comparisons test (or an unpaired t test for comparing CLL T-cell activity with healthy donor T cells) (A) and Wilcoxon signed-rank tests for comparisons between unstimulated and stimulated T-cell subsets (B-C). Data presented as mean ± SEM.
Given the relevance of the lymphoid TME for the regulation of immune surveillance42 and response to therapy,43 we next examined the PD-L1-PD-1 axis in an independent cohort of lymph node tissues from CLL and small lymphocytic lymphoma (SLL) patients using multicolor microscopy with image analysis (Figure 1D-E; supplemental Table 1). We first analyzed nonmalignant reactive lymph node tissues and identified PD-1+ cells as CD4+ T cells within germinal centers (likely T follicular helper cells),44,45 as well as a proportion of interfollicular PD-1+ CD4+ and PD-1+ CD8+ T cells (Figure 1D). In CLL/SLL, CD4+ T cells showed a diffuse localization pattern with increased numbers compared with CD8+ T cells. PD-1 expression was detected on both CD4+ and CD8+ T cells in CLL/SLL, with increased percentage positivity compared with interfollicular T cells from reactive tissues (Figure 1D; supplemental Figure 1B). Unexpectedly, we detected the majority of PD-L1 expression on a proportion of CD4+ and CD8+ T cells in both reactive (marginal/interfollicular zone) and CLL/SLL tissues (Figure 1E; supplemental Figure 1B). Interestingly, we detected increased PD-L1 expression on CD8+ T cells in CLL patients with Richter’s transformation (supplemental Figure 1B), who have shown better responses to anti-PD-1 monotherapy.8 In contrast, we detected weak PD-L1 expression on CLL tumor cells, consistent with previous reports.8,44,46 Notably, we observed that PD-1- and PD-L1-expressing T cells often exhibited close proximity interactions in CLL/SLL (3-dimensional [3D] volume rendered confocal images; Figure 1D-E). Taken together, our data suggest that a “noninflamed” microenvironment47 in CLL, incorporating sparse CD8+ T-cell numbers, low PD-L1 expression, and profound T-cell exhaustion, will need to be overcome with additional immunostimulatory therapy to improve checkpoint blockade immunotherapy.
Treatment with avadomide stimulates T-cell immune synapses with a concomitant increase in PD-L1 expression
We first examined the ability of patient T cells to form synapses48 with tumor cells following avadomide treatment. We found that avadomide enhanced the number of CD4+ or CD8+ T cells recognizing CLL cells (Figure 2A) and increased the formation of T cell F-actin immune synapses (Figure 2B-C). We further revealed that avadomide treatment increased tyrosine-phosphorylated proteins49 at T-cell synapses with CLL cells (Figure 2D-E). Notably, avadomide was significantly more potent at activating patient T-cell synapses in comparison with lenalidomide treatment (supplemental Figure 2A). In keeping with this enhanced immunostimulatory effect, avadomide augmented the degradation of Aiolos and Ikaros in T cells, the dominant immunomodulatory mechanism of action of these drugs (supplemental Figure 3A-E).38,40 Immunophenotyping revealed increased expression of activation markers, particularly CD25 on avadomide-treated patient CD8+ T cells (Figure 2F; supplemental Figure 2B-C). Notably, avadomide also increased expression of the costimulatory B7 family member CD86 on CLL cells. Cotreatment of both CLL and T cells contributed to improved synapse interactions when compared with the treatment of patient T cells alone (supplemental Figure 2D). Intriguingly, avadomide reduced the number of patient CD4+ and CD8+ T cells expressing PD-1, which could reflect a reversal of exhaustion status (Figure 2G). In contrast, we detected increased PD-L1 expression on both T-cell subsets and CLL cells following treatment (Figure 2H). Microscopy revealed that both PD-L1 and PD-1 exhibited enhanced polarized expression at T-cell synapses following avadomide treatment (Figure 2I). This led us to evaluate the effect of treating patient T cells with avadomide plus PD-1 or PD-L1 inhibition on synapse signaling.48,50 Immunoblotting showed these combination therapies resulted in increased phosphorylation of the early T-cell receptor signaling molecules ZAP-70 and LAT compared with avadomide treatment alone (Figure 2J; supplemental Figure 2E). AKT and MAPK, which regulate signal transduction to the nucleus, also showed elevated activation with combination therapy. Taken together, the ability of avadomide to promote immune recognition led us to investigate its pairing with PD-L1/PD1 blockade for modulating anti-tumor effector activity.
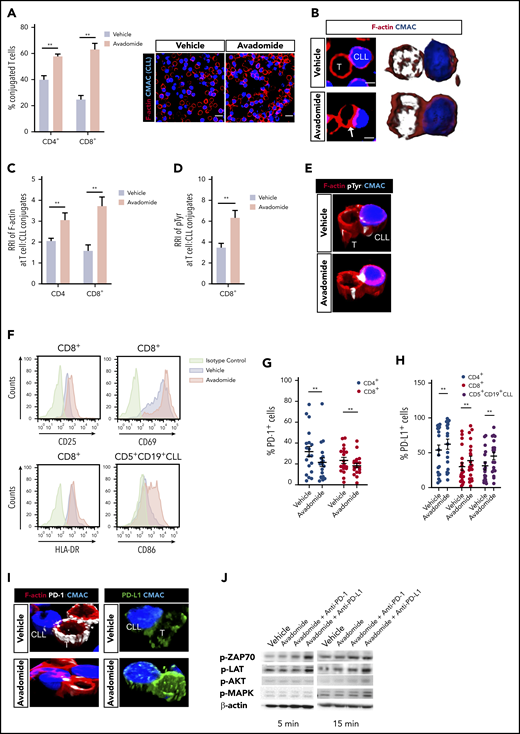
Avadomide activates previously exhausted CLL patient T cells and induces expression of PD-L1. (A) Intercellular autologous CD4+ or CD8+ T-cell:tumor cell conjugates formed from vehicle- or avadomide-treated CLL patient samples (n = 25). Image analysis data presented as mean % T cell:CLL conjugates ± SEM. Representative confocal images show patient T cell:CLL cell (blue) conjugate F-actin (red) interactions after treatment. Original magnification, ×63 (scale bars: 10 μm). (B) Representative medial optical section (scale bars: 5 μm) and 3D volume rendered images of CD8+ T-cell conjugates with increased F-actin (red) immune synapse formation with CLL tumor cells (arrow) following avadomide treatment. Relative recruitment index, RRI image analysis of (C) F-actin (red) and (D) tyrosine-phosphorylated protein polarization in autologous CD4+ or CD8+ T cell:CLL conjugates following vehicle or avadomide treatment (n = 30). (E) Representative 3D volume rendered images of CD8+ T-cell conjugates showing increased phosphotyrosine signal (white, pTyr) at synapses with avadomide. (F) Representative flow cytometric histograms of CD25 and CD69 (top) and HLA-DR (bottom) expression on stimulated patient CD8+ T cells with treatment (n = 5). CD86 expression on treated CD5+ CD19+ CLL cells is also shown. Frequency of (G) PD-1- and (H) PD-L1-expressing cells (stimulated CD4+, blue; CD8+, red; or CD5+ CD19+ CLL cells, black) following avadomide treatment (n = 19). (I) Representative 3D volume rendered images of CD8+ T cell:tumor (blue) conjugates showing reduced and increased expression of PD-1 (white) and PD-L1 (green), respectively, with both molecules polarizing at synapses with avadomide. (J) Representative immunoblots of pretreated (as indicated), stimulated patient T cells subsequently conjugated with MEC-1 tumor cells (T cell:tumor cell conjugates, 5 and 15 minutes for early and late conjugation times, respectively) probed for the phospho (p)-proteins p-ZAP-70, p-LAT, p-MAPK, and p-AKT (n = 3). **P < .01 using Wilcoxon signed-rank tests (A,C-D,G-H). Data presented as mean ± SEM. RRI, relative recruitment index.
Avadomide activates previously exhausted CLL patient T cells and induces expression of PD-L1. (A) Intercellular autologous CD4+ or CD8+ T-cell:tumor cell conjugates formed from vehicle- or avadomide-treated CLL patient samples (n = 25). Image analysis data presented as mean % T cell:CLL conjugates ± SEM. Representative confocal images show patient T cell:CLL cell (blue) conjugate F-actin (red) interactions after treatment. Original magnification, ×63 (scale bars: 10 μm). (B) Representative medial optical section (scale bars: 5 μm) and 3D volume rendered images of CD8+ T-cell conjugates with increased F-actin (red) immune synapse formation with CLL tumor cells (arrow) following avadomide treatment. Relative recruitment index, RRI image analysis of (C) F-actin (red) and (D) tyrosine-phosphorylated protein polarization in autologous CD4+ or CD8+ T cell:CLL conjugates following vehicle or avadomide treatment (n = 30). (E) Representative 3D volume rendered images of CD8+ T-cell conjugates showing increased phosphotyrosine signal (white, pTyr) at synapses with avadomide. (F) Representative flow cytometric histograms of CD25 and CD69 (top) and HLA-DR (bottom) expression on stimulated patient CD8+ T cells with treatment (n = 5). CD86 expression on treated CD5+ CD19+ CLL cells is also shown. Frequency of (G) PD-1- and (H) PD-L1-expressing cells (stimulated CD4+, blue; CD8+, red; or CD5+ CD19+ CLL cells, black) following avadomide treatment (n = 19). (I) Representative 3D volume rendered images of CD8+ T cell:tumor (blue) conjugates showing reduced and increased expression of PD-1 (white) and PD-L1 (green), respectively, with both molecules polarizing at synapses with avadomide. (J) Representative immunoblots of pretreated (as indicated), stimulated patient T cells subsequently conjugated with MEC-1 tumor cells (T cell:tumor cell conjugates, 5 and 15 minutes for early and late conjugation times, respectively) probed for the phospho (p)-proteins p-ZAP-70, p-LAT, p-MAPK, and p-AKT (n = 3). **P < .01 using Wilcoxon signed-rank tests (A,C-D,G-H). Data presented as mean ± SEM. RRI, relative recruitment index.
Anti-PD-L1/PD-1-mediated anti-tumor T-cell function can be enhanced when combined with avadomide
Cytotoxicity assays revealed that treating patient T cells and autologous CLL cells with avadomide activated anti-tumor T-cell killing function (Figure 3A), with enhanced potency compared with lenalidomide (supplemental Figure 4A). However, combining avadomide with anti-PD-1 or anti-PD-L1 resulted in more CLL killing when compared with these drugs alone (Figure 3A; supplemental Figure 4B; supplemental Table 2), with effector activity comparable to healthy donor T cell controls. In addition, combination therapy was more effective at promoting T cell-mediated killing of DLBCL compared with avadomide alone (supplemental Figure 4C). Cell conjugation assays confirmed that avadomide promoted formation of granzyme B+ T-cell lytic synapses with autologous malignant B cells in both DLBCL (Figure 3B-C) and CLL (supplemental Figure 4D). Treating CLL cells alone with avadomide or lenalidomide confirmed that these drugs were not directly cytotoxic to these tumor cells (supplemental Figure 4E). Notably, we found that treatment of both T cells and CLL cells with avadomide induced maximum killing compared with treating T cells alone (Figure 3D), suggesting that the ability of avadomide to enhance CLL antigen-presenting cell function (supplemental Figure 2C-D) contributes to anti-CLL T cell activity. Given our earlier observations, we also investigated the contribution of T cell-expressed PD-L1 to checkpoint blockade activity. We found that treating patient T cells alone with anti-PD-L1 triggered significant anti-CLL T cell killing; albeit at a reduced level compared with the cotreatment of tumor cells (Figure 3D). These data challenge a prevalent view that tumor cells are the primary source of PD-L1 during immunosuppressive signaling.
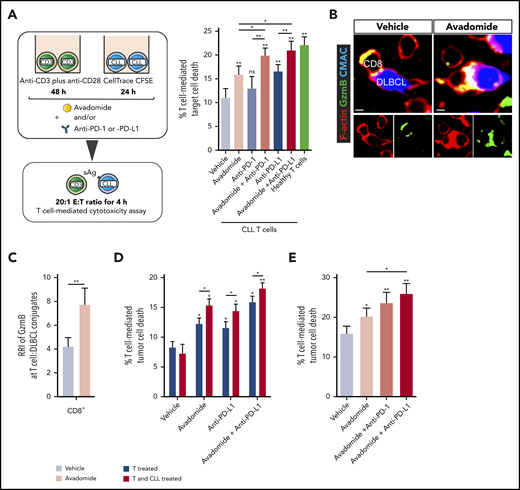
Pairing anti-PD-L1/PD-1 with avadomide effectively reactivates anti-CLL T cell killing function. (A) Illustration of the autologous cytotoxicity assay using treated patient T cells mixed with treated CLL cells and flow-based quantification of T-cell killing function against superantigen (sAg)-pulsed CLL cells as target cells (mean % CLL cell death ± SEM for n = 10 patients) following the treatments indicated. Aged-matched healthy donor T cell effector activity against autologous B cells loaded with sAg (as target cells) was included as a control. (B) Representative confocal images showing CD8+ tumor-infiltrated lymphocytes (TILs) forming granzyme B+ (Gzmb, green), F-actin (red) lytic synapses with primary autologous DLBCL tumor cells (blue) with avadomide treatment (nontumoricidal dose) (colocalization signal: yellow) (original magnification ×63, scale bars: 5 μm). (C) Relative recruitment index, RRI image analysis of Granzyme B (green) polarization in autologous CD8+ TIL:DLBCL conjugates following vehicle or avadomide treatment (n = 5). (D) Autologous T-cell killing function against patient CLL cells (n = 10) following treatment of patient T cells alone (before mixing with untreated CLL cells) or treating both T cells and CLL cells. (E) T-cell-mediated cytotoxicity against baseline autologous CLL cells using 12 CLL patient samples who had received ibrutinib-based therapy for 12 months. T cells and tumor cells were treated as indicated. *P < .05; **P < .01; ns, not significant using a repeated measures 1-way ANOVA with Tukey's multiple comparisons test (A and E) (or an unpaired t test for comparing CLL T-cell activity with healthy donor T cells), Wilcoxon signed-rank test (C) and 2-way ANOVA (D). Data presented as mean ± SEM.
Pairing anti-PD-L1/PD-1 with avadomide effectively reactivates anti-CLL T cell killing function. (A) Illustration of the autologous cytotoxicity assay using treated patient T cells mixed with treated CLL cells and flow-based quantification of T-cell killing function against superantigen (sAg)-pulsed CLL cells as target cells (mean % CLL cell death ± SEM for n = 10 patients) following the treatments indicated. Aged-matched healthy donor T cell effector activity against autologous B cells loaded with sAg (as target cells) was included as a control. (B) Representative confocal images showing CD8+ tumor-infiltrated lymphocytes (TILs) forming granzyme B+ (Gzmb, green), F-actin (red) lytic synapses with primary autologous DLBCL tumor cells (blue) with avadomide treatment (nontumoricidal dose) (colocalization signal: yellow) (original magnification ×63, scale bars: 5 μm). (C) Relative recruitment index, RRI image analysis of Granzyme B (green) polarization in autologous CD8+ TIL:DLBCL conjugates following vehicle or avadomide treatment (n = 5). (D) Autologous T-cell killing function against patient CLL cells (n = 10) following treatment of patient T cells alone (before mixing with untreated CLL cells) or treating both T cells and CLL cells. (E) T-cell-mediated cytotoxicity against baseline autologous CLL cells using 12 CLL patient samples who had received ibrutinib-based therapy for 12 months. T cells and tumor cells were treated as indicated. *P < .05; **P < .01; ns, not significant using a repeated measures 1-way ANOVA with Tukey's multiple comparisons test (A and E) (or an unpaired t test for comparing CLL T-cell activity with healthy donor T cells), Wilcoxon signed-rank test (C) and 2-way ANOVA (D). Data presented as mean ± SEM.
Finally, we investigated the ability of avadomide and its combination with anti-PD-1 or anti-PD-L1 to activate T cells from patients who had received prior ibrutinib-based therapy for 12 months34 because this BTK inhibitor is known to modulate immune responses.51 We found that avadomide alone or its combination with checkpoint blockers enhanced the anti-CLL killing function of ibrutinib-rituximab-exposed T cells (Figure 3E), consistent with our treatment-naïve patient data. Collectively, our results demonstrate that the pairing of avadomide with PD-L1/PD-1 blockade can effectively reactivate previously exhausted patient T cells.
Avadomide induces a type I and II IFN gene signature in patient T cells
Next, RNA sequencing (RNA-seq) was performed on purified patient T cells from treatment-naïve CLL patient samples treated with avadomide or anti-PD-1 or anti-PD-L1 alone or in combinations. Patient samples were selected to represent extremes of prognosis (n = 6 favorable and n = 6 poor prognostic baseline markers including TP53 abnormalities; supplemental Table 3). Differential expression pathway analysis revealed that the top functional gene categories common for all the avadomide- and combination-treated patient samples (independent of checkpoint inhibition alone) were related to the response to both type I and II IFN signaling, as well as inflammatory tumor necrosis factor-α, IL-6/JAK/STAT3, and IL-2/STAT5 signaling responses (Figure 4A; supplemental Figure 5A). Transcription factor enrichment analysis showed that 50% of all differentially expressed genes following avadomide treatment were significantly associated with Ikaros control (supplemental Figure 5B), in keeping with the mechanism of action of this CELMoD. Pathway analysis revealed a strong enrichment of genes involved in proliferation, cytokine and chemokine signaling, F-actin polymerization, T-cell differentiation, and costimulation (Figure 4B; supplemental Figure 5C; supplemental Table 5). Notably, avadomide induced the expression of IFN type I- and II-inducible chemokines Cxcl9, Cxcl10, and Cxcl11,52 which are part of an immune-related gene expression signature predictive of favorable response to PD-1 blockade in solid cancer (supplemental Figure 5D).20 In addition, IFN-induced counterregulatory pathways including Cd274 (PD-L1), Lag3, and Ido1 were upregulated by avadomide. Avadomide and the combination treatments induced IFN signaling within patient T cells in both good and poor prognostic CLL subtypes (Figure 4C), whereas none of these response genes were significantly upregulated with anti-PD-1 or anti-PD-L1 alone. In contrast, E2F- and Myc-related gene targets linked to cell cycle and metabolic activation53,54 were among the T-cell transcriptome changes following checkpoint inhibition alone (supplemental Table 6). Given these observations, we next asked whether deregulated IFN gene signatures were associated with T-cell dysfunction in treatment-naïve CLL. Our analysis of a comparative gene expression profiling dataset30 revealed that patient CD4+ T cells showed signatures suggestive of perturbed type I and II IFN signaling compared with age-matched healthy donor T cells. These IFN signatures were in common with those regulated by avadomide but in opposing directions (Figure 4D). Further analysis revealed that CD8+ T cells from treatment-naïve CLL showed deregulated IFN-α, costimulation, chemokine, motility, and effector pathways, that again were oppositely regulated by avadomide treatment. Thus, these results support the ability of avadomide to normalize dysfunctional IFN and chemokine responses in patient T cells that are linked to anti-tumor immunity.55
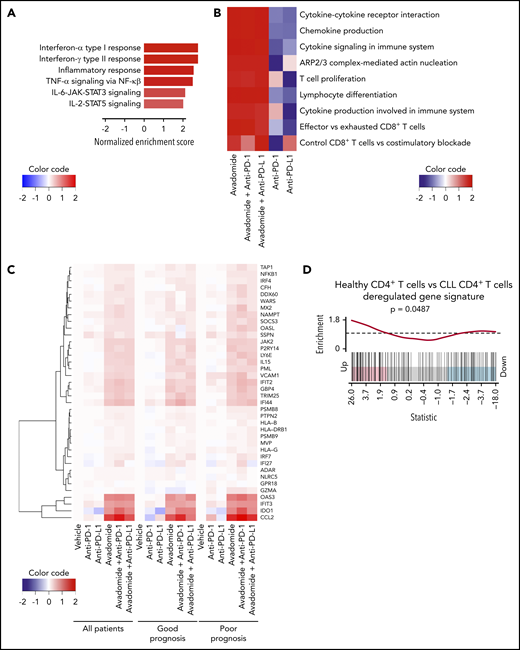
Avadomide induces IFN type I and II signaling in patient T cells encompassing activation, exhaustion, and cytotoxicity and normalizes deregulated IFN and chemokine gene expression in previously exhausted T cells. (A) Top differential hallmark pathways between vehicle and avadomide treatment. Normalized enrichment scores (NES) represent the mean score over avadomide-treated samples, with positive scores indicating upregulation with avadomide treatment relative to vehicle control. (B) Heatmap of top immune pathways enriched by avadomide treatment, shown under multiple treatment conditions. Cell colors indicate mean NES for each pathway, indicating directionality and strength of the gene pathway changes. (C) Heatmap of selected IFN genes deregulated by avadomide treatment shown under multiple treatment conditions for multiple patient subsets indicated. Cell colors indicate the mean log fold change of expression compared with vehicle control, with positive values (red) or negative values (blue) indicating upregulation or downregulation respectively compared with vehicle. (D) Barcode enrichment plot for a gene signature upregulated in age-matched healthy donor CD4+ T cells compared with CLL patient CD4+ T cells (GSE8835_HEALTHY_VS_CLL_CD4_TCELL_UP) that is significantly upregulated by avadomide treatment. These data support normalization of deregulated IFN gene expression in previously exhausted patient T cells toward a healthy T-cell transcriptome profile.
Avadomide induces IFN type I and II signaling in patient T cells encompassing activation, exhaustion, and cytotoxicity and normalizes deregulated IFN and chemokine gene expression in previously exhausted T cells. (A) Top differential hallmark pathways between vehicle and avadomide treatment. Normalized enrichment scores (NES) represent the mean score over avadomide-treated samples, with positive scores indicating upregulation with avadomide treatment relative to vehicle control. (B) Heatmap of top immune pathways enriched by avadomide treatment, shown under multiple treatment conditions. Cell colors indicate mean NES for each pathway, indicating directionality and strength of the gene pathway changes. (C) Heatmap of selected IFN genes deregulated by avadomide treatment shown under multiple treatment conditions for multiple patient subsets indicated. Cell colors indicate the mean log fold change of expression compared with vehicle control, with positive values (red) or negative values (blue) indicating upregulation or downregulation respectively compared with vehicle. (D) Barcode enrichment plot for a gene signature upregulated in age-matched healthy donor CD4+ T cells compared with CLL patient CD4+ T cells (GSE8835_HEALTHY_VS_CLL_CD4_TCELL_UP) that is significantly upregulated by avadomide treatment. These data support normalization of deregulated IFN gene expression in previously exhausted patient T cells toward a healthy T-cell transcriptome profile.
Avadomide induces an inflammatory T-cell secretome and motility
These data led us to investigate whether avadomide promoted the release of proinflammatory mediators within the T-cell secretome. Antibody arrays revealed that avadomide, as well as its combination with anti-PD-1, induced the secretion of several proinflammatory (IL-2, tumor necrosis factor-α) and chemotactic cytokines (CXCL10, CCL5) (Figure 5A-B). In contrast, anti-PD-1 alone had little effect on the production of cytokines from patient T cells. In keeping with our transcriptome data, multiplex immunoassays confirmed the consistent enrichment of immunoregulatory and chemoattractant cytokines including CXCL1056,57 within the culture supernatants of T cells treated with avadomide alone or in combination with anti-PD-1 or anti-PD-L1 (including significantly increased CXCL10 production with combination therapy compared with avadomide alone) (Figure 5C). We next assessed the impact of treatment on T-cell migration.31,32 Time-lapse microscopy assays showed that avadomide, as well as anti-PD-1 or anti-PD-L1 alone, enhanced T-cell motility compared with vehicle treatment (Figure 5D). However, compared with these drugs alone, avadomide plus anti-PD-1 or anti-PD-L1 increased T-cell migration rates. We next hypothesized that a chemokine-enriched secretome could attract additional T cells. To test this, we collected the culture supernatants of avadomide-treated patient T cells and performed chemotaxis assays with untreated autologous T cells. The conditioned media of avadomide-treated T cells increased the recruitment of T cells, which was further enhanced when avadomide was paired with PD-L1/PD-1 blockade (Figure 5E). This augmented T-cell migration was reduced by cotreating patient T cells with a neutralizing antibody targeting CXCR3, the receptor for CXCL9-11 (Figure 5F). Collectively, our data suggest that the ability of avadomide to activate IFN-activated chemokine and cytoskeletal signaling in patient T cells could enhance the recruitment and functionality of immune cells in the TME.
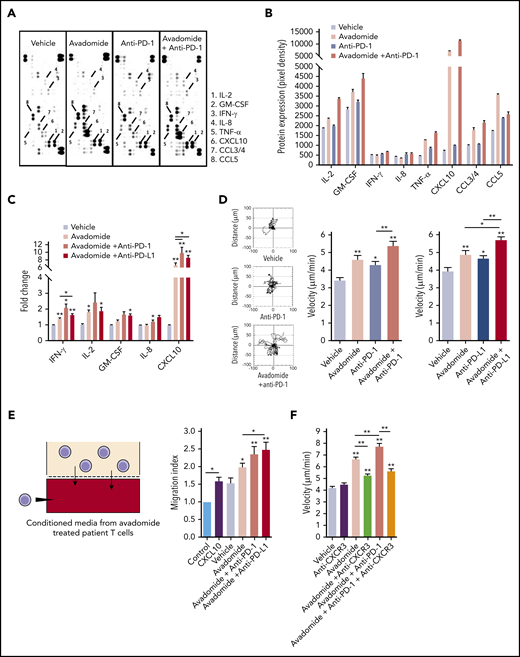
Avadomide and its combination PD-L1/PD-1 blockade induces an inflammatory T-cell secretome and enhances T-cell motility. (A) Representative scanned dot blot from a cytokine array hybridized with culture supernatants from treated patient T cells. (B) Quantification of the secretome dot blots of conditioned media from treated patient T cells. Data show the mean pixel intensity (representative of 3 patients). (C) Luminex FLEXMAP 3D cytokine bead array data shown as fold change (compared with untreated cells) for the indicated cytokines in treated patient T-cell culture supernatants (n = 10). (D) Representative migratory tracks of individual patient T cells are shown in the far-left plots. Bar charts show speed of T-cell migration following the anti-PD-1-based (left) and anti-PD-L1-based (right) immunotherapy treatments indicated (n = 6 patients, minimum of 15 cells per patient sample treatment). (E) Illustration of the chemotaxis assay of autologous T cells toward conditioned media (lower well) derived from avadomide treated patient T cells and quantification of autologous T-cell migration toward treated T cell-conditioned media (n = 8). CXCL10 (lower well) included as an assay control. Data are presented as fold change relative to medium alone control. (F) Bar chart showing speed of patient T-cell migration (n = 3) following the drug treatments indicated and in the presence of anti-CXCR3 Abs were indicated. *P < .05; **P < .01; using a Freidman test with Dunn’s multiple comparisons test (C) and a repeated measures 1-way ANOVA with Tukey's multiple comparisons test (D-F). Data presented as mean ± SEM.
Avadomide and its combination PD-L1/PD-1 blockade induces an inflammatory T-cell secretome and enhances T-cell motility. (A) Representative scanned dot blot from a cytokine array hybridized with culture supernatants from treated patient T cells. (B) Quantification of the secretome dot blots of conditioned media from treated patient T cells. Data show the mean pixel intensity (representative of 3 patients). (C) Luminex FLEXMAP 3D cytokine bead array data shown as fold change (compared with untreated cells) for the indicated cytokines in treated patient T-cell culture supernatants (n = 10). (D) Representative migratory tracks of individual patient T cells are shown in the far-left plots. Bar charts show speed of T-cell migration following the anti-PD-1-based (left) and anti-PD-L1-based (right) immunotherapy treatments indicated (n = 6 patients, minimum of 15 cells per patient sample treatment). (E) Illustration of the chemotaxis assay of autologous T cells toward conditioned media (lower well) derived from avadomide treated patient T cells and quantification of autologous T-cell migration toward treated T cell-conditioned media (n = 8). CXCL10 (lower well) included as an assay control. Data are presented as fold change relative to medium alone control. (F) Bar chart showing speed of patient T-cell migration (n = 3) following the drug treatments indicated and in the presence of anti-CXCR3 Abs were indicated. *P < .05; **P < .01; using a Freidman test with Dunn’s multiple comparisons test (C) and a repeated measures 1-way ANOVA with Tukey's multiple comparisons test (D-F). Data presented as mean ± SEM.
Therapeutic avadomide plus anti-PD-L1 therapy reduces established tumor burden in patient-derived xenografts
Next, we tested the immunomodulatory and anti-tumor activity of avadomide and checkpoint blockade using a patient-derived xenograft model. CLL cells and T cells engraft in the murine spleen and have been shown to effectively model the lymphoid TME and activated signaling pathways.58,59 This human-based in vivo model was chosen as murine cereblon is known to be resistant to CELMoD-mediated Aiolos and Ikaros degradation.60 Mice with established tumors (3 weeks after xenografting) were treated with a single dose of avadomide or anti-PD-L1 alone or in combination for 6 days. We first measured the effect of these treatments on T-cell activation within the splenic TME and found that the percentage of CD25+ CD8+ T cells increased following avadomide and combination anti-PD-L1 therapy (Figure 6A). In contrast, this stimulatory effect was less evident in the patient CD4+ T-cell compartment (supplemental Figure 6A). Notably, avadomide therapy increased the frequency of PD-L1+ CD8+ T cells and CLL cells (Figure 6B; supplemental Figure 6C), whereas expression of PD-1 did not change (supplemental Figure 6B).61,62 Confocal microscopy corroborated the ability of avadomide to induce PD-L1 expression within the immune TME (Figure 6C) and triggered CD8+ T cells to increase in number and infiltrate tumor areas more vigorously (Figure 6D). We found that CD4+ T cells localized mainly within CLL nodules at baseline (vehicle) intermixed with tumor cells, in keeping with their pro-tumor role.58 In contrast, CD8+ T cells exhibited a tumor-excluded localization pattern at baseline that converted to a tumor-infiltrated pattern following avadomide treatment, maximally augmented with combination therapy. Avadomide and its pairing with anti-PD-L1 significantly increased the percentage of CD8+ T cells infiltrating spleen tissues (supplemental Figure 6D). In addition, proliferation assays confirmed that avadomide increased T-cell expansion, with the highest fraction of proliferating cells detected in the CD8+ compartment, particularly with combination therapy (supplemental Figure 6E). In contrast, we confirmed that avadomide exhibited anti-proliferative activity in CLL cells that was detected between 4 to 6 days in a long-term coculture model but was not directly cytotoxic to tumor cells (supplemental Figure 7A-C).39 In harmony with our earlier data, we detected increased CXCL10 and CXCR3 expression on infiltrating CD8+ T cells following avadomide therapy (Figure 6E). Immunofluorescent scanning revealed a marked increase in CD8+ T cells within the splenic TME following avadomide and combination therapy (Figure 6F). We also found that CD8+ T cells from avadomide- or combination therapy-treated tumors showed a higher expression of granzyme B+ cytolytic cells (Figure 6G).63,64 Importantly, in all patient samples tested (supplemental Table 4), avadomide plus ant-PD-L1 combination therapy resulted in greater tumor reduction than did either treatment alone (Figure 6H-J). Notably, the xenograft model was refractory to anti-PD-L1 monotherapy. We also demonstrated that avadomide plus anti-PD-1 showed comparable anti-CLL efficacy to anti-PD-L1 combination therapy (supplemental Figure 6F). Last, we tested whether the activity of avadomide was dependent on the presence of CD8+ T cells. Prior depletion of these cytolytic cells prevented the ability of avadomide plus anti-PD-L1 to trigger autologous CLL killing (supplemental Figure 6G). Taken together, although we demonstrate relevant anti-proliferative activity against CLL cells, we believe both our in vitro and in vivo data effectively model the ability of avadomide to stimulate cytotoxic T-cell activity. These in vivo results support the concept that triggering IFN-driven T-cell responses with avadomide could convert noninflamed CLL tumors into CD8+ T cell-inflamed ones that could then respond to checkpoint blockade therapy.

Therapeutic avadomide converts CD8+ T cell excluded (noninflamed) patient-derived xenografts into CD8+ T cell-inflamed tumors that respond to anti-PD-L1 combination therapy. (A) Flow cytometric percentage of patient CD8+ CD25+ T cells harvested from CLL patient-derived xenograft splenic TMEs following drug treatments (n = 6 patient samples, 3-4 mice per patient sample treatment group). (B) Representative flow cytometric histograms of PD-L1 expression on patient CD4+, CD8+ T cells, and CD5+ CD19+ CLL cells harvested from the splenic TME comparing vehicle (blue) and avadomide (red) treated mice. Representative multispectral immunofluorescence images of splenic TME tissue (n = 6 patient samples) from treated mice (C) for human CD20 (blue), CD8+ (green), CD4+ (red) patient T cells and PD-L1 (white); (D) for human CD20 (blue), CD8+ (green) and CD4+ (red) patient T cells; (E) for human CD20 (blue), CD8+ (green), CXCL10 (red), and CXCR3 (white); (G) for human CD20 (blue), CD8+ (green), CD4+ (red) patient T cells, and granzyme B (GZMB) (white). Original magnification, ×20 medial optical section images (scale bar = 100 μm for panels C-E and 20 μm for panel G) and 3D volume rendered confocal images of intercellular PD-L1+ (C) or GZMB+ (G) CD8+ T cell interactions (white/green) with CLL cells (blue) with treatments (cropped, ×20 images). (F) Representative large images acquired by an Olympus BX61VS fluorescence slide scanner (original magnification, ×4, scale bar = 200 μm) of splenic TME tissue (n = 6 patient samples) from treated mice for human CD20 (blue) and CD8+ (green) patient T cells. (H) CLL tumor burden in splenic TMEs. Flow cytometric percentage of human CD5+ CD19+ CLL cells of tissue splenocytes (total nucleated cells, human and murine) (n = 6 patient samples, 3-4 mice per patient sample treatment group) analyzed from splenic TMEs following drug treatments. (I) Representative pictures of patient-derived xenograft splenic TME tissues. An established tumor (CLL PBMC engrafted spleen) in comparison with a nondiseased healthy murine spleen is shown (top). Xenograft splenic TME tissues are shown following different treatments (scale bar = 2 cm). (J) Weight of xenograft (n = 3 patient samples) spleen TME tissues following drug treatments. *P < .05; **P < .01; ns, not significant using a repeated measures 1-way ANOVA with Tukey's multiple comparisons test (A,H,J). Data presented as mean ± SEM.
Therapeutic avadomide converts CD8+ T cell excluded (noninflamed) patient-derived xenografts into CD8+ T cell-inflamed tumors that respond to anti-PD-L1 combination therapy. (A) Flow cytometric percentage of patient CD8+ CD25+ T cells harvested from CLL patient-derived xenograft splenic TMEs following drug treatments (n = 6 patient samples, 3-4 mice per patient sample treatment group). (B) Representative flow cytometric histograms of PD-L1 expression on patient CD4+, CD8+ T cells, and CD5+ CD19+ CLL cells harvested from the splenic TME comparing vehicle (blue) and avadomide (red) treated mice. Representative multispectral immunofluorescence images of splenic TME tissue (n = 6 patient samples) from treated mice (C) for human CD20 (blue), CD8+ (green), CD4+ (red) patient T cells and PD-L1 (white); (D) for human CD20 (blue), CD8+ (green) and CD4+ (red) patient T cells; (E) for human CD20 (blue), CD8+ (green), CXCL10 (red), and CXCR3 (white); (G) for human CD20 (blue), CD8+ (green), CD4+ (red) patient T cells, and granzyme B (GZMB) (white). Original magnification, ×20 medial optical section images (scale bar = 100 μm for panels C-E and 20 μm for panel G) and 3D volume rendered confocal images of intercellular PD-L1+ (C) or GZMB+ (G) CD8+ T cell interactions (white/green) with CLL cells (blue) with treatments (cropped, ×20 images). (F) Representative large images acquired by an Olympus BX61VS fluorescence slide scanner (original magnification, ×4, scale bar = 200 μm) of splenic TME tissue (n = 6 patient samples) from treated mice for human CD20 (blue) and CD8+ (green) patient T cells. (H) CLL tumor burden in splenic TMEs. Flow cytometric percentage of human CD5+ CD19+ CLL cells of tissue splenocytes (total nucleated cells, human and murine) (n = 6 patient samples, 3-4 mice per patient sample treatment group) analyzed from splenic TMEs following drug treatments. (I) Representative pictures of patient-derived xenograft splenic TME tissues. An established tumor (CLL PBMC engrafted spleen) in comparison with a nondiseased healthy murine spleen is shown (top). Xenograft splenic TME tissues are shown following different treatments (scale bar = 2 cm). (J) Weight of xenograft (n = 3 patient samples) spleen TME tissues following drug treatments. *P < .05; **P < .01; ns, not significant using a repeated measures 1-way ANOVA with Tukey's multiple comparisons test (A,H,J). Data presented as mean ± SEM.
Avadomide-based therapy triggers T-cell activation and intratumoral chemokine signaling in DLBCL
Finally, to validate our preclinical findings, we compared the expression of T cell cosignaling molecules in pretreatment and early on-treatment peripheral blood samples from R/R CLL patients treated with avadomide plus obinutuzumab therapy (supplemental Figure 8). Although only a small number of patient samples were available and hence our analysis could not reach the threshold of statistical significance, our immunophenotyping showed a trend for avadomide-based therapy to increase PD-L1 expression, as well as the CD28-superfamily member ICOS on T cells (Figure 7A-B), which localized to repaired T-cell synapses (Figure 7C). In contrast, PD-1 expression on CD8+ T cells showed a decreased trend with therapy. We further examined intratumoral chemokine signaling using RNA-seq data from paired pretreatment and on-treatment (2 weeks) tumor biopsies from patients with R/R DLBCL treated with avadomide monotherapy (CC-122-ST-001; NCT01421524).35 We examined the expression level of a set of 61 chemokine signaling genes that were selected based on our earlier pathway analysis of avadomide-treated patient T cells (Figure 4). The intratumoral expression of all 61 genes including chemokines Cxcl9-11 increased in avadomide on-treatment biopsies compared with screening, of which 31 genes were significantly enriched (Figure 7D). Thus, these clinical immune and tumor monitoring results indicate that avadomide is an effective drug to stimulate IFN-response signatures in B-cell malignancy.
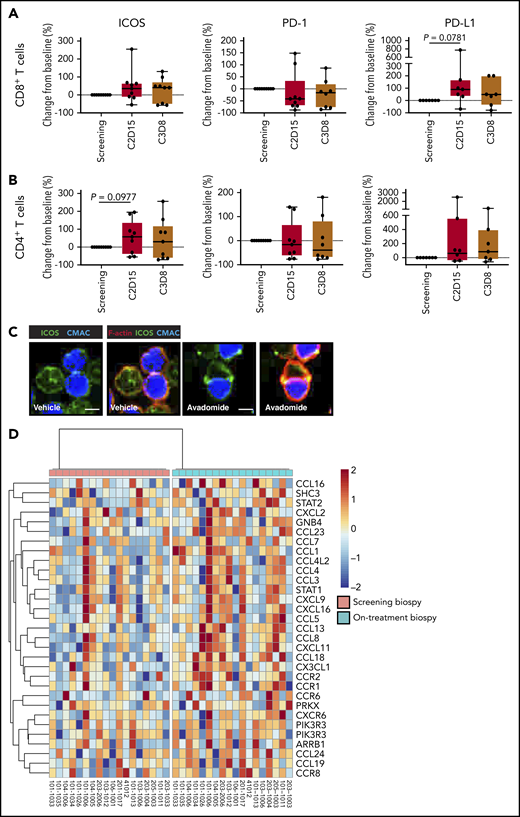
In vivo avadomide-based therapy effect on immune activation in peripheral blood and tumor biopsies. Immunophenotyping flow cytometric measurements for ICOS, PD-1, and PD-L1-positive (A) CD8+ T cells and (B) CD4+ T cells from the peripheral blood of CLL patients (n = 7-9) treated with avadomide and obinutuzumab therapy. Cycle 2, day 15, and cycle 3, day 8 data are compared with baseline (screening blood samples analysis). (C) Representative cropped medial optical section confocal images of CD8+ T-cell conjugates with autologous CLL tumor cells (blue) showing increased ICOS (green) at F-actin (red) immune synapses with avadomide treatment. Original magnification, ×63 (scale bars: 10 μm). (D) RNA-seq was performed on paired lymph node tissue biopsies from 18 R/R DLBCL patients at screening (baseline) and following avadomide therapy (on-treatment, cycle 1, day 10/15) (clinical trial: NCT01421524). The heatmap shows the relative expression and significant enrichment (P < .05) of chemokine signaling pathway genes (KEGG_CHEMOKINE_SIGNALING_PATHWAY) following avadomide therapy in DLBCL.
In vivo avadomide-based therapy effect on immune activation in peripheral blood and tumor biopsies. Immunophenotyping flow cytometric measurements for ICOS, PD-1, and PD-L1-positive (A) CD8+ T cells and (B) CD4+ T cells from the peripheral blood of CLL patients (n = 7-9) treated with avadomide and obinutuzumab therapy. Cycle 2, day 15, and cycle 3, day 8 data are compared with baseline (screening blood samples analysis). (C) Representative cropped medial optical section confocal images of CD8+ T-cell conjugates with autologous CLL tumor cells (blue) showing increased ICOS (green) at F-actin (red) immune synapses with avadomide treatment. Original magnification, ×63 (scale bars: 10 μm). (D) RNA-seq was performed on paired lymph node tissue biopsies from 18 R/R DLBCL patients at screening (baseline) and following avadomide therapy (on-treatment, cycle 1, day 10/15) (clinical trial: NCT01421524). The heatmap shows the relative expression and significant enrichment (P < .05) of chemokine signaling pathway genes (KEGG_CHEMOKINE_SIGNALING_PATHWAY) following avadomide therapy in DLBCL.
Discussion
Our study provides evidence that CLL can harbor noninflamed TMEs that are defined by a paucity of preexisting cytolytic CD8+ T cells and low expression of PD-L1.1,22,47 This could help explain why anti-PD-1 therapy alone failed to clinically (re)activate anti-CLL T-cell activity.8 PD-L1 expression on tumor cells,5 and unexpectedly on immune cells,65 can be predictive of response to checkpoint inhibitors across tumor types. Notably, we show that PD-L1, as well as PD-1, are predominately expressed by a proportion of T cells in the immunosuppressive CLL TME, rather than on tumor cells. Interestingly, targeting T cell-associated PD-L1 enhanced their cytolytic activity and migratory function. These findings indicate that T cell PD-L1 signaling in cis66,67 and/or in trans between surrounding T cells and CLL cells23,68,69 contributes to the negative regulation of T-cell responses in CLL, in addition to the known interactions of PD-1+ T cells with PD-L1+ tumor and other TME cells.9,70,71 However, in vitro and in vivo assays showed that anti-PD-1 and anti-PD-L1 monotherapies were largely ineffective at overcoming T-cell tolerance in CLL.
Importantly, our study reveals that avadomide represents a candidate for combination therapy with PD-L1/PD-1 axis blockade. Through in vitro and in vivo mechanistic studies, we demonstrate that avadomide reprograms patient T cells by triggering IFN-inducible activated T-cell biology gene signatures, which complement PD-L1/PD-1 blockade. Our studies reveal that avadomide stimulates the proliferation and release of chemokines by T cells that can recruit additional CD8+ T cells, upregulates PD-L1 in the immune TME, and enhances T-cell lytic synapse formation. When combined with therapeutic anti-PD-L1, we detected enhanced activation of cytotoxic CD8+ T cells in treated patient-derived xenograft tumors, resulting in tumor shrinkage. Notably, we find that CLL patients receiving avadomide-based therapy show increased expression of PD-L1 on circulating T cells, confirming our laboratory findings that avadomide unleashes IFN responses in this immune compartment. We also show that avadomide can induce intratumoral chemokine gene expression in treated DLBCL patients, further supporting the induction of IFN-inducible biology. Clinical correlative studies of avadomide monotherapy in R/R DLBCL have shown pharmacodynamic effects on T-cell activation and trafficking within the TME, consistent with our CLL model dataset.35 Interestingly, T cell-rich DLBCL TMEs at baseline correlated with improved outcome, highlighting the relevance of immune cells for CELMoD activity. Notably, avadomide has been shown to induce IFN-stimulated genes in DLBCL tumor cells resulting in their apoptosis.38 In contrast, we show that avadomide has an anti-proliferative effect on CLL cells but did not induce direct tumor B-cell apoptosis. Blocking proliferation is likely to be a direct IFN-α signaling effect in CLL tumor cells; however, this concept was not pursued in this study. Instead, we reveal for the first time that avadomide can elicit both type I and type II IFN-induced inflammatory signaling in previously exhausted patient T cells. Ikaros has been shown to be a critical repressor of the gene program associated with the response to type I IFN in mature T cells using a knock-out murine model that is in keeping with our data, revealing the ability of avadomide to derepress type I IFN and inflammatory signaling in previously exhausted patient T cells. In contrast, predominantly type II IFN-γ-associated T-cell responses have been reported for lenalidomide treatment72 that could reflect the reduced depth of Ikaros degradation induced by this immunomodulatory drug compared with avadomide. Our data using avadomide support the concept of therapeutically reshaping noninflamed CLL and NHL tumors into T cell-inflamed TMEs,22,56 which could engage both innate and adaptive immunity, to overcome resistance to checkpoint blockade. There is substantial evidence demonstrating that type I and II IFN signaling is required within TMEs to prevent development of an immunosuppressive state.73,74 In line with impaired IFN signaling in T cells representing a common immune defect in cancer,75 our analysis of T cells from treatment-naïve CLL patients showed that they express deregulated IFN type I and II signaling genes compared with healthy age-matched control T cells.30,76 Our study supports the ability of avadomide to normalize dysfunctional IFN signaling, chemokine expression and cytotoxic effector gene pathways in previously exhausted patient T cells.
These insights should facilitate the development of optimal combination therapies of CELMoDs or other IFN-inducing drugs, such as STING agonists,77,78 with checkpoint inhibitors. There is a growing appreciation of the importance of IFN signaling in the TME and response to chemotherapy, radiotherapy, as well as immunotherapy.18,20,21,74,79 However, although mimicking an IFN-induced antiviral state in tumors appears attractive, it is important to note that studies are also revealing that IFNs can act as double-edged swords, promoting both feedforward and feedback inhibitory mechanisms.80 Persistent IFN signaling in chronic virus infections and cancer can be immunosuppressive by inducing PD-L1, IDO, and LAG-3.80,81 Our transcriptome and functional data revealed that avadomide induced these negative-feedback molecules including increased PD-L1 expression on reactivated T cells and CLL cells. Our in vitro and in vivo data demonstrated improved anti-CLL efficacy when avadomide was combined with PD-L1/PD-1 blockade, supporting combination approaches that bypass IFN-induced negative feedback and optimally activate cytolytic T cells. Type I IFN modulating drugs and lenalidomide have shown efficacy against hematological malignancies, but a major barrier has been dose-limiting toxicity.36,74,82,83 Notably, an increased incidence of severe adverse events including deaths has been associated with the combination of immunomodulatory drugs with anti-PD-1 in multiple myeloma.84,85 This clinical experience underscores the risks of developing combination immunotherapy for hematological tumors, as well as the requirement for optimal trial design when testing immunomodulatory agents. However, the lack of clinical activity of anti-PD-1 monotherapy in NHL7 and CLL8 has highlighted the need to incorporate checkpoint blockade therapies into more powerful combinations to unleash the power of anti-tumor immune cells, with potential therapeutic partners including CELMoDs and immunomodulatory drugs, CAR T cells, and bispecific antibodies.86,87 The field will have to carefully manage the expected toxicity of activating anti-tumor immune responses, as well as the direct and indirect effects of these powerful therapies on malignant B cells within lymphoid TMEs that can all contribute to serious immune-related adverse effects and cytokine release syndrome in patients. It may be that CELMoDs will work best with carefully timed dosing to avoid inducing chronic IFN signaling that could promote suppressive or refractory mechanisms within the immune TME80 and in a tumor-debulked or lower burden scenario.88 Combining checkpoint blockade with avadomide/CELMoDs could represent a powerful combination strategy for deepening targeted drug (eg, BTK inhibitor)-induced responses51,89 and working toward curative therapy in CLL.3 Defining CD8+ T-cell/immune cells, checkpoints, and IFN-associated signatures within the immune TME could represent important correlative biomarkers for predicting and monitoring activity, toxicity, and resistance.1,81,90 Collectively, this preclinical study using CLL as a model B-cell malignancy, provides proof of concept that inducing inflammatory IFN type I and II signaling in patient T cells can successfully reshape anti-tumor T-cell responses and sensitize CLL to immune checkpoint blockade.
Presented during the 60th annual meeting of the American Society of Hematology, San Diego, CA, 1-4 December 2018.
The publication costs of this article were defrayed in part by page charge payment. Therefore, and solely to indicate this fact, this article is hereby marked “advertisement” in accordance with 18 USC section 1734.
The RNA-seq data reported in this article have been deposited in the Gene Expression Omnibus database (GSE148476).
For original data sets and protocols, please contact corresponding author Alan G. Ramsay by e-mail (alan.ramsay@kcl.ac.uk).
The online version of this article contains a data supplement.
Acknowledgments
The authors thank the Nikon Imaging Facility at King’s College London and the UK CLL forum.
This work was supported by Bristol-Myers Squibb as part of a research collaboration, in addition to research charity support from the British Society of Haematology (fellowship, A.G.R.) and Blood Cancer UK (14025, A.G.R.). This study was coordinated in part by the ECOG-ACRIN Cancer Research Group (Peter J. O'Dwyer and Mitchell D. Schnall, Group cochairs) and supported by grants from the National Institutes of Health National Cancer Institute (RO1CA193541, U10CA180820, UG1CA232760, UG1CA233290). The content is solely the responsibility of the authors and does not necessarily represent the official views of the National Institutes of Health, nor does mention of trade names, commercial products, or organizations imply endorsement by the US government.
Authorship
Contribution: N.I. designed, performed experimental work and data analysis, and wrote the manuscript; P.R.H. and A.K.G. designed and supervised the study; M.S. performed transcriptome data analysis; B.A., M.F., D.P., H.C., A.L.-G., and P.J. performed experimental work; L.-A.S. and R.R. contributed to study design and R.-M.A. performed pathological analysis; F.T.A., J.J., N.E.K., T.D.S., M.S.T., K.S., P.E.M.P., and A.V. contributed to study design and collected data; and A.G.R. designed and supervised the study and wrote the manuscript.
Conflict-of-interest disclosure: P.R.H., A.K.G., J.J., H.C., A.L.-G., and P.J. are employees of Bristol-Myers Squibb and have equity ownership with Bristol-Myers Squibb. T.D.S. and N.E.K. report research support to institution from Genentech, AbbVie, Jannsen, and Pharmacyclics. A.G.R. has received research support to institution from Bristol-Myers Squibb, AstraZeneca, and Roche Glycart AG. The remaining authors declare no competing financial interests.
The current affiliation for F.T.A. is Harold C. Simmons Comprehensive Cancer Center, University of Texas Southwestern Medical Center, Dallas, TX.
Correspondence: Alan G. Ramsay, Lymphoma Immunology, Innovation Hub, Guy’s Cancer Centre, Great Maze Pond, London, SE1 9RT, United Kingdom; e-mail: alan.ramsay@kcl.ac.uk.

This feature is available to Subscribers Only
Sign In or Create an Account Close Modal