

Key Points
Loss of miR-15a/16-1 induces widespread alterations in GC B cells and promotes plasma and mature B-cell neoplasms in mice.
Human primary EPs are characterized by low miR-15a/16 expression, frequent del(13q), and rare hyperdiploidy.

Abstract
Chromosome 13q deletion [del(13q)], harboring the miR-15a/16-1 cluster, is one of the most common genetic alterations in mature B-cell malignancies, which originate from germinal center (GC) and post-GC B cells. Moreover, miR-15a/16 expression is frequently reduced in lymphoma and multiple myeloma (MM) cells without del(13q), suggesting important tumor-suppressor activity. However, the role of miR-15a/16-1 in B-cell activation and initiation of mature B-cell neoplasms remains to be determined. We show that conditional deletion of the miR-15a/16-1 cluster in murine GC B cells induces moderate but widespread molecular and functional changes including an increased number of GC B cells, percentage of dark zone B cells, and maturation into plasma cells. With time, this leads to development of mature B-cell neoplasms resembling human extramedullary plasmacytoma (EP) as well as follicular and diffuse large B-cell lymphomas. The indolent nature and lack of bone marrow involvement of EP in our murine model resembles human primary EP rather than MM that has progressed to extramedullary disease. We corroborate human primary EP having low levels of miR-15a/16 expression, with del(13q) being the most common genetic loss. Additionally, we show that, although the mutational profile of human EP is similar to MM, there are some exceptions such as the low frequency of hyperdiploidy in EP, which could account for different disease presentation. Taken together, our studies highlight the significant role of the miR-15a/16-1 cluster in the regulation of the GC reaction and its fundamental context-dependent tumor-suppression function in plasma cell and B-cell malignancies.
Introduction
MicroRNAs (miRs) are short noncoding RNAs that regulate gene expression by repressing messenger RNA (mRNA) translation or inducing its degradation.1 Each miR regulates expression of many different target genes and simultaneously modulates multiple pathways.2-4 Thereby, miRs play key roles in nearly all normal cellular processes, and their aberrant expression is linked to the pathogenesis of various human cancers.5
miRs are also implicated in normal and pathological processes in B cells.6 Upon B-cell receptor (BCR) antigen stimulation, follicular (Fo) B cells undergo T-cell–dependent (TD) activation, whereas marginal zone (MZ) and B1 B cells undergo mainly T-cell–independent (TI) activation.7,8 During TD activation, Fo B cells form germinal centers (GCs) and undergo affinity maturation during the GC reaction, a process regulated by several miRs including miR-155, miR-125b, miR-28, and miR-217.9-13 Although the GC reaction is essential for normal acquired immunity and generation of plasma cells (PCs), it substantially increases the risk of aberrant gene mutations resulting in lymphomagenesis due to ongoing activation-induced cytidine deaminase (AID)-driven somatic hypermutation and class-switch recombination, associated with tolerance for DNA damage and high proliferation.14,15 This is evidenced by the GC or post-GC origin of most B-cell lymphomas.14,16
miR-15a and miR-16 (encoded by the miR-15a/16-1 cluster) were among the first miRs implicated in cancer pathogenesis.17 The miR-15a/16-1 cluster resides within a minimal deleted region of chromosome 13q14 [del(13)(q14)], which is a frequent somatic deletion observed in B-cell malignancies, including chronic lymphocytic lymphoma (CLL), MZ lymphoma, follicular lymphoma (FL), diffuse large B-cell lymphoma (DLBCL), and multiple myeloma (MM), a neoplasm of PCs that preferentially localize within the bone marrow (BM).18-24 In MM, del(13q) is one of the most common genetic abnormalities and occurs early in the pathogenesis.25,26 Moreover, miR-15a/16 expression is reduced even in MM cells without del(13q), suggesting a critical tumor-suppressive role of miR-15a/16-1 in MM pathogenesis.27
CD19Cre-induced deletion of miR-15a/16-1 in mice promotes the development of a pre-GC CLL-like spectrum of B-cell malignancies.28 Moreover, it was recently documented that germline loss of the miR-15a/16-1 cluster accelerates the onset and promotes MM progression in Vκ-MYC mice, but is insufficient by itself for malignant transformation.29 Although these models provide biological insight into the tumor-suppression role of miR-15a/16, its function during the GC reaction and how it promotes initiation and lymphomagenesis in mature B cells on its own remains unknown. Therefore, we induced somatic deletion of the miR-15a/16-1 cluster during murine B-cell activation and showed that it results in broad molecular and functional changes of GC B cells, which in association with secondary mutations led to development of mature B-cell neoplasms resembling human extramedullary plasmacytoma (EP), FL, and DLBCL. We corroborated the tumor-suppressing role of miR-15a/16 in human primary EPs and compared their genetic makeup with MM.
Methods
Engineered mice
Mouse strains bearing a loxP-flanked miR-15a/16-1 cluster (miR-15a/16-1fl)28 or Aicda promoter-driven Cre recombinase knock-in allele (AIDCre)30 were crossed to generate cohorts of AIDCre/+ (wild-type [WT]) control and AIDCre/+;miR-15a/16-1fl/fl (knockout [KO]) compound mice (C57BL/6). For B-cell studies, 3-month old mice were immunized by intraperitoneal injection of 5 × 10⁸ sheep red blood cells (SRBCs; Innovative Research) and analyzed 10 days later.31 All animal experiments were approved by the Institutional Animal Care and Use Committee of the Dana-Farber Cancer Institute (DFCI).
Human samples
Archival formalin-fixed paraffin-embedded (FFPE) lymph nodes (LNs) from healthy individuals and EP samples were obtained from the Pathology Department at Brigham and Women’s Hospital. The use of human material was approved by the DFCI Institutional Review Board, in compliance with the Helsinki Declaration.
Histopathology, IHC, miR ISH, and immunofluorescence/ISH double stains, image acquisition, and analyses
Mice were euthanized at specified time points or when clinical signs of disease were evident; a full histologic examination was performed on each animal to assess for tumor formation. Immunohistochemistry (IHC) was performed according to standard protocols and manufacturers’ recommendations as described.32 Lymphoid organs and long bones of the leg were processed likewise, except bones were additionally decalcified using Cal-Ex (Fisher Scientific). For detailed in situ hybridization (ISH) protocols, image acquisition, and analyses, see supplemental Methods (available on the Blood Web site).
Flow cytometry, sorting, and immunoblotting
Single-cell suspensions from mouse spleens or LNs were prepared and stained with Zombie Aqua (BioLegend) and primary antibodies (supplemental Table 1) as described.32 Cells were analyzed using LSRFortessa (BD Biosciences) or sorted using FACSAria II (BD Biosciences).
Immunoblotting analyses were performed according to standard protocols32 and manufacturers’ recommendations using antibodies listed in supplemental Table 1.
PCR, clonality assessment, IgH variable region mutation analysis, expression profiling, amplicon and WES
DNA and RNA were isolated from sorted cells and tumor samples with AllPrep DNA/RNA Micro and FFPE kits (Qiagen), respectively. Cre-mediated excision of the miR-15a/16-1 conditional allele was analyzed by polymerase chain reaction (PCR) as described.28 RNA was used for reverse transcription quantitative PCR (RT-qPCR) analysis of miR expression using TaqMan miR assays (supplemental Table 2; Thermo Fisher Scientific). Three animals per group were analyzed, and all experiments were conducted in triplicates. Human and mouse miR-15a-5p and miR-16-1-5p sequences were compared using Clustal Omega.33
Genomic DNA was isolated from tumors harvested from KO mice using Gentra Puregene (Qiagen). Immunoglobulin heavy chain (IgH) gene rearrangements were analyzed using Southern blotting as described.34 For details on mutation analysis, see supplemental Methods.
Expression of miR-15a, miR-15b, and miR-16 was compared in primary MM subtypes from GSE1655835 using GEO2R.36 Vegfa expression in murine GC B cells was evaluated in GSE11961 and GSE38696.37,38
Whole-exome sequencing (WES) was performed on FFPE samples from (i) 2 mouse tumors as well as 1 control spleen from a heathy animal (PRJNA661046), and (ii) 11 human primary EP cases as well as a control sample (CEPH-1408; PRJNA661244). For details on WES and amplicon sequencing, see supplemental Methods.
Proteomics
Quantitative proteomic analysis of sorted GC B cells from WT (n = 5) and KO (n = 5) mice (PXD021323) was performed using tandem mass tag 10-plex labeling (Thermo Fisher) and liquid chromatography coupled with tandem mass spectrometry (MS) analysis. For details, see supplemental Methods.
Results
miR-15a and miR-16 are highly expressed in GC B cells and PCs, and are downregulated in MM cells with del(13q)
Because the miR-15a/16-1 cluster functions as a tumor suppressor in the pathogenesis of mature B-cell malignancies,39 we first investigated its expression during B-cell activation and differentiation into PCs in human LNs using immunofluorescence (IF)/ISH double staining. We found increased expression of miR-15a and miR-16 in CD138+ PCs as compared with surrounding lymphoid non-PCs (Figure 1A). ISH analysis for miR-15a/16 and IHC for CD138 on serial consecutive (5 µm apart) sections from a different individual likewise showed increased expression of miR-15a/16 in PCs (Figure 1B). miR-15a/16 levels were also higher in GCs compared with Fo B cells. We showed that most of the miR-15a and miR-16 signal comes from CD10+ GC B cells and not T-follicular helper cells or PCs also residing within GCs (supplemental Figure 1A-B).
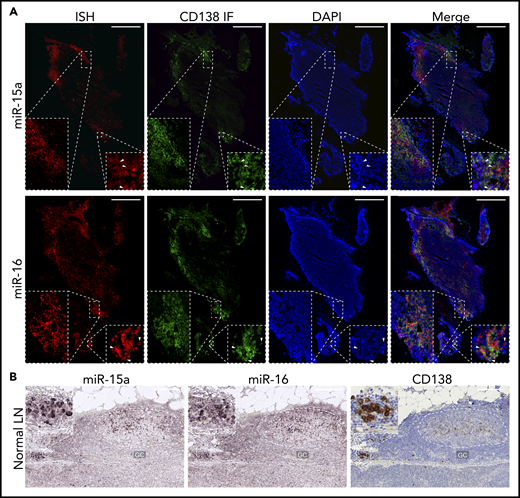
miR-15a/16 expression in normal human lymphoid tissues and MM cells. (A) miR-15a or miR-16 colocalization with PC marker CD138 in human LNs. CD138 expression was assessed by IF (green), followed by ISH analysis for miR abundance (red) on the same frozen slide. 4′,6-Diamidino-2-phenylindole (DAPI; blue) was used for nuclear counterstaining. One representative example is shown. Note colocalization of miR-15a, miR-16 signal, and CD138 in PC-rich regions as well as in individual PCs (insets, arrowheads). Scale bar, 800 µm. (B) miR-15a or miR-16 (ISH, purple) and CD138 (IHC, brown; counterstain, blue) expression in consecutive FFPE LN sections from a healthy individual. Note higher miR-15a and miR-16 abundance in a PC cluster (inset) and germinal center (GC) compared with other lymphoid cells. Scale bar, 200 µm.
miR-15a/16 expression in normal human lymphoid tissues and MM cells. (A) miR-15a or miR-16 colocalization with PC marker CD138 in human LNs. CD138 expression was assessed by IF (green), followed by ISH analysis for miR abundance (red) on the same frozen slide. 4′,6-Diamidino-2-phenylindole (DAPI; blue) was used for nuclear counterstaining. One representative example is shown. Note colocalization of miR-15a, miR-16 signal, and CD138 in PC-rich regions as well as in individual PCs (insets, arrowheads). Scale bar, 800 µm. (B) miR-15a or miR-16 (ISH, purple) and CD138 (IHC, brown; counterstain, blue) expression in consecutive FFPE LN sections from a healthy individual. Note higher miR-15a and miR-16 abundance in a PC cluster (inset) and germinal center (GC) compared with other lymphoid cells. Scale bar, 200 µm.
We next investigated miR-15a/16 expression in MM patients in relation to del(13q) in GSE16558.35 miR-15a levels were found to be significantly lower in MM cells with del(13q) compared with healthy PCs and MM cells without del(13q) (supplemental Figure 1C-D). miR-16 expression followed a similar trend; however, it did not reach statistical significance because the miR-16-1-5p sequence is identical to miR-16-2-5p, which forms a cluster with miR-15b that resides on chromosome 3 (human and mouse).40 In agreement, miR-15b levels were comparable between MM patients’ cells with and without del(13q) and healthy PCs.
AIDCre reduces miR-15a/16 levels in activated B cells bearing a conditional KO
Murine and human miR-15a-5p and miR-16-5p sequences are identical (Figure 2A), and their pattern of expression is similar in lymphoid organs with high GC abundance (supplemental Figure 2A), indicating that mice are an adequate model in which to study the miR-15a/16-1 cluster’s functions during and after B-cell activation. Therefore, we generated cohorts of AIDCre/+;miR-15a/16-1fl/fl compound mice (referred to as KO) and AIDCre/+ control mice (referred to as WT) (Figure 2B). To investigate the pattern and efficiency of AIDCre activity, deletion of the miR-15a/16-1 cluster, and changes in their expression in mature murine B cells, we sorted different lymphocyte subpopulations. miR-15a/16-1 was efficiently deleted, leading to reduction of its expression in GC B cells as well as in most PCs from KO vs WT mice as assessed by PCR, RT-qPCR, and ISH (Figure 2C-E; supplemental Figure 2B). Lesser change in miR-16 expression results, at least in part, from the miR-16-2 presence.40 Moreover, the remaining undeleted band in PCs, at least partially, represents contaminating cells and/or lower Aicda promoter activity during TI responses (Figure 2C).41,42 Fo B cells, consisting mainly of naive B cells, had an undeleted miR-15a/16-1 cluster, whereas a noticeable fraction of MZ B cells showed miR-15a/16-1 deletion and reduction of their expression (Figure 2C-D), which is consistent with AID expression induced in MZ B cells during TD and TI responses.8 Although some reports show that T-cell subpopulations express AID,43 we did not detect miR-15a/16-1 deletion in sorted T cells (Figure 2C). As expected, miR-15b levels remained unchanged between lymphocyte subpopulations isolated from KO and WT mice (Figure 2D-E).

AIDCre-mediated deletion of the miR-15a/16-1 cluster in murine lymphoid cells. (A) Alignment of human and mouse miR-15a-5p and miR-16-5p sequences. (B) Schematic of the strategy used to generate mice with miR-15a/16-1 deletion during B-cell activation. (C) miR-15a/16-1 cluster deletion assessed by PCR in indicated FACS-sorted lymphocyte subpopulations from WT (n = 4) and KO (n = 4) mice. WT locus, 558 bp (bottom band); loxP flanked miR-15a/16-1 cluster, 650 bp (middle band); deleted miR-15a/16-1 cluster, 850 bp (top band). (D) miR-15a, miR-15b, and miR-16 expression in FACS-sorted lymphocyte subpopulations from WT and KO mice, determined by RT-qPCR relative to snoRNA234. Error bars represent standard deviations of 3 independent replicates in a representative experiment. P values were calculated by using the unpaired Student t test. (E) Cre (IHC, brown; counterstain, blue) and miR-15a, miR-15b, and miR-16 expression (ISH, dark purple) in spleen sections of 12-week-old WT and KO mice. One representative example of secondary follicle for each genotype is shown. GCs are highlighted by dotted lines; scale bar, 100 μm. ISH sections were not counterstained to facilitate interpretation (see also supplemental Figure 3A-B). (F) IHC (brown; counterstain, blue) analysis of BCL2 and Ki-67 expression in splenic GCs from mice with indicated genotypes. The BCL2 staining of spleen section from a WT mouse is shown at lower magnification to depict the general pattern of BCL2 expression in murine lymphoid tissue. Note high BCL2 abundance in T cells surrounding periarteriolar sheaths (PS), MZ B cells, and Fo B cells in white pulp (WP) areas, as well as considerably lower BCL2 expression within GCs and red pulp (RP) areas. Scale bar, 50 μm. (G) BCL2 expression in indicated lymphocyte subpopulations from WT and KO mice immunized with SRBCs assessed by immunoblotting. Quantitative differences in protein expression level based on densitometric analysis were normalized to actin and are shown below the blots. Apostrophe indicates longer times of film exposure to exhibit relative differences in protein abundance. Unrelated bands were cut from the immunoblots (dotted line).
AIDCre-mediated deletion of the miR-15a/16-1 cluster in murine lymphoid cells. (A) Alignment of human and mouse miR-15a-5p and miR-16-5p sequences. (B) Schematic of the strategy used to generate mice with miR-15a/16-1 deletion during B-cell activation. (C) miR-15a/16-1 cluster deletion assessed by PCR in indicated FACS-sorted lymphocyte subpopulations from WT (n = 4) and KO (n = 4) mice. WT locus, 558 bp (bottom band); loxP flanked miR-15a/16-1 cluster, 650 bp (middle band); deleted miR-15a/16-1 cluster, 850 bp (top band). (D) miR-15a, miR-15b, and miR-16 expression in FACS-sorted lymphocyte subpopulations from WT and KO mice, determined by RT-qPCR relative to snoRNA234. Error bars represent standard deviations of 3 independent replicates in a representative experiment. P values were calculated by using the unpaired Student t test. (E) Cre (IHC, brown; counterstain, blue) and miR-15a, miR-15b, and miR-16 expression (ISH, dark purple) in spleen sections of 12-week-old WT and KO mice. One representative example of secondary follicle for each genotype is shown. GCs are highlighted by dotted lines; scale bar, 100 μm. ISH sections were not counterstained to facilitate interpretation (see also supplemental Figure 3A-B). (F) IHC (brown; counterstain, blue) analysis of BCL2 and Ki-67 expression in splenic GCs from mice with indicated genotypes. The BCL2 staining of spleen section from a WT mouse is shown at lower magnification to depict the general pattern of BCL2 expression in murine lymphoid tissue. Note high BCL2 abundance in T cells surrounding periarteriolar sheaths (PS), MZ B cells, and Fo B cells in white pulp (WP) areas, as well as considerably lower BCL2 expression within GCs and red pulp (RP) areas. Scale bar, 50 μm. (G) BCL2 expression in indicated lymphocyte subpopulations from WT and KO mice immunized with SRBCs assessed by immunoblotting. Quantitative differences in protein expression level based on densitometric analysis were normalized to actin and are shown below the blots. Apostrophe indicates longer times of film exposure to exhibit relative differences in protein abundance. Unrelated bands were cut from the immunoblots (dotted line).
Furthermore, we investigated whether miR-15a/16-1 deletion results in upregulation of its validated oncogenic targets in GC B cells.44,45 Although BCL2 apoptosis regulator (BCL2) expression is suppressed in GC B cells in a BCL6-dependent mechanism46 and was undetectable using IHC (Figure 2F), we observed prominent upregulation of this antiapoptotic protein in fluorescence-activated cell sorted (FACS) GC B cells with miR-15a/16-1 deletion by immunoblotting (Figure 2G; supplemental Figure 2C), indicating a complementary miR-15a/16–mediated mechanism responsible for BCL2 suppression during the GC reaction. We also observed a modest upregulation of cyclin D2 and checkpoint kinase 1 (CHEK1), and a minor increase of cyclin E1 expression (supplemental Figure 2C). Although vascular endothelial growth factor A (VEGF-A) abundance was higher within the light zone (LZ) of GCs from KO compared with WT mice as assessed by IHC (supplemental Figure 2D), it was most likely a secondary change related to other LZ constituents such as follicular dendritic cells or T-follicular helper cells,15 given low Vegfa mRNA expression in GC B cells as well as no significant difference in Vegfa mRNA expression between LZ and dark zone (DZ) GC B cells.37,38 Moreover, no significant difference in VEGF-A concentration between plasma samples from WT and KO mice was detected using enzyme-linked immunosorbent assay (ELISA) (supplemental Figure 2E). Overall, these results demonstrate that KO mice are a representative model for studying the biological consequences of miR-15a/16-1 deletion during and after B-cell activation.
Loss of the miR-15a/16-1 cluster induces moderate but widespread molecular, functional, and developmental changes in activated B cells
Given the miR characteristics1,47,48 that make their studies challenging, we performed proteomic analysis of sorted GC B cells in immunized WT and KO mice (n = 5 per group) (Figure 3A) to uncover the functional consequences of miR-15a/16-1 deletion in activated B cells. Although GC B cells comprise a fraction of all B cells, which limits the amount of protein available for analysis, we quantified expression of 3880 proteins (false discovery rate [FDR] < 0.01). In line with previous reports,4 we observed broad but relatively mild changes in protein expression between GC B cells from WT vs KO mice, with 710 differentially expressed proteins (330 upregulated and 380 downregulated, FDR < 0.1) (Figure 3B; supplemental Figure 3A-B; supplemental Table 3). The miR-15a/16 seed sequence, AGCAGCA, was the most significantly enriched seed in mRNAs encoding proteins overexpressed in KO compared with WT cells, confirming the on-target activity of the model (Figure 3C). The large fraction of differentially expressed proteins that are not conventional miR-15a/16 targets may represent secondary changes, targets regulated through binding to mRNA regions other than the 3′ untranslated region, and/or noncanonical “seedless” targets.49 Functional enrichment analysis of the differentially expressed proteins revealed changes in cell cycle and BCR signaling, protein stabilization and synthesis, and nucleotide and RNA metabolism among others (Figure 3D). Gene-set enrichment analysis (GSEA) of the MSigDB “Hallmark” database showed enrichment in proteins involved in interferon, interleukin 2 (IL2)/STAT5, and KRAS signaling, apoptosis, and hypoxia in KO cells and oxidative phosphorylation in WT cells (Figure 3E; supplemental Figure 3C). Because BCR, interferon, IL2/STAT5, and KRAS signaling activates downstream extracellular signal-regulated kinase (ERK),50-53 we assessed its phosphorylation in GC B cells and found higher levels in KO compared with WT mice (Figure 4A), corroborating the in silico analyses.

Proteomic changes induced by loss of the miR-15a/16-1 cluster in GC B cells. (A) Schematic design of the proteomic analysis. GC B cells were flow sorted from WT (n = 5) and KO (n = 5) mice 10 days after immunized with SRBCs. Extracted proteins were trypsinized and subjected to tandem mass tag–based liquid chromatography coupled with tandem MS, followed by in silico analyses. (B) Differentially expressed proteins between WT and KO mice at FDR < 0.1. Proteins upregulated in KO compared with WT mice are indicated in red; downregulated in blue. (C) miR target enrichment in proteins upregulated in GC B cells from KO compared with WT mice determined using MIENTURNET. Color scale represents FDR value. For simplicity, miR family names were abbreviated. (D) Network of enriched pathways and processes in proteins differentially expressed between GC B cells from KO and WT mice using Metascape. Each node represents an enriched term and is colored by functional category. (E) GSEA of "Hallmark" gene sets in proteomes of GC B cells from KO compared with WT mice. Bubble size represents enrichment signal strength calculated as the GSEA leading edge signal. Gene sets enriched in KO and WT cells are shown in red and blue, respectively. EMT, epithelial-mesenchymal transition; IFN, interferon; logFC, log fold change; ncRNA, noncoding RNA; NES, normalized enrichment score; OxPhos, oxidative phosphorylation; tRNA, transfer RNA.
Proteomic changes induced by loss of the miR-15a/16-1 cluster in GC B cells. (A) Schematic design of the proteomic analysis. GC B cells were flow sorted from WT (n = 5) and KO (n = 5) mice 10 days after immunized with SRBCs. Extracted proteins were trypsinized and subjected to tandem mass tag–based liquid chromatography coupled with tandem MS, followed by in silico analyses. (B) Differentially expressed proteins between WT and KO mice at FDR < 0.1. Proteins upregulated in KO compared with WT mice are indicated in red; downregulated in blue. (C) miR target enrichment in proteins upregulated in GC B cells from KO compared with WT mice determined using MIENTURNET. Color scale represents FDR value. For simplicity, miR family names were abbreviated. (D) Network of enriched pathways and processes in proteins differentially expressed between GC B cells from KO and WT mice using Metascape. Each node represents an enriched term and is colored by functional category. (E) GSEA of "Hallmark" gene sets in proteomes of GC B cells from KO compared with WT mice. Bubble size represents enrichment signal strength calculated as the GSEA leading edge signal. Gene sets enriched in KO and WT cells are shown in red and blue, respectively. EMT, epithelial-mesenchymal transition; IFN, interferon; logFC, log fold change; ncRNA, noncoding RNA; NES, normalized enrichment score; OxPhos, oxidative phosphorylation; tRNA, transfer RNA.
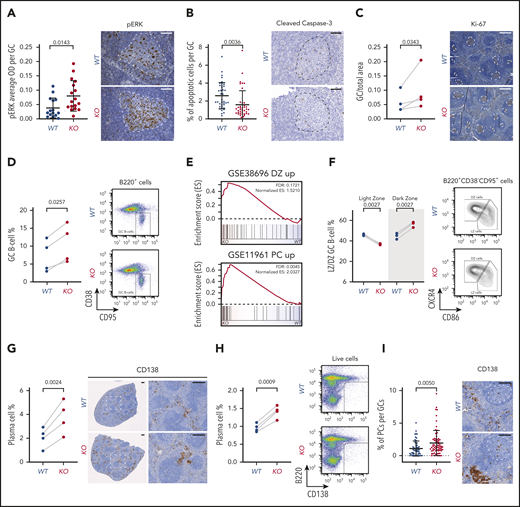
Functional and developmental alterations caused by miR-15a/16-1 KO in mature B cells. (A) pERK cell staining intensity per GC in spleens of WT (n = 15) and KO (n = 17) mice immunized with SRBCs identified by IHC. Graphs depict the mean plus or minus standard deviation (SD) (left). Measurements were made with HALO image analysis software. P value was calculated using the unpaired Student t test. Representative pictures are shown on the right (IHC, brown; counterstain, blue); GCs are highlighted by dotted lines. Scale bar, 50 µm. (B) Percentage of apoptotic cells per GC in spleens of WT (n = 41) and KO (n = 40) mice immunized with SRBC identified by cleaved caspase-3 IHC. Graphs depict the mean plus or minus SD (left). Measurements were made with inForm cell analysis software. P value was calculated using the unpaired Student t test. Representative pictures are shown on the right (IHC, brown; counterstain, blue); GCs are highlighted by dotted lines. Scale bar, 50 µm. (C) Area of GCs in spleens of WT (n = 4) and KO (n = 4) mice immunized with SRBCs identified by Ki-67 IHC. Graphs depict areas in paired littermate samples analyzed in parallel (left). Measurements were made with HALO Image Analysis software. P value was calculated using the ratio paired Student t test. Representative pictures are shown on the right (IHC, brown; counterstain, blue); GCs are highlighted by dotted lines. Scale bar, 300 µm. (D) Percentage of GC B cells in spleens of WT (n = 4) and KO (n = 4) mice immunized with SRBCs determined using flow cytometry. Graphs depict percentages in paired littermate samples analyzed in parallel (left). P value was calculated using the ratio paired Student t test. Representative dot plots are shown on the right. (E) GSEA analysis of signatures upregulated in DZ compared with LZ GC B cells from GSE38696 (top) and PCs compared with GC B cells from GSE11961 (bottom) in proteomes of GC B cells from KO vs WT mice. (F) Percentage of LZ and DZ GC B cells in spleens of WT (n = 3) and KO (n = 3) mice immunized with SRBCs determined using flow cytometry. Graphs depict percentages in paired littermate samples analyzed in parallel (left). P values were calculated using the ratio paired Student t test. Representative density plots are shown on the right. (G) Percentage of PCs in spleens of WT (n = 4) and KO (n = 4) mice immunized with SRBCs identified by CD138 IHC. Graphs depict percentages in paired littermate samples analyzed in parallel (left). Measurements were made with HALO image analysis software. P value was calculated using the ratio paired Student t test. Representative pictures are shown on the right (IHC, brown; counterstain, blue). Scale bar, 250 µm. (H) Percentage of PCs in spleens of WT (n = 4) and KO (n = 4) mice immunized with SRBC determined using flow cytometry. Graphs depict percentages in paired littermate samples analyzed in parallel (left). P value was calculated using the ratio paired Student t test. Representative dot plots are shown on the right. (I) Percentage of PCs per GC in spleens of WT (n = 4) and KO (n = 4) mice immunized with SRBCs identified by CD138 IHC. Graphs depict the mean plus or minus SD (left). Measurements were made with HALO image analysis software. P value was calculated using the unpaired Student t test Representative pictures are shown on the right (IHC, brown; counterstain, blue); GCs are highlighted by dotted lines. Scale bar, 100 µm. ES, enrichment score; OD, optical density; pERK, phosphorylated ERK.
Functional and developmental alterations caused by miR-15a/16-1 KO in mature B cells. (A) pERK cell staining intensity per GC in spleens of WT (n = 15) and KO (n = 17) mice immunized with SRBCs identified by IHC. Graphs depict the mean plus or minus standard deviation (SD) (left). Measurements were made with HALO image analysis software. P value was calculated using the unpaired Student t test. Representative pictures are shown on the right (IHC, brown; counterstain, blue); GCs are highlighted by dotted lines. Scale bar, 50 µm. (B) Percentage of apoptotic cells per GC in spleens of WT (n = 41) and KO (n = 40) mice immunized with SRBC identified by cleaved caspase-3 IHC. Graphs depict the mean plus or minus SD (left). Measurements were made with inForm cell analysis software. P value was calculated using the unpaired Student t test. Representative pictures are shown on the right (IHC, brown; counterstain, blue); GCs are highlighted by dotted lines. Scale bar, 50 µm. (C) Area of GCs in spleens of WT (n = 4) and KO (n = 4) mice immunized with SRBCs identified by Ki-67 IHC. Graphs depict areas in paired littermate samples analyzed in parallel (left). Measurements were made with HALO Image Analysis software. P value was calculated using the ratio paired Student t test. Representative pictures are shown on the right (IHC, brown; counterstain, blue); GCs are highlighted by dotted lines. Scale bar, 300 µm. (D) Percentage of GC B cells in spleens of WT (n = 4) and KO (n = 4) mice immunized with SRBCs determined using flow cytometry. Graphs depict percentages in paired littermate samples analyzed in parallel (left). P value was calculated using the ratio paired Student t test. Representative dot plots are shown on the right. (E) GSEA analysis of signatures upregulated in DZ compared with LZ GC B cells from GSE38696 (top) and PCs compared with GC B cells from GSE11961 (bottom) in proteomes of GC B cells from KO vs WT mice. (F) Percentage of LZ and DZ GC B cells in spleens of WT (n = 3) and KO (n = 3) mice immunized with SRBCs determined using flow cytometry. Graphs depict percentages in paired littermate samples analyzed in parallel (left). P values were calculated using the ratio paired Student t test. Representative density plots are shown on the right. (G) Percentage of PCs in spleens of WT (n = 4) and KO (n = 4) mice immunized with SRBCs identified by CD138 IHC. Graphs depict percentages in paired littermate samples analyzed in parallel (left). Measurements were made with HALO image analysis software. P value was calculated using the ratio paired Student t test. Representative pictures are shown on the right (IHC, brown; counterstain, blue). Scale bar, 250 µm. (H) Percentage of PCs in spleens of WT (n = 4) and KO (n = 4) mice immunized with SRBC determined using flow cytometry. Graphs depict percentages in paired littermate samples analyzed in parallel (left). P value was calculated using the ratio paired Student t test. Representative dot plots are shown on the right. (I) Percentage of PCs per GC in spleens of WT (n = 4) and KO (n = 4) mice immunized with SRBCs identified by CD138 IHC. Graphs depict the mean plus or minus SD (left). Measurements were made with HALO image analysis software. P value was calculated using the unpaired Student t test Representative pictures are shown on the right (IHC, brown; counterstain, blue); GCs are highlighted by dotted lines. Scale bar, 100 µm. ES, enrichment score; OD, optical density; pERK, phosphorylated ERK.
We next investigated whether molecular alterations in these proproliferative and prosurvival pathways and proteins induce changes at the cellular level. In agreement with the BCL2 upregulation, a decrease was noted in the percentage of apoptotic cells within splenic GCs of immunized KO mice (Figure 4B). We consistently observed increased area and percentage of GC B cells in the spleens of littermate immunized KO vs WT mice (Figure 4C-D).
Many of the observed molecular alterations are implicated in the regulation of internal GC B-cell polarization and differentiation into PCs.54-63 Therefore, we further investigated the abnormalities in the GC reaction induced by the miR-15a/16-1 cluster deletion and noted enrichment of the DZ GC B-cell signature38 in KO compared with WT cells (Figure 4E). Consistently, a significant increase in the percentage of DZ GC B cells coupled with a decrease in the percentage of LZ GC B cells was detected by flow cytometry (Figure 4F). We also observed significant enrichment of the signature upregulated in PCs when compared with GC B cells37 in GC B cells from KO vs WT mice (Figure 4E). To validate the abnormal rate of PC commitment and differentiation, we quantified PCs in the spleens of KO and WT mice using IHC and flow cytometry and found higher percentages of PCs in KO mice (Figure 4G-H). Moreover, we detected more CD138+ cells within the GCs of KO mice, suggesting an increase in differentiation with subsequent accumulation in the interfollicular areas (Figure 4G,I). Of note, no significant changes in the percentages of Fo and MZ B cells as well as T cells in young KO and WT mice were observed (supplemental Figure 4A).
Mice with loss of the miR-15a/16-1 cluster during B-cell activation develop PC neoplasms and B-cell lymphomas of GC origin
Given the molecular and cellular alterations induced by miR-15a/16-1 deletion, we evaluated cohorts of KO and WT mice over a 2-year aging period. No evidence for monoclonal gammopathy was observed in young mice (supplemental Figure 4B). After 54 weeks and at variable times thereafter, 16 of 36 KO but not WT mice developed progressive disease with enlarged cervical LNs and had to be euthanized (Figure 5A). Gross pathologic examination of euthanized KO mice revealed enlarged spleens and LNs (Figure 5B-C), particularly in the neck and mesenteric areas. These internal changes were also present in 5 of 16 KO mice that were not moribund at 2 years.

Development of PC neoplasm and lymphoma phenotype in aged KO mice. (A) Kaplan-Meier plots illustrating lymphoma-free survival for aging cohorts of WT (n = 35) and KO (n = 36) mice. P value was calculated by using the log-rank test. (B) Representative images of spleens (Sp), LNs, and liver from an age-matched WT healthy control mouse and 1 each with the indicated lymphoma phenotype from KO mice. Note enlarged spleen and LNs, and tumor nodules in the liver (white arrowheads) of KO mice. (C) Comparison of spleen/body weight ratios between age-matched WT healthy controls (blue) and KO (red) mice with the indicated lymphoma phenotypes. P values were calculated by using the unpaired Student t test. (D) Clonality evaluated by Southern blot analysis of the IgH gene in DNA isolated from LNs, spleen (Sp), main tumor mass (T), or liver (Li) from KO mice with the indicated phenotypes. The nonrearranged germ line (GL) band (dashed gray line) and 1 to 3 clonally rearranged bands per mouse were identified (arrowheads). (E) Histologic and IHC stains of indicated markers on serial consecutive LN sections from representative KO mice with the indicated lymphoma phenotype. Hematoxylin-and-eosin (H&E) stain. Scale bars: yellow, 100 µm; white, 20 µm. (F) Number of SNVs and indels in the PC neoplasm and DLBCL from KO mice determined using WES. Colors represent mutation types. (G) Location of mutations in exemplary affected proteins in mouse DLBCL and PC neoplasm as well as human non-Hodgkin lymphomas (NHL). Colors represent mutation types as in panel F.
Development of PC neoplasm and lymphoma phenotype in aged KO mice. (A) Kaplan-Meier plots illustrating lymphoma-free survival for aging cohorts of WT (n = 35) and KO (n = 36) mice. P value was calculated by using the log-rank test. (B) Representative images of spleens (Sp), LNs, and liver from an age-matched WT healthy control mouse and 1 each with the indicated lymphoma phenotype from KO mice. Note enlarged spleen and LNs, and tumor nodules in the liver (white arrowheads) of KO mice. (C) Comparison of spleen/body weight ratios between age-matched WT healthy controls (blue) and KO (red) mice with the indicated lymphoma phenotypes. P values were calculated by using the unpaired Student t test. (D) Clonality evaluated by Southern blot analysis of the IgH gene in DNA isolated from LNs, spleen (Sp), main tumor mass (T), or liver (Li) from KO mice with the indicated phenotypes. The nonrearranged germ line (GL) band (dashed gray line) and 1 to 3 clonally rearranged bands per mouse were identified (arrowheads). (E) Histologic and IHC stains of indicated markers on serial consecutive LN sections from representative KO mice with the indicated lymphoma phenotype. Hematoxylin-and-eosin (H&E) stain. Scale bars: yellow, 100 µm; white, 20 µm. (F) Number of SNVs and indels in the PC neoplasm and DLBCL from KO mice determined using WES. Colors represent mutation types. (G) Location of mutations in exemplary affected proteins in mouse DLBCL and PC neoplasm as well as human non-Hodgkin lymphomas (NHL). Colors represent mutation types as in panel F.
Detailed histological and IHC analysis of enlarged spleens and LNs from KO mice revealed different types of clonal, GC-derived lymphoid malignancies (Figure 5D; supplemental Figure 5A; supplemental Table 4). The first type (38%), presented as a low-grade lymphoid infiltrate of atypical B220+BCL2−CD138− cells with cleaved nuclei within the CD21+ follicular dendritic structure (Figure 5E), resembling human FL.64 The second type (29%) revealed high-grade diffuse proliferation of GC-derived B220+BCL2+CD138− large cells disrupting the follicular dendritic meshwork and resembling human DLBCL (Figure 5E).64 In the third group (33%), the interfollicular areas of spleens and LNs were expanded by large aggregates and sheets of indolent (small size, lack of nucleoli, binucleation, and low mitotic activity) CD138+B220−BCL2+/− clonal PCs (Figure 5E). These PC tumors had mutated variable gene segments (supplemental Table 4), excluding the diagnosis of nodal MZ lymphoma and suggesting a PC neoplasm because mouse MZ B cells do not undergo somatic hypermutation.8
We next investigated immunophenotypic differences between KO and previously published models.28,29 We detected increased populations of B220/PAX5+CD5+BCL6−CD3− CLL cells at the edge of the T-cell areas in CD19Cre/+;miR-15a/16-1fl/fl mice (supplemental Figure 5B-C), which were absent in the premalignant and FL KO mice. The latter were characterized by a monotonous population of B220/PAX5+CD5−BCL6+CD3− B cells (supplemental Figure 5B). Contrary to Vκ-MYC MM cells that all express MYC protein,65 moderate, low, or almost no MYC expression was observed in the KO FL, DLBCL, and PC tumors, respectively (supplemental Figure 5D). These studies demonstrate that deletion of miR-15a/16-1 at different stages of B-cell development and with different cooperative alterations promotes distinct subtypes of mature B-cell lymphomas.
The relatively long latency of lymphoma development in KO mice suggested that loss of the miR-15a/16-1 might require secondary cooperating genetic mutations to induce lymphomagenesis. Indeed, WES analysis revealed 146 single-nucleotide variants (SNVs) and indels in a murine PC tumor. Consistent with the high mutation burden in human DLBCL, 589 SNVs and indels were also identified in murine DLBCL (Figure 5F; supplemental Figure 6). Somatic variants involved genes that are frequently mutated in human mature B-cell malignancies, including histones (PC neoplasm and DLBCL), Gna13, Nfkbia, Bcl6, Bcl7a, Klhl6, and Pim1 (DLBCL) (Figure 5G). We next investigated whether some of these genes (Gna13, Hist1h1c, Hist1h1e, and Pim1) were mutated in GC B cells from young KO mice (n = 3) or spleens from KO mice that did not develop neoplasms (n = 3). We detected mutations in Gna13 (1 GC B-cell and 1 spleen sample) and Pim1 (3 spleen samples), but not Hist1h1c and Hist1h1e; however, these variants were present in very low fractions, suggesting low clonal involvement (supplemental Table 5). Taken together, these findings indicate that the deletion of miR-15a/16-1 cluster alters the GC reaction, which with time predispose to expansion and malignant transformation of clones harboring secondary mutations at different stages of development after antigenic activation.
Decreased miR-15a/16 expression in human EPs is associated with MM-related genetic alterations
To better specify the diagnosis of the PC neoplasm in KO mice, we performed detailed examination and found excessive expression of IgG relative to IgM heavy chain, and of κ over Λ light chains or vice versa in LNs (Figure 6A). Because scattered interstitial PC infiltrate was detected in the BM of KO mice with PC neoplasms (Figure 6B), we next evaluated associated bone radiographs. However, no lytic lesions (round, well-circumscribed, small radiolucent lesions)66 or fractures were observed (Figure 6B-C). An M spike was detected in 1 of 5 specimens analyzed by serum protein electrophoresis (Figure 6D). Moreover, no major increase in total IgM and IgG levels in plasma samples was detected by ELISA (Figure 6E). Altogether, these findings are consistent with the diagnosis of EP, an MM-related neoplasm that grows outside BM.64 We next investigated whether miR-15a/16 may be implicated in the pathogenesis of human EPs by interrogating human EP tissue array and found that 10 of 11 cases had decreased or almost undetectable miR-15a/16 expression when compared with healthy nodal PCs (Figure 6F-G).
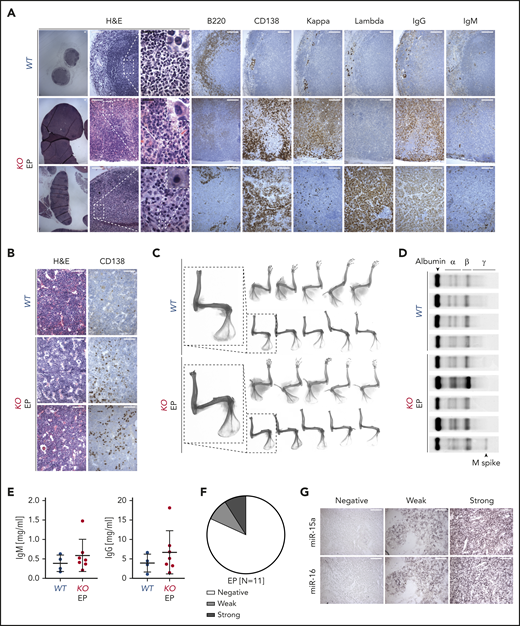
Characterization of PC neoplasm in KO mice. (A-B) Histologic and IHC stains of indicated markers on serial LN (A) and BM (B) sections from age-matched WT control and 2 representative KO mice with EP. Scale bars: white, 100 µm; black, 20 µm. (C) Bone radiographs of limbs with muscles still attached (top) or after removal (bottom) of WT and KO mice with PC neoplasm. One representative bone radiograph from each group is magnified to facilitate the interpretation. Note absence of bone lytic lesions in all EP cases. (D) Serum protein electrophoresis of WT and KO mice with PC neoplasm. Note presence of M spike in 1 of the EP cases. (E) Plasma IgM and IgG concentrations assessed using ELISA in WT and KO mice with PC neoplasm. Graphs depict the mean plus or minus SD. (F-G) miR-15a and miR-16 expression (ISH) assessed on FFPE biopsy sections from patients with EP (n = 11). (F) The ISH signal was scored into 3 grades ranging from negative, to weak, to strong in comparison with healthy nodal PCs. (G) A representative example for each grade is shown. Scale bar, 50 µm.
Characterization of PC neoplasm in KO mice. (A-B) Histologic and IHC stains of indicated markers on serial LN (A) and BM (B) sections from age-matched WT control and 2 representative KO mice with EP. Scale bars: white, 100 µm; black, 20 µm. (C) Bone radiographs of limbs with muscles still attached (top) or after removal (bottom) of WT and KO mice with PC neoplasm. One representative bone radiograph from each group is magnified to facilitate the interpretation. Note absence of bone lytic lesions in all EP cases. (D) Serum protein electrophoresis of WT and KO mice with PC neoplasm. Note presence of M spike in 1 of the EP cases. (E) Plasma IgM and IgG concentrations assessed using ELISA in WT and KO mice with PC neoplasm. Graphs depict the mean plus or minus SD. (F-G) miR-15a and miR-16 expression (ISH) assessed on FFPE biopsy sections from patients with EP (n = 11). (F) The ISH signal was scored into 3 grades ranging from negative, to weak, to strong in comparison with healthy nodal PCs. (G) A representative example for each grade is shown. Scale bar, 50 µm.
Because loss of the miR-15a/16-1 cluster is associated with additional genetic alterations during murine EP development, we analyzed the genetic alterations in human primary EPs of a secondary cohort of FFPE samples by WES (n = 11; Figure 7A; supplemental Figure 7A-C) and compared them with MM to uncover potential pathogenetic determinants for different disease presentation. Cases were classified according to the International Myeloma Working Group (IMWG)67 criteria as solitary plasmacytoma with (n = 6) and without (n = 5) BM involvement. The most frequent somatic variant involved KRAS, followed by TRAF3, BRAF, NFKBIA, TET2, and TP53 (Figure 7B). Their location and impact closely mirrored mutations documented in MM (Figure 7C). Despite a small sample size for EP, TRAF3, NFKBIA, TET2, and TP53 mutations seemed more common in EP than in MM; however, the mutational profile of EP resembled MM. Of note, 2 of 3 cases with TRAF3 mutations had clonal del(14q) (supplemental Figure 7D), which points to a biallelic mechanism of inactivation also resembling MM.68 In contrast, copy number variation analysis revealed that all chromosomal arm-level gains were less frequent in EP than in MM, whereas losses in EP mirrored MM, with del(13q) being the most common deletion (Figure 7D-E). We did not detect any intragenic translocations using WES, but fluorescence ISH (FISH) data (available for 6 cases) revealed 4 translocations including t(11;14) in 2 cases, t(14;20), t(14;16), and an IGH gene rearrangement with noncommon partner (Figure 7F). Similar to previous ISH findings, miR-15a and miR-16 expression was higher in 3 and 2 of 11 cases, respectively (Figure 7G). Taken together, human EP is characterized by decreased expression of miR-15a/16, suggesting a pathogenic role recapitulated in our murine model. Moreover, the mutational profile of human primary EP resembles MM, except for the frequency of hyperdiploid cases and certain mutations.
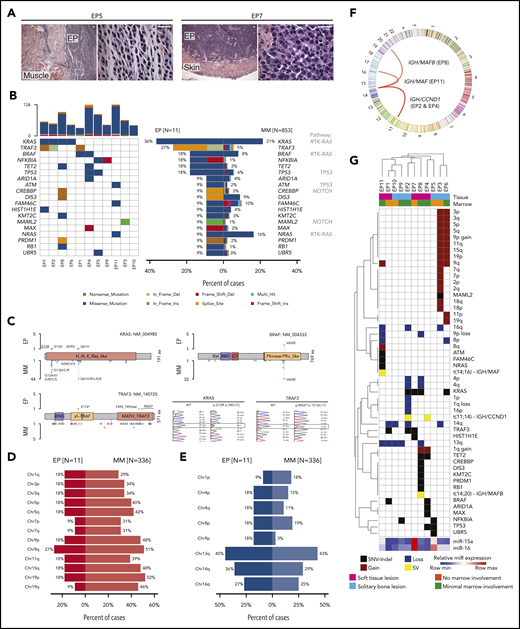
Mutational profiling of human primary EP. (A) Histologic H&E stains of 2 exemplary human primary EP included in the WES analysis. Note extramedullary localization of neoplastic PCs. Scale bar, 20 µm. (B) Oncoplot of mutations in 11 primary EP showing color-coded mutations in cancer candidate genes (right) and their frequency compared with MM (left). Number of nonsynonymous mutations for each sample is shown at the top. (C) Location of mutations in exemplary affected proteins in EP and MM. Colors represent mutation types as in panel B. Exemplary histograms from Sanger sequencing validating KRAS G12R and TRAF3 R505* mutations in EP8 and EP1, respectively, are shown. (D-E) Frequency of chromosomal arm-level gains (D) and losses (E) in EP in relation to MM. Note that del(13q) is the most common chromosomal alteration in EP and that frequency of chromosomal gains is lower in EP than in MM. (F) Circos plot of chromosomal rearrangements identified by fluorescence ISH. (G) Summary of genetic alterations identified in EP presented as color-coded matrix. Hierarchical clustering was done using 1 − the Pearson correlation. Expression of miR-15a and miR-16 determined using RT-qPCR relative to U6 is shown as heatmap at the bottom. SV, structural variation.
Mutational profiling of human primary EP. (A) Histologic H&E stains of 2 exemplary human primary EP included in the WES analysis. Note extramedullary localization of neoplastic PCs. Scale bar, 20 µm. (B) Oncoplot of mutations in 11 primary EP showing color-coded mutations in cancer candidate genes (right) and their frequency compared with MM (left). Number of nonsynonymous mutations for each sample is shown at the top. (C) Location of mutations in exemplary affected proteins in EP and MM. Colors represent mutation types as in panel B. Exemplary histograms from Sanger sequencing validating KRAS G12R and TRAF3 R505* mutations in EP8 and EP1, respectively, are shown. (D-E) Frequency of chromosomal arm-level gains (D) and losses (E) in EP in relation to MM. Note that del(13q) is the most common chromosomal alteration in EP and that frequency of chromosomal gains is lower in EP than in MM. (F) Circos plot of chromosomal rearrangements identified by fluorescence ISH. (G) Summary of genetic alterations identified in EP presented as color-coded matrix. Hierarchical clustering was done using 1 − the Pearson correlation. Expression of miR-15a and miR-16 determined using RT-qPCR relative to U6 is shown as heatmap at the bottom. SV, structural variation.
Discussion
Here, we have demonstrated that miR-15a/16-1 cluster deletion during B-cell activation induces widespread molecular and functional changes in GC B cells. With time, this leads to development of mature B-cell malignancies such as DLBCL, FL, and EP. Additionally, we corroborate the tumor-suppressing role of miR-15a/16 in primary human EP and identify similarities and differences in the genetic makeup between EP and MM.
miRs play crucial roles in the regulation of immune cell functions, including the GC reaction and postactivation maturation.69-74 Thus far, specific functions of only a few miRs in B-cell activation have been described, at least in part due to characteristics of miRs that encumber their study, especially in vivo.4,75 Because (i) apart from inducing mRNA degradation miRs inhibit translation,1 (ii) physiological miR alterations induce mild but widespread protein changes,4 and (iii) correlation between mRNA and protein expression is limited, especially for regulatory proteins,47,48 we used proteomic analysis, instead of conventional RNA sequencing, to investigate the role of miR-15a/16-1 in B-cell activation and lymphomagenesis. The broad but mild molecular changes induced by miR-15a/16-1 deletion are consistent with the “fine-tuning” model of miR action with a “key”/high fold change in expression of the validated BCL2 target.2,3 Our proteomic analyses indicate that miR-15a/16 modulates oxygen metabolism, apoptosis, and interferon, IL2, BCR, and KRAS signaling, which were all previously shown to be critical in the regulation of GC B-cell fate and function.54-63 Differentiation of GC B cells into PCs is a complex process involving LZ and DZ signaling. It begins among high-affinity LZ B cells, which subsequently transition into DZ, mature in the PC phenotype, and migrate out of the GC.76 Consequently, DZ cells display an enriched PC signature when compared with LZ cells.76,77 Therefore, an increase in the percentage of DZ cells in miR-15a/16-1–deficient murine GC B cells may be functionally related to elevated number of PCs. Overall, our studies indicate that the miR-15a/16-1 cluster regulates multiple aspects of the GC reaction, altogether ensuring elimination of faulty cells and governing excessive expansion.
Somatic mutations accumulate in B cells with age; however, their contribution to lymphomagenesis is not fully understood.78 Perturbing the strict control of B-cell activation and maturation by deletion of the miR-15a/16-1 cluster leads to expansion of mutated clones and development of mature B-cell neoplasms in KO mice. The relatively long latency of tumor development observed in mice with AIDCre-induced deletion of miR-15a/16-1 recapitulates the human setting because median time of diagnosis for FL, DLBCL, and PC neoplasms is the sixth, seventh, and sixth/seventh decade, respectively, and is related to a combination of factors, including time-dependent accumulation of mutations.64,79,80
Previously, CD19Cre-mediated deletion of miR-15a/16-1 was shown to promote development of CLL and, at lower frequency, non-Hodgkin lymphomas. CLL cells in this model expressed unmutated IgV genes, indicating non-GC origin.28 It has also been previously documented that constitutive monoallelic and biallelic deletion of the miR-15a/16-1 cluster accelerated onset of MM and secondary extramedullary dissemination in Vκ-MYC mice. However, germline loss of miR-15a/16-1 was not sufficient to induce malignant transformation: instead it only promoted increased levels of monoclonal immunoglobulin in the serum.29 Of note, IL-6 and v-ABL transgenic models that are both associated with Myc translocations develop aggressive extramedullary plasmacytomas resembling late-stage MM disease, in contrast to an indolent course of human primary EP reflected in our KO model.81-83 Although the precise molecular mechanisms accounting for multiple types of B-cell lymphomas induced by miR-15a/16-1 loss remains to be determined, such mechanisms would need to consider: (i) the type and temporal sequence of cooperating genetic alterations; (ii) the co-occurrence of specific predisposing processes within the targeted B cells (eg, high proliferation rate and tolerance for genotoxic stress of GC B cells)15 ; (iii) the cellular context, especially given the cell type/differentiation stage-specific miR functions resulting from relative differences in mRNA-miR expression ratios (eg, BCL2 and VEGF-A), coexpression of other miRs competing for binding sites, and alternative splicing84 ; and (IV) feedback mechanisms compensating for loss/activation of specific genes.85-88 The variety of murine hematologic malignancies induced by loss of the miR-15a/16-1 cluster underscores the importance of its tumor-suppression roles in B cells. This notion is supported by the exceptionally high prevalence of del(13q)44,64 and downregulation of miR-15a/16 in cells without del(13q)27,89 in human lymphoid malignancies.
del(13q) is an early event in the pathogenesis of MM, also observed in the precursor disease monoclonal gammopathy of undetermined significance.25,26 MM is a neoplasm characterized by proliferation of long-lived PCs within the BM, and associated bone lytic lesions.24,64 Although loss of BM homing and growth of MM cells at extramedullary sites is generally related to MM progression and advanced stage, there are rare cases in which clonal PCs initially and primarily develop in LNs and other soft tissues as primary “extramedullary plasmacytomas,” which can secondarily home to the BM.64,67 Notably, the latter phenotype is observed in KO mice, suggesting that other genetic alterations apart from miR-15a/16-1 deletion are involved in BM homing of MM cells.
Given the low number of cases, genetic bases of primary EPs were unclear. In our correlative studies, we found that, like MM, primary EPs have low levels of miR-15a/16 expression, with del(13q) being the most common deletion. Although the somatic mutational profile is also similar, there are some exceptions, such as the higher frequency of TRAF3 and NFKBIA (both regulating the NF-κB pathway) mutations in EP.90,91 In addition, although the frequencies of chromosomal losses were comparable in both PC neoplasms, only 18% of primary EP samples (2 of 11) were hyperdiploid compared with 40% to 50% in MM.26 Although a bigger sample size is necessary for significant comparisons and definitive conclusions, our studies indicate that MM and primary EP are slightly different molecular and clinicopathological entities and should be classified separately as proposed by World Health Organization (WHO) and IMWG guidelines.64,67 Because (i) comparison of MM cells from BM with extramedullary tumor PCs revealed a lower incidence of hyperdiploidy in the latter,25 (ii) del(13q) is a risk factor for extramedullary relapse in human and mouse MM,29,92-94 and (iii) miR-15a/16-1 was recently shown to be an essential MM-related tumor-suppressor gene located on chromosome 13q,29 the proextramedullary signaling related to del(13q)/miR-15a/16-1 downregulation combined with the lower frequency of pro-BM hyperdiploidy may induce the growth of malignant PCs primarily outside of the BM. In line with this, hyperdiploid MM is associated with MYC rearrangements and Vκ-MYC mice develop BM disease.29,95 Accordingly, the AIDCre/+;miR-15a/16-1fl/fl (KO) model could help in the study of the role of other MM-associated genetic alterations in BM homing of neoplastic PCs by generating new crosses.
Overall, our findings identify miR-15a/miR-16 as important regulators of the GC reaction and as tumor suppressors in mature B-cell malignancies including EP in vivo. Current therapies for MM and EP are different.96 Considering today’s rapidly advancing development of novel methods for in vivo miR delivery,97,98 these results point to miR-15a/miR-16 as promising agents for replacement therapy in EP as well as other hematologic malignancies associated with del(13q).64
Publication-related data are available at: Sequence Read Archive (SRA) (National Institutes of Health [NIH]) murine WES–PRJNA661046 human EP WES–PRJNA661244 PRIDE (European Molecular Biology Laboratory–European Bioinformatics Institute [EMBL-EBI]) murine proteomics–PXD021323 human MM data: https://pubmed.ncbi.nlm.nih.gov/32687451/; https://pubmed.ncbi.nlm.nih.gov/29884741/; and https://pubmed.ncbi.nlm.nih.gov/30914633/.
The online version of this article contains a data supplement.
The publication costs of this article were defrayed in part by page charge payment. Therefore, and solely to indicate this fact, this article is hereby marked “advertisement” in accordance with 18 USC section 1734.
Acknowledgments
The authors thank: Riccardo Dalla-Favera (Columbia University) for providing miR-15a/16-1fl mice, and Ulf Klein (Columbia University) for providing tissue sections from CD19Cre/+,miR-15a/16-1fl/fl mice as well as for insightful comments; Clyde Bongo of the DFCI Molecular Pathology Core Laboratory for help with imaging analyses; members of the DFCI Flow Cytometry Core for assistance with cell sorting; members of the DFCI Molecular Biology Core Facilities for assistance with amplicon sequencing; and members of the DFCI Center for Cancer Genome Discovery for assistance with WES.
J.-J.Z. was supported by a Multiple Myeloma Research Foundation (MMRF) Research Fellow Award. R.D.C. was supported by an MMRF Senior Award and National Institutes of Health National Cancer Institute research grant 1R01CA196783-01.
Authorship
Contribution: T.S. and R.D.C. designed the research; T.S., J.-J.Z., K.A., H.E.T., P.S.D., J.W., M.J., J.L., and Y.H. performed the research; V.S., O.N., V.P., D.B., M.B., D.M.D., G.S.P., D.F.R., I.M.G., P.J., N.C.M., and K.C.A. contributed vital new agents or analytical tools; T.S., J.R.S., M.K.S., J.-J.Z., B.B., K.C.A., and R.D.C. analyzed data; and T.S. and R.D.C. wrote the paper.
Conflict-of-interest disclosure: The authors declare no competing financial interests.
Correspondence: Tomasz Sewastianik, Dana-Farber Cancer Institute, 450 Brookline Ave, Boston, MA 02215; e-mail: tomasz_sewastianik@dfci.harvard.edu; and Ruben D. Carrasco, Dana-Farber Cancer Institute, 450 Brookline Ave, Boston, MA 02215; e-mail: ruben_carrasco@dfci.harvard.edu.

This feature is available to Subscribers Only
Sign In or Create an Account Close Modal