

Key Points
A specialized population of Tregs controls monocyte-mediated thrombolysis through the matricellular protein SPARC.
Clot Tregs can be therapeutically exploited to accelerate thrombus resolution.

Abstract
The cells and mechanisms involved in blood clot resorption are only partially known. We show that regulatory T cells (Tregs) accumulate in venous blood clots and regulate thrombolysis by controlling the recruitment, differentiation and matrix metalloproteinase (MMP) activity of monocytes. We describe a clot Treg population that forms the matricellular acid– and cysteine-rich protein SPARC (secreted protein acidic and rich in cysteine) and show that SPARC enhances monocyte MMP activity and that SPARC+ Tregs are crucial for blood clot resorption. By comparing different treatment times, we define a therapeutic window of Treg expansion that accelerates clot resorption.
Introduction
Blood clotting protects against blood loss and pathogen spread1 but causes pathological conditions in large vessels through clot embolization and blood flow obstruction.2 Deep vein thrombosis (DVT) is therefore a leading global cause of permanent disability and mortality. Besides direct thromboembolic damage, chronic insufficiencies such as the postthrombotic syndrome or chronic thromboembolic pulmonary hypertension are frequent consequences of DVT.3,4 The current treatment of acute DVT with anticoagulants, vasoactive drugs, and physical blood flow improvement limits thrombus expansion but cannot prevent recurrence and long-term complications.5 Chronic DVT complications are essentially caused by persistent inflammation that delays thrombus resolution. Monocytes play a major role in blood clotting and inflammation6 but are also significantly involved in the breakdown of thrombi through fibrinolytic and collagen remodeling activities.7 How these different monocyte activities are regulated in the course of blood coagulation is largely unclear.
We recently observed that effector-memory T cells delay thrombus resolution through antigen-independent interferon-γ (IFN-γ) production and mutual activation of myeloid cells.8 In the course of these investigations, we noticed that CD4+Foxp3+ regulatory T cells (Tregs) accumulate in venous thrombi undergoing degradation. Tregs suppress pathological immune responses,9 maintain tissue homeostasis,10-12 and potentiate tissue repair after damage.13-18 While immunoregulatory Treg activities in lymphoid tissues have been extensively studied, little is known about Treg activities in nonlymphoid tissues, and venous thrombosis has not been studied so far. Here, we describe a specialized population of Tregs that accumulates in thrombosed veins; show that it controls monocyte recruitment, differentiation, and matrix metalloproteinase (MMP) activity through the matricellular protein SPARC (secreted protein acidic and rich in cysteine); and demonstrate its importance in venous blood clot resolution.
Methods
Animals
C57BL/6, B6(Cg)-Rag1tm1.1Cgn/J (Rag1−/−), C57BL/6-Tg(Foxp3-DTR/EGFP)23.2Spar/Mmjax (DEREG), Klf2tm1Khog (KLF2GFP), B6;129S-Sparctm1Hwe/J (SPARC−/−) and C.129S4(B6)-Ifngtm3.1Lky/Il17atm1Bcgen/IL-22To/J (IFN-γ/IL-17A/IL-22 reporter) mice were bred in the central animal facility of the University Medical Center Mainz. All animal procedures were carried out in accordance with relevant laws (authorizations G15-1-096 and G19-1-069), current institutional guidelines, and the Helsinki convention for the use and care of animals.
DVT model
DVT was induced in 8- to 12-week-old mice with a minimum body weight of 25 g by ligation of the inferior vena cava (IVC) and all visible tributaries.8 Animals were placed in an anesthesia chamber and sedated by 2.5% isoflurane (flow rate, 0.8 L/min). Subsequently, mice were intraperitoneally (i.p.) injected with midazolam (5 mg/kg; Hameln Pharma, Hameln, Germany), Dorbene vet (1 mg/mL; Zoetis, Berlin, Germany), and fentanyl (0.05 mg/kg; Janssen-Cilag, Neuss, Germany). Surgery was started by making a midline incision (2 cm) through the abdominal wall. Upon median laparotomy, the IVC was exposed by atraumatic surgery, and a space holder (Asahi Fielder XT Guide Wire, 0.36 mm; Abbot Vascular, Abbot Park, IL) was positioned on the surface of the vessel. A permanent narrowing ligature 6-0 Prolene suture (Braun, Melsungen, Germany) was placed below the left renal vein and over the space holder. The space holder was subsequently removed to avoid complete vessel occlusion. The median incision was immediately closed by a 8.0 polypropylene suture (Braun). In religation experiments, a 8-0 Vicryl Rapide (Braun) suture was used in the first IVC ligation to allow resolution of the first ligature within the first 5 to 7 days. After surgery, mice were antagonized with a subcutaneous injection of flumazenil (0.1 mg/kg; Hikma, Gräfelfing, Germany), Alzane (5 mg/kg; Zoetis, Berlin, Germany), and Temgesic (0.3 mg/mL; RB Pharmaceuticals Limited, Slough, United Kingdom). To prevent infections, ligated mice received Borgal (1 mg/mL sulfadoxine and 0.2 mg/mL trimethoprim) in their drinking water. Thrombus sizes were monitored noninvasively by high-frequency ultrasound imaging (Vevo770 system) using a 40-MHz frequency mouse scan head. The animals were sedated by mask inhalation of 2.5% vaporized isoflurane (0.25 L/min O2) and kept anesthetized with 0.5% to 1.5% isoflurane (0.05-0.1 L/min O2) on a 37°C heating plate during observation. Upon optimal transverse and longitudinal positioning of the ultrasound head, a freeze-frame image was taken manually and the cross-sectional area of the clot traced using the Vevo 770 software. The length and width of clots were measured applying the B-mode.
Flow cytometry and flow-assisted cell sorting
Mouse IVCs were cut and lysed for 15 minutes at 37°C using a mixture of DNase I (50 µg/mL; Roche, Basel, Switzerland) and collagenase type II (1 mg/mL; Life Technologies, Carlsbad, CA). Cells were resuspended in a defined volume of staining buffer and incubated with unlabeled monoclonal antibody (mAb) against CD16/CD32 (eBioscience) to block nonspecific Fc receptor–mediated binding of staining antibodies used in the subsequent staining. Cells were then stained with fluorochrome-conjugated antibodies for 30 minutes at 4°C.
All IVC single-cell suspensions were stained for 30 minutes with allophycocyanin (APC)-eFluor-780– or BV/11-labeled anti-mouse CD45 and Fixable Viability Dye eFluor506. T cells were identified with phycoerythrin (PE)-Cy5–labeled anti-mouse T-cell receptor β (TCR-β) and eFluor 450–labeled anti-mouse CD4. Natural killer (NK) cells were gated out with PE-Cy7–labeled anti-mouse NK1.1. Further phenotyping was performed with PE-Cy7–labeled anti-mouse CD25 and PE-Cy7– or BV650-labeled anti-mouse CD69. Regulatory T cells were stained with PE-labeled anti-mouse FoxP3 (eBioscience), PerCP/Cy5.5–labeled anti-mouse Helios, and APC-labeled anti-mouse Ki-67 upon cell surface staining and fixation.
Monocytes were stained with APC-labeled anti-mouse CD11b, PE-labeled anti-mouse CD115, PerCP-Cy5.5–labeled anti-mouse Ly6C, BV650-labeled anti-mouse CD11c, Pacific Blue–labeled anti-mouse F4/80, fluorescein isothiocyanate–labeled anti-mouse CX3CR1, and APC-Cy7–labeled anti-mouse major histocompatibility complex (MHC) class II. T cells, B cells, NK cells, and polymorphonuclear leukocytes were excluded by staining with PE-Cy7–labeled anti-B220, anti-CD3, anti-NK1.1, and Ly6G antibodies (all from BioLegend, San Diego, CA).
To analyze MMP activity in individual immune cells in thrombus resolution, 100 μL (4 nmol) of phosphate-buffered saline–reconstituted MMP Sense 645 (PerkinElmer, Boston, MA) was injected IV 24 hours prior to flow cytometric analysis. All flow cytometry measurements were performed on a BD LSR II (Becton Dickinson, Heidelberg, Germany). Flow Jo Version 10 was used for data analysis.
Bulk RNA sequencing (RNA-seq) analysis
Full-length complementary DNA (cDNA) was prepared using 2 ng total RNA (RNA integrity number >8) isolated from sorted CD45+CD4+CD69+Foxp3+ cells using the Smart-Seq V4 Ultra low Input RNA kit (Takarabio) with 12 cycles of final amplification. Quality was assessed by Invitrogen’s Qubit HS assay, and the size of full-length cDNA was determined using Agilent’s 2100 Bioanalyzer HS DNA chip. Barcoded sequencing libraries were prepared using Illumina’s Nextera XT kit using 1ng cDNA. Barcoded sequencing libraries were onboard clustered using HiSeq Rapid SR Cluster Kit v2 using 8 pM and 59 basepairs and sequenced on the Illumina HiSeq2500 using HiSeq Rapid SBS Kit v2 (59 Cycle). Raw output HiSeq data were preprocessed according to the Illumina standard protocol. Sequence reads were trimmed for adapter sequences and further processed using the software CLC Genomics Workbench (v7.5.1 with CLC’s default settings for RNA-seq analysis). Reads were aligned to the GRCm38 genome.
Enzyme-linked immunosorbent assay
To determine SPARC formation by clot Tregs, CD4+CD25+Foxp3GFP Tregs were isolated from thrombotic veins of Foxp3-DTR/EGFP (DEREG) mice on day 14 by flow cytometric cell sorting. 5 × 10³ Tregs were stimulated for 24 hours with plate-bound anti-CD3 antibodies or recombinant cytokines (interleukin-18 [IL-18] or IL-33 [2 ng/mL each] or transforming growth factor β [TGF-β] [1 µg/mL]). Subsequently, SPARC was determined in culture supernatants by enzyme-linked immunosorbent assay (LifeSpan BioSciences, Seattle, WA).
Treg depletion, expansion, and adoptive transfer experiments
DEREG mice were depleted of Tregs by i.p. injection of 12.5 μg/kg diphtheria toxin (DT). Tregs were expanded by IL-2/JES6-1 complexes containing 5 μg JES6-1 and 1.5 μg recombinant mouse IL-2 per injection. CD4+CD25+ Tregs were isolated from spleen and lymph nodes using anti-CD25 microbeads (Miltenyi Biotec). Naive CD4+ T cells were isolated from spleen cells of IFN-γ/IL-17A/IL-22 reporter mice using the naive T-cell isolation kit II (Miltenyi Biotec).
To trigger autoimmunity in RAG−/− mice, mice received 5 × 10⁵ naive T cells with or without 2 × 10⁵ wild-type (WT) or SPARC−/− Tregs i.p.
Before DVT induction in RAG−/− mice, mice received 1 × 10⁶ Tregs/mouse IV. Transferred Treg were expanded with 5 consecutive IL-2/JES6-1 (both from eBioscience) complex injections. IVC ligation was performed 5 days after the last injection.
Statistical analyses
Quantitative data are presented as mean ± standard error of the mean (SEM). Differences between 2 groups were tested by Student t test for unpaired means (if normally distributed) or Mann-Whitney test (if not). Differences between multiple groups were compared using 1-way analysis of variance. Statistical significance was assumed if the P value was < .05. All analyses were performed using GraphPad PRISM data analysis software (version 7; GraphPad Software).
Results
Tregs accumulate in thrombotic veins and determine the rate of thrombus resolution
Thrombi induced by partial flow reduction in the IVC (Figure 1A) were subsequently colonized by Tregs (Figure 1B). Clot Tregs predominantly expressed the transcription factor Helios/IZKF219,20 and did not seem to proliferate (Ki67 staining), suggesting a thymic origin and recruitment from the periphery (supplemental Figure 1, available at the Blood Web site). Indicating local differentiation, Tregs in the clot and vein wall adopted an activated (CD69+)21 resident (KLF2−)22 phenotype (Figure 1C).
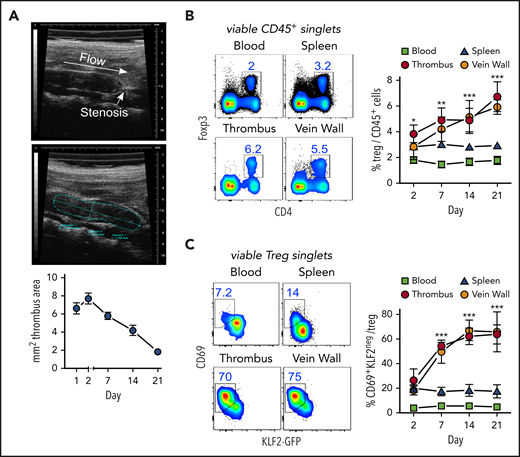
Activated, resident Tregs accumulate in venous blood clots. (A) Representative transversal ultrasound views of thrombi with ligature position marked and thrombus outlined for size determination; ultrasound data show the size progression of thrombi in C57BL/6 mice (n = 5 group/time point). (B) Treg frequencies in thrombi, adjacent venous walls, spleen, and blood during thrombus resolution. (C) Treg CD69- and KLF2-expression kinetics in KLF2GFP mice. Representative day 14 flow cytometric profiles; mean ± SEM values are shown (**P ≤ .005;***P ≤ .0005; ns, not significant; spleen/blood, n = 10; thrombus/vein, n = 5 group/time point). All statistical differences were tested using an unpaired Student t test (2 tailed). Profiles are representative of 3 independent experiments.
Activated, resident Tregs accumulate in venous blood clots. (A) Representative transversal ultrasound views of thrombi with ligature position marked and thrombus outlined for size determination; ultrasound data show the size progression of thrombi in C57BL/6 mice (n = 5 group/time point). (B) Treg frequencies in thrombi, adjacent venous walls, spleen, and blood during thrombus resolution. (C) Treg CD69- and KLF2-expression kinetics in KLF2GFP mice. Representative day 14 flow cytometric profiles; mean ± SEM values are shown (**P ≤ .005;***P ≤ .0005; ns, not significant; spleen/blood, n = 10; thrombus/vein, n = 5 group/time point). All statistical differences were tested using an unpaired Student t test (2 tailed). Profiles are representative of 3 independent experiments.
To examine their significance in thrombus resolution, we briefly removed or expanded all Tregs after clot degradation had begun. Punctual systemic Treg depletion by DT injection during clot degradation at days 8, 9, and 12 in DEREG mice23 significantly delayed thrombus resolution (Figure 2A; supplemental Figure 2A). Delayed thrombus resolution upon Treg depletion was accompanied by reduced urokinase-type plasminogen activator24 and increased PAI-1 messenger RNA expression (supplemental Figure 2B) and reduced intrathrombic collagen deposition (supplemental Figure 2C), signifying thrombolysis resistance. In addition, thrombi in Treg-depleted animals showed increased neovascularization (area of CD31+ cells), indicating prolonged inflammation.25 Next to their selective removal, we also investigated the influence of targeted Treg expansion on thrombus development using IL-2/anti-IL-2 complexes.26 Systemic Treg expansion at days 8 to 12 accelerated thrombus degradation (Figure 2A; supplemental Figure 2A), reflected by increased intrathrombic tissue plasminogen activator and urokinase-type plasminogen activator expression and reduced expression of PAI-1, confirming increased fibrinolysis (supplemental Figure 2B). It was further accompanied by decreased thrombus neovascularization at day 14 (supplemental Figure 2C). Together, the effects of altered Treg numbers demonstrated a crucial role of these cells for successful clot resorption.

Short-term, selective Treg depletion or expansion alters thrombus resolution and monocyte differentiation. (A) DT-mediated Treg depletion (days 8, 9, and 12; DT) in DEREG mice interrupts clot resolution, and Treg expansion with IL-2/JES 6-1 complexes (days 8-12; compl.) accelerates clot resolution (n = 5 group/time point). (B) Flow cytometric enumeration of monocyte frequencies (n = 5 group/time point). (C) Monocyte MHC class II and CD11c expression. Pie chart color code in the left upper vein wall fluorescence-activated cell sorting plot. (D) Monocyte Ly6C and MMP activity. Representative flow cytometric plots of CD45+LIN(CD3/B220/NK1.1/Ly6G)negCD11b+-gated monocytes (n = 3 group/time point). Mean results ± SEM (*P ≤ .05; **P ≤ .005; ***P ≤ .0005) are shown. All statistical differences were tested using an unpaired Student t test (2 tailed). Ultrasound data and profiles are representative of 3 independent experiments.
Short-term, selective Treg depletion or expansion alters thrombus resolution and monocyte differentiation. (A) DT-mediated Treg depletion (days 8, 9, and 12; DT) in DEREG mice interrupts clot resolution, and Treg expansion with IL-2/JES 6-1 complexes (days 8-12; compl.) accelerates clot resolution (n = 5 group/time point). (B) Flow cytometric enumeration of monocyte frequencies (n = 5 group/time point). (C) Monocyte MHC class II and CD11c expression. Pie chart color code in the left upper vein wall fluorescence-activated cell sorting plot. (D) Monocyte Ly6C and MMP activity. Representative flow cytometric plots of CD45+LIN(CD3/B220/NK1.1/Ly6G)negCD11b+-gated monocytes (n = 3 group/time point). Mean results ± SEM (*P ≤ .05; **P ≤ .005; ***P ≤ .0005) are shown. All statistical differences were tested using an unpaired Student t test (2 tailed). Ultrasound data and profiles are representative of 3 independent experiments.
Clot Tregs control monocyte numbers and differentiation in resolving thrombi
One of the most obvious changes triggered by altered Treg numbers was a simultaneous reduction or increase of clot monocyte numbers (Figure 2B). To better understand the influence of Tregs on monocytes, we further investigated their phenotype in thrombi and vein walls upon Treg removal or expansion. Whereas Treg expansion increased the frequency of CD11c or MHC class II–expressing monocytes, Treg depletion considerably attenuated monocyte differentiation (Figure 2C).
Clots are broken down by fibrinolytic enzymes and matrix-degrading proteases, such as MMPs, and monocytes are a major source.27 To trace monocyte MMP activity in vivo, we injected a MMP-activatable fluorescent probe prior to flow cytometric analysis. Expansion of Tregs increased the MMP+ monocyte frequency (Figure 2D). Complementing expression changes in fibrinolytic enzymes (supplemental Figure 2B), these data show that Tregs control monocyte differentiation and extracellular matrix (ECM) degradation in the thrombotic vein.
To reveal whether Tregs and monocytes interact directly with one another, we investigated the distribution of myeloid cells and Tregs in thrombi using intravital imaging. However, we found Tregs and myeloid cells in thrombi within defined, only partially overlapping areas (supplemental Figure 2D and supplemental Video 1), suggesting no sustained direct interaction.
Clot Tregs contain a distinct population of SPARC+ cells
To determine the clot Treg expression profile, we first compared bulk transcriptomes of clot and splenic Tregs. Since we had observed an upregulated CD69 expression in clot Tregs (Figure 1C), we sorted CD69+(Foxp3)-GFP+ Tregs from thrombi and venous walls and the phenotypically corresponding CD69+ splenic Treg population18 of thrombotic DEREG mice at day 14 after DVT induction. Confirming a Treg origin, all Treg preparations expressed canonical Treg signature genes (Figure 3A) including Foxp3 and FoxP3-dependent transcripts (Ikzf2, Ikzf4, Il2ra, Il2rb, Ctla4, Gpr83, Capg, Tnfrsf4, and Tnfrsf18).28 Traditional suppressive molecules displayed divergent expression profiles (Figure 3B). Whereas IL-10 was expressed higher in Tregs in thrombi and vein walls, GzmB and Tgfb1 remained unaltered. Supposedly reflecting cyclic adenosine monophosphate–dependent suppressive activity,29,30 we also found the cyclic adenosine monophosphate–responsive modulator CREM to be upregulated in Tregs in thrombi and vein walls. Reflective of a more activated state, clot Tregs further differed from splenic Tregs by a number of highly regulated transcripts (Fosl2, JunB, Gadd45b, Nr4a1, and Nr4a3) associated with TCR signaling (Nr4a1),31-34 inflammatory cytokine signaling (Gadd45b),35 and regulation of Treg effector programs (Fosl2, JunB, and Nr4a3)34,36 (Figure 3C). Clot Tregs finally differed from their splenic counterpart by increased expression of transcripts associated with repair Treg activity (GATA3 and Areg [amphiregulin]) and cytokine-mediated activation in inflamed tissues (Il1rl1 and Il18r1)18,37,38 (Figure 3D). Surprisingly, thrombus and vein wall Tregs expressed (SPARC or osteonectin) transcripts, a matricellular protein tuning cell turnover, tissue remodeling, and repair39 not described in Tregs before.
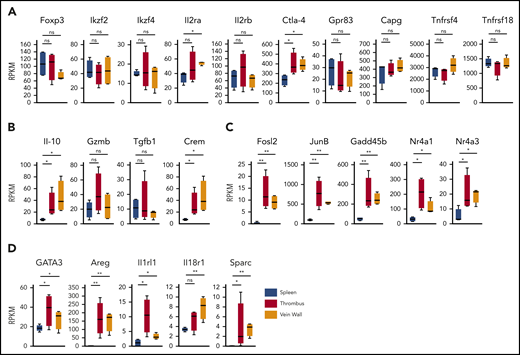
Clot Treg profile. CD69+(Foxp3)-GFP+ Tregs were sorted from day 14 thrombi, vein walls, and spleens (n = 4 independent preparations) of DEREG mice and subjected to RNA sequencing. Box-whisker plots of reads per kilobase million (RPKM) values are shown for canonical Treg signature genes (A), traditional suppressive molecules (B), Treg effector program and TCR/cytokine signaling genes (C), and tissue Treg genes (D). Mean values ± SEM (*P ≤ .05; **P ≤ .005) are shown. All statistical differences were tested using an unpaired Student t test (2 tailed).
Clot Treg profile. CD69+(Foxp3)-GFP+ Tregs were sorted from day 14 thrombi, vein walls, and spleens (n = 4 independent preparations) of DEREG mice and subjected to RNA sequencing. Box-whisker plots of reads per kilobase million (RPKM) values are shown for canonical Treg signature genes (A), traditional suppressive molecules (B), Treg effector program and TCR/cytokine signaling genes (C), and tissue Treg genes (D). Mean values ± SEM (*P ≤ .05; **P ≤ .005) are shown. All statistical differences were tested using an unpaired Student t test (2 tailed).
To determine the composition of the Treg population in venous thrombi, we isolated CD25-expressing cells on day 12 after DVT and performed a single-cell RNA-seq analysis. Similar to Tregs in nonlymphatic and lymphatic tissues,28,40,41 clot Tregs contained several transcriptionally different populations. In confirmation of the bulk messenger RNA data, clot cells contained nonoverlapping populations of Areg+ and SPARC+ Tregs (supplemental Figure 3). To check the formation of SPARC, we stimulated isolated clot Tregs in vitro with anti-CD3 antibodies or recombinant cytokines. Sorted clot Tregs produced SPARC in the presence of TGF-β, while IL-33 stimulation or stimulation via the TCR did not induce SPARC formation (Figure 4A).
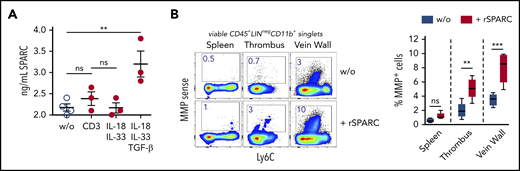
SPARC induces MMP activity in intrathrombic monocytes. (A) Sorted day 14 clot Tregs were stimulated with plate-bound anti-CD3 mAb or recombinant cytokines for 24 hours, and SPARC levels were determined in culture supernatant by ELISA. (B) Unseparated day 14 thrombi and vein samples were incubated for 24 hours in the presence of MMPSense with or without 50 ng/mL recombinant murine SPARC (rSPARC) protein. Representative flow cytometric plots of CD45+Lin−CD11b+ monocytes shown. Statistical differences were tested using an unpaired Student t test (2 tailed). Mean values ± SEM are shown (**P ≤ .005; ***P ≤ .0005; ns, not significant). Results are representative of 2 independent experiments. w/o, without.
SPARC induces MMP activity in intrathrombic monocytes. (A) Sorted day 14 clot Tregs were stimulated with plate-bound anti-CD3 mAb or recombinant cytokines for 24 hours, and SPARC levels were determined in culture supernatant by ELISA. (B) Unseparated day 14 thrombi and vein samples were incubated for 24 hours in the presence of MMPSense with or without 50 ng/mL recombinant murine SPARC (rSPARC) protein. Representative flow cytometric plots of CD45+Lin−CD11b+ monocytes shown. Statistical differences were tested using an unpaired Student t test (2 tailed). Mean values ± SEM are shown (**P ≤ .005; ***P ≤ .0005; ns, not significant). Results are representative of 2 independent experiments. w/o, without.
Treg-derived SPARC accelerates monocyte fibrinolysis and differentiation
The formation of SPARC by Tregs caught our attention, as this molecule regulates ECM proteins involved in fibrinolysis.39 Related to dysregulation of ECM structure and composition, SPARC-null mice display early-onset cataractogenesis, osteopenia, and increased dermal adipose tissue42 ; however, we observed no alterations in Treg phenotype and numbers (data not shown).
To clarify whether SPARC could play a role in clot monocyte MMP activity, we incubated unseparated thrombi and vein wall samples overnight with recombinant SPARC protein in the presence of the MMP probe. Recombinant SPARC significantly increased monocyte MMP activity in clots and vein walls, but not in spleen samples (Figure 4B), supporting the notion, that SPARC+ clot Tregs could drive monocyte-mediated fibrinolysis. Notably, monocyte MMP activity was enhanced by recombinant SPARC in unseparated tissue (with intact ECM), but not in single-cell cultures (data not shown).
To assess whether SPARC deficiency affects the ability of Tregs to maintain peripheral tolerance, we compared the ability of SPARC-sufficient or SPARC-deficient Tregs to suppress multiple autoimmune organ inflammation in the CD4+ T-cell transfer model.43 To this end, we cotransferred equal numbers of WT B6 Tregs or SPARC-knockout Tregs together with syngeneic naive CD4+ T cells from IFN-γ/IL-17A/IL-22 triple reporter mice into RAG−/− mice. Regardless of whether Tregs were SPARC competent or deficient, a similar degree of suppression of T-cell accumulation (supplemental Figure 4A) and cytokine formation was observed in different organs (supplemental Figure 4B). Consistent with the lack of SPARC expression in the splenic Treg population (Figure 3), SPARC apparently plays no part in Treg regulation of adaptive immune responses.
To unequivocally test the hypothesis that SPARC-producing Tregs are required in clot resolution in the most clearest experimental system, we transferred WT or SPARC-deficient Treg into RAG−/− recipients and expanded them with IL-2/JES 6-1 complexes26 to achieve physiological Treg numbers. Notably, SPARC-deficient Tregs did not differ in expansion from their WT counterpart (supplemental Figure 5). Compared with recipients of WT Tregs, thrombi resolved significantly slower in mice that had received SPARC-deficient Tregs (Figure 5A). Since after selective depletion or expansion of Tregs we mainly observed changes in the number and differentiation of monocytes, we looked again at these cells in the transfer experiments. Thrombi in mice that received SPARC-deficient Tregs contained fewer CD11b+ monocytes (Figure 5B), which also expressed a more inflammatory (high Ly6C expression; Figure 5C) and less differentiated (lower number of CD11c-expressing cells; Figure 5D) phenotype. This shows that SPARC-forming Tregs are necessary to guide myeloid differentiation appropriate for clot degradation.

Treg-specific SPARC deficiency delays clot resolution and intrathrombic monocyte differentiation. RAG−/− mice received 1 × 10⁶ splenic WT or SPARC−/− Tregs and 5 consecutive IL-2/JES 6-1 complex injections. IVC ligation was performed 5 days after the last injection and thrombus formation/resolution followed by ultrasound. (A) Ultrasound data of thrombus resolution. (B-D) Representative monocyte numbers and phenotypes in WT or SPARC−/− Treg recipients at day 21. Results are shown as mean ± SEM (n = 3/group; ***P ≤ .0005). Statistical differences were tested using an unpaired Student t test (2 tailed). Results are representative of 3 independent experiments.
Treg-specific SPARC deficiency delays clot resolution and intrathrombic monocyte differentiation. RAG−/− mice received 1 × 10⁶ splenic WT or SPARC−/− Tregs and 5 consecutive IL-2/JES 6-1 complex injections. IVC ligation was performed 5 days after the last injection and thrombus formation/resolution followed by ultrasound. (A) Ultrasound data of thrombus resolution. (B-D) Representative monocyte numbers and phenotypes in WT or SPARC−/− Treg recipients at day 21. Results are shown as mean ± SEM (n = 3/group; ***P ≤ .0005). Statistical differences were tested using an unpaired Student t test (2 tailed). Results are representative of 3 independent experiments.
Acceleration of thrombolysis with IL-2 complexes is only effective in the resolution phase
Since treatment with IL-2 complexes accelerated thrombus elimination, we investigated the time window of treatment and the possible effect on recurrent thrombosis with a view to therapeutic application in humans.
In contrast to its accelerating effect in the resolution phase, earlier IL-2 complex intervention during the inflammatory phase (days 2-5 after clot formation) delayed thrombus resolution (Figure 6A). This effect is probably due to the fact that not only Tregs but also nonregulatory Foxp3negCD25+ T cells present in the thrombus at that time (Figure 6B) were promoted by the IL-2 complexes. To test whether Treg-accelerated thrombolysis affects the development of a second thrombotic event, we induced a second DVT by religating the IVC after a first thrombus had completely resolved. However, Treg-accelerated thrombus resolution had no influence on the formation or resolution of a second thrombus (supplemental Figure 3). This shows that the effect of Tregs on thrombolysis remains local, disappears with the clot, and must therefore be re-established in each individual thrombotic event.
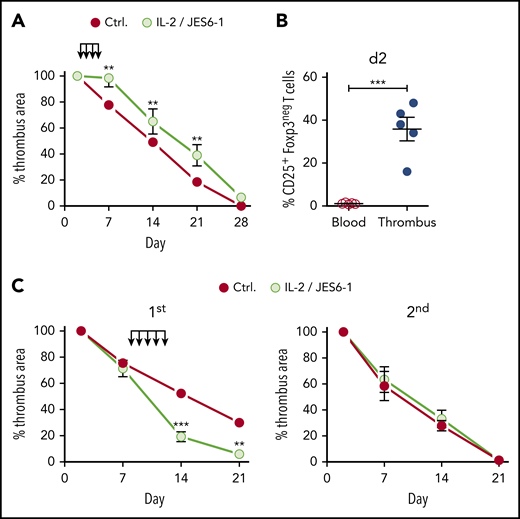
Therapeutic Treg expansion window. (A) Size development of thrombi in B6 mice injected with IL-2/JES 6-1 complexes at days 2 to 5 after IVC ligation. (B) Nonregulatory CD25+ T-cell frequencies in thrombi and blood at day 2, (n = 5 group). (C) Size development of thrombi in B6 mice injected with IL-2/JES 6-1 complexes at days 8 and 12 after primary IVC ligation and religated upon complete resolution of the primary thrombus. Mean results ± SEM are shown (n = 3; **P ≤ .005; ***P ≤ .0005). Statistical differences were tested using an unpaired Student t test (2 tailed).
Therapeutic Treg expansion window. (A) Size development of thrombi in B6 mice injected with IL-2/JES 6-1 complexes at days 2 to 5 after IVC ligation. (B) Nonregulatory CD25+ T-cell frequencies in thrombi and blood at day 2, (n = 5 group). (C) Size development of thrombi in B6 mice injected with IL-2/JES 6-1 complexes at days 8 and 12 after primary IVC ligation and religated upon complete resolution of the primary thrombus. Mean results ± SEM are shown (n = 3; **P ≤ .005; ***P ≤ .0005). Statistical differences were tested using an unpaired Student t test (2 tailed).
Discussion
We show that Tregs accumulate in venous thrombi, regulate thrombolysis, and can be therapeutically exploited to accelerate blood clot resolution. The majority of clot Tregs appear to colonize thrombotic tissue from the periphery and become locally activated. In the thrombotic tissue, Tregs promote thrombolysis by stimulating the recruitment of monocytes and their fibrinolytic activity, which is crucial for the breakdown of the fibrin fiber network.7 Similar to previously described nonlymphoid tissue Treg populations,28,40 clot Treg consist of several subpopulations. Besides a population of Tregs whose expression profile resembles repair Tregs in damaged tissues,44-46 we identified a small population of Tregs that form the ECM-regulating factor SPARC. We show that SPARC stimulates the MMP activity of monocytes and that clot Tregs produce SPARC in response to TGF-β. In particular, we show that the formation of SPARC by Tregs in the clot instigates a faster clot resolution. In accordance with our observations, a modulation of monocytes by Tregs was observed in visceral fat,13 myocardial infarction,14 and ischemic brain.18 Obviously, monocytes are important Treg interaction partners in both damaged tissue and clots. Tissue healing and clot degradation are similar in that fibinolytic actions are involved in both processes. It is, however, unknown whether tissue Treg populations described so far contain Tregs that form SPARC. Conversely, we have found Tregs in venous thrombi that express marker genes thought to characterize tissue Tregs but have not yet investigated their contribution to thrombus resolution.
SPARC belongs to a family of ECM-regulating proteins that regulate cell-ECM interactions such as signaling, adhesion, proliferation, migration, and survival.47 The ECM, in turn, plays a fundamental role in the regulation of inflammatory responses by codetermining both the attraction and differentiation as well as tissue retention of immune cells.42 In accordance with our observations, SPARC deficiency has been shown to reduce macrophage infiltration and proinflammatory cytokine expression in fibrotic tissues and myocardial infarction.48,49 In addition to the interactions of SPARC with ECM proteins, direct effects on cells have been described, although a cellular receptor for SPARC has not yet been identified. This includes the observation that SPARC stimulates MMP formation in human monocytes.50 Since MMPs not only degrade fibrin but also process chemokines and cytokines simultaneously,51 the MMP activity stimulated by SPARC could also increase cell invasion into the thrombus by building up chemokine gradients. Although SPARC can also be expressed by other cell types such as fibroblasts52 and monocytes,53 its formation by Tregs could affect conditions in thrombi, particularly early. In line, SPARC activity has proven to be particularly context and cell-type dependent.54
While the number of examples demonstrating transcriptional heterogeneity in Tregs is increasing, it is still unclear whether this corresponds to functional heterogeneity. Possibly, Treg diversity reflects the diversity of possible target cells in tissues and a spectrum of different regulatory requirements.
The properties of SPARC+ Tregs are not yet fully known. For example, we do not know how they are formed and whether their appearance in clots follows a similar development as recently described for repair Tregs.41 Similarly, we do not know whether SPARC+ Tregs exist in human blood clots. Further in-depth studies are therefore necessary to better characterize this population.
Treatment of DVT patients with anticoagulants stops clotting and facilitates endogenous fibrinolysis. Despite treatment, however, a residual vein occlusion persists in half of the patients after 3 to 6 months of anticoagulant therapy. Improving thrombus resolution is thus expected to prevent chronification. Although our observations in the mouse model cannot be transferred to the treatment of patients, they show very clearly that Treg expansion could accelerate clot resolution. To increase the number of Tregs in DVT patients, clinically approved low-dose IL-2 could be used,55 which does not trigger thromboembolic events56 but has not yet been tested in DVT patients. As an alternative to free IL-2, human IL-2/anti-IL-2 mAb complexes would offer higher Treg specificity, and a suitable antibody has been developed.57
Our experiments also suggest that IL-2 treatment should only be started after thrombus degradation has already begun. In order to avoid proliferation of inflammatory cells, IL-2 treatment could be combined with rapamycin to block its effect in inflammatory cells.58 Iliofemoral thrombosis has been identified as an independent factor for chronification.59 Although not studied in the DVT mouse model, we suspect that patients with iliofemoral thrombi may particularly benefit from Treg expansion to improve thrombus resolution.
The high-throughput bulk and single-cell RNA-seq data from this project have been deposited in the Gene Expression Omnibus database (accession numbers GSE144042 and GSE155444).
The online version of this article contains a data supplement.
The publication costs of this article were defrayed in part by page charge payment. Therefore, and solely to indicate this fact, this article is hereby marked “advertisement” in accordance with 18 USC section 1734.
Acknowledgments
The authors thank John Morser (Stanford) and Hans Christian Probst (Mainz) for critically reviewing the manuscript and suggesting improvements.
This work was supported by grants from the German Federal Ministry of Education and Research (Bundesministerium für Bildung und Forschung; grant 01EO1003) and the German Research Foundation (Deutsche Forschungsmeinschaft; grant BE 3685/4-1) to C.B.
Authorship
Contribution: F.S. performed most experiments, analyzed the data, generated figures, and wrote the manuscript; A.G. performed and supervised intravital microscopy studies; M.K. supervised RNA-seq; T.B. provided discussion and proofread the manuscript; K.S. supervised morphometric analyses and proofread the manuscript; F.F. analyzed single-cell RNA-seq data and generated figures; V.K.R. provided expertise, performed analyses of flow cytometric data, and contributed to data interpretation and discussions; and C.B. conceived the project, designed all experiments, analyzed the data, generated figures, and wrote the manuscript.
Conflict-of-interest disclosure: The authors declare no competing financial interests.
Correspondence: Christian Becker, Department of Dermatology, University Medical Center Mainz, Langenbeckstrasse 1, 55131 Mainz, Germany; e-mail: christian.becker@unimedizin-mainz.de.

This feature is available to Subscribers Only
Sign In or Create an Account Close Modal