

Key Points
Spatially resolved signatures of PD-1/PD-L1 signaling in the tumor microenvironment define T-cell/histiocyte-rich large B-cell lymphoma.
Three of 5 patients with relapsed/refractory TCRLBCL showed objective clinical responses to single-agent PD-1 blockade (pembrolizumab).

Abstract
T-cell/histiocyte-rich large B-cell lymphoma (TCRLBCL) is an aggressive variant of diffuse large B-cell lymphoma (DLBCL) characterized by rare malignant B cells within a robust but ineffective immune cell infiltrate. The mechanistic basis of immune escape in TCRLBCL is poorly defined and not targeted therapeutically. We performed a genetic and quantitative spatial analysis of the PD-1/PD-L1 pathway in a multi-institutional cohort of TCRLBCLs and found that malignant B cells harbored PD-L1/PD-L2 copy gain or amplification in 64% of cases, which was associated with increased PD-L1 expression (P = .0111). By directed and unsupervised spatial analyses of multiparametric cell phenotypic data within the tumor microenvironment, we found that TCRLBCL is characterized by tumor-immune “neighborhoods” in which malignant B cells are surrounded by exceptionally high numbers of PD-L1–expressing TAMs and PD-1+ T cells. Furthermore, unbiased clustering of spatially resolved immune signatures distinguished TCRLBCL from related subtypes of B-cell lymphoma, including classic Hodgkin lymphoma (cHL) and DLBCL-NOS. Finally, we observed clinical responses to PD-1 blockade in 3 of 5 patients with relapsed/refractory TCRLBCL who were enrolled in clinical trials for refractory hematologic malignancies (NCT03316573; NCT01953692), including 2 complete responses and 1 partial response. Taken together, these data implicate PD-1 signaling as an immune escape pathway in TCRLBCL and also support the potential utility of spatially resolved immune signatures to aid the diagnostic classification and immunotherapeutic prioritization of diverse tumor types.
Introduction
Diffuse large B-cell lymphoma (DLBCL) is an aggressive non-Hodgkin B-cell lymphoma with limited treatment options for relapsed/refractory disease.1,2 T-cell/histiocyte-rich large B-cell lymphoma (TCRLBCL) is a variant of DLBCL with distinct clinical features, including male predominance, earlier age of onset, and more frequent disseminated and extranodal disease at presentation.3-6 TCRLBCL also shows distinct histopathologic features, including malignant B cells within a robust, but ineffective, immune cell infiltrate characterized by numerous T cells and macrophages and by upregulation of immune response genes.6,7 The immune escape mechanisms in TCRLBCL are poorly understood and not targeted therapeutically. At present, patients with TCRLBCL are treated like those with DLBCL-NOS.8
Like the malignant B cells of TCRLBCL, Hodgkin Reed-Sternberg (HRS) cells of classic Hodgkin lymphoma (cHL) lie within a reactive inflammatory milieu.6 In prior studies, we and others identified multiple mechanisms by which HRS cells evade antitumor immunity.9,10 These include gains of chromosome 9p24.1, encompassing PD-L1/PD-L2/JAK2, and augmented JAK-STAT signaling, which drive expression of programmed cell death-1 ligands (PD-L1 and PD-L2) that bind PD-1 (CD279) on the surface of antigen-experienced T cells, leading to an “exhausted” T-cell phenotype.11-13 In addition, HRS cells lie within a unique microenvironmental niche enriched for PD-L1–positive tumor-associated macrophages (TAMs) that encircle HRS cells and provide an additional source of PD-L1 to engage PD-1/CD4–positive T cells.14,15
In phase 1 trials, patients with relapsed/refractory cHL treated with pembrolizumab and nivolumab achieved objective response rates (ORRs) of 65% and 87%, respectively, the highest ORRs observed for any patient population.16-18 In phase 2 trials, patients achieved similar ORRs and demonstrated durable responses, with a median duration of response of 16.6 months and a median progression-free survival of 14.7 months, among those treated with nivolumab.19,20 These, and other data led to FDA-approval of pembrolizumab and nivolumab as a third-line treatment option for patients with relapsed/refractory cHL in 2016, and support the concept that tissue-based biomarker studies can identify patient populations most likely to respond to immune checkpoint therapy.18,21,22
The genetics and spatial characteristics of PD-L1 expression in TCRLBCL have not yet been thoroughly explored, and the clinical responses of patients with relapsed/refractory TCRLBCL to PD-1 blockade have not been reported. We performed a multimodal analysis of PD-1/PD-L1 pathway interactions in a multi-institutional cohort with TCRLBCL, which included fluorescence insitu hybridization (FISH) to assess PD-L1/PD-L2 alterations, double immunohistochemistry (IHC) studies to assess PD-L1 expression in malignant B cells, and multispectral immunofluorescence (mIF) microscopy and spatial image analysis to define the spatial organization of PD-1/PD-L1 interactions within the tumor microenvironment (TME). Finally, we retrospectively evaluated clinical responses to PD-1 blockade in 5 patients with relapsed/refractory TCRLBCL who were enrolled in clinical trials of pembrolizumab for refractory hematologic malignancies.
Methods
Case identification
Formalin-fixed, paraffin-embedded biopsy sections from patients with TCRLBCL (n = 33) and DLBCL-NOS (n = 21) were identified through institutional review board–approved searches of the pathology archives at Brigham and Women’s Hospital, Massachusetts General Hospital, University of Massachusetts Medical School, and MD Anderson Cancer Center. These included a mixture of de novo and relapsed/refractory cases (supplemental Table 1, available on the Blood Web site). Cases from 2 published cohorts with cHL (n = 106 and n = 20 cases, respectively) were used in comparison studies.13,14 This study was conducted in accordance with the Declaration of Helsinki.
FISH assay and scoring for PD-L1/PD-L2 alterations
Fluorescence in situ hybridization (FISH), with probes targeting PD-L1 and -L2 on chromosome 9p24.1 and a centromeric region (CEP9), was performed on formalin-fixed, paraffin-embedded tissue, as described.13,23 After probe hybridization, malignant cell nuclei stained with 4′,6-diamidino-2-phenylindole were identified by morphological features, and ∼50 tumor nuclei were scored per case. Cases were classified according to the highest-level alteration observed in any single tumor cell. Cases with PD-L1/PD-L2 relative gain (PD-L1/PD-L2-to-CEP9 ratio >1) included those classified as copy gain (PD-L1/PD-L2-to-CEP9 ratio >1 but <3), and those classified as amplification (PD-L1/PD-L2-to-CEP9 ratio ≥3) based upon the highest-level genetic alteration. Cases that lacked PD-L1/PD-L2 relative gain (PD-L1/PD-L2-to-CEP9 ratio ≤1) included those classified as disomy (PD-L1/PD-L2-to-CEP9 ratio = 1, with 2 copies of the target and control probes) and those classified as polysomy (PD-L1/PD-L2-to-CEP9 ratio = 1, but with >2 copies of the target and control probes) based on the highest-level genetic alteration.13,23
Chromogenic IHC and assessment of PD-L1 expression
Malignant cell PD-L1 expression was assessed by double-chromogenic IHC with antibodies targeting PD-L1 (clone 405.9A11, GJF, DFCI; Cell Signaling Technology, Beverly, MA) and the B-cell–specific marker PAX5 (24/Pax-5; BD Biosciences, San Jose, CA), as described.12,13,16 Single-chromogenic IHC was performed with a validated antibody targeting PD-L2 (clone 366C.9E5, GJF, DFCI).24 In total, ∼50 tumor cells per sample were scored for membranous PD-L1 and -L2 expression by 2 pathologists (G.K.G. and S.J.R.) who were blinded to genotype. A modified H-score was calculated by multiplying the percentage of positive tumor cells (0% to 100%) by the average staining intensity (0-3+), with values ranging from 0 (100% of cells with no staining) to 300 (100% of cells with 3+ staining).13,23,25,26 Anti-phospho-Stat 1 (anti-Tyr701, clone 58D6, #9167; Cell Signaling Technology) was run at 1:300 dilution with citrate antigen retrieval (3,3'-diaminobenzidine). Anti-CD68 (clone PG-M1, #0876; Agilent/DAKO, Santa Clara, CA) was run at 1:200 dilution with citrate antigen retrieval (AP red). ISH for IFNG was performed with specific antisense probes (#447891; ACD, Hayward, CA), as described.27
mIF microscopy and cell phenotyping
mIF staining was performed on samples of TCRLBCL (n = 26) and DLBCL-NOS (n = 18) with a panel of primary antibodies (anti-PAX5 [24/Pax-5], anti-CD68 [clone PG-M1; DAKO/Agilent], anti-CD3 [rabbit polyclonal], anti-PD-1 [EH33, CST], and anti-PD-L1 [405.9A11]) that were detected with horseradish peroxidase (HRP)-conjugated secondary antibodies and tyramide-conjugated fluorophores.14,15 The TCRLBCL and DLBCL-NOS cases included those from the FISH and IHC cohorts with sufficient remaining samples for mIF analysis. cHL image data were derived from cases (n = 19) described previously.14 A subset of TCRLBCL (n = 11) was stained with a panel of antibodies (anti-PAX5 [24/Pax-5], CD68 [PG-M1], CD4 [4B12, DAKO], CD8 [C8/144B, DAKO], PD-1 [EH33], and PD-L1 [405.9A11]) to evaluate T-cell subsets. The Vectra multispectral imaging platform was used to acquire images and included 4 contiguous fields of view at 20× resolution (PerkinElmer, Hopkinton, MA), as described.14,15 Image analysis used supervised machine learning algorithms within the Inform 2.1 software (PerkinElmer), which assigned trained-phenotypes and Cartesian coordinates to all cells.14,15 Cell phenotypic maps generated through a pathologist-assisted machine-learning algorithm accurately reflected cell phenotypes, including the distinction between large, malignant PAX5+ B cells and small, nonmalignant PAX5+ B cells, as judged by pathologist review.
Spatial analysis of cell phenotypic data
Cell density, direct cell-cell interactions, and Euclidean distance “within-without” analyses were performed on mIF phenotypic data by using our image analysis pipeline, which is freely available at the following sites (https://github.com/gusef/IrisSpatialFeatures and https://github.com/jason-weirather/pythologist).14,15 Tumor-immune “neighborhood” analysis28,29 was performed by determining the cellular composition within a 75-μm radius around individual cells, a distance significant for HRS-cell neighborhoods in cHL,14,15 and performing unsupervised k-means clustering (Python Scikit-learn, version 0.21.2) followed by manual merging, annotation, and visualization by Uniform Manifold Approximation and Projection (UMAP, version 0.3.9).30 Additional details are provided in supplemental Methods.
Identification of patients treated with anti-PD-1 immunotherapy
Patients (n = 5) were identified according to institutional review board requirements from those enrolled in ongoing clinical trials of pembrolizumab for refractory hematologic malignancies (http://clinicaltrials.gov/ #NCT03316573 and #NCT01953692) and included all patients from the Brigham and Women’s Hospital/Dana-Farber Cancer Center and the Massachusetts General Hospital with TCRLBCL who had received pembrolizumab. For both trials, permission was received from the study sponsors to separately report clinical responses in the subset of patients with TCRLBCL, given the rarity of the tumor type. Responses were determined by local investigator review of available clinical and radiologic findings according to 2014 Lugano treatment response criteria.31 Suitable biopsy tissue was not uniformly available from these 5 patients to permit complete characterization by FISH, IHC, and mIF.
Statistics
The statistical tests are indicated in the corresponding figure legends and were performed with GraphPad Prism (version 8.1.0), the R software package (version 3.6.1), and the python SciPy software package (version 1.2.0).
Results
Malignant cells show relative gains of PD-L1/PD-L2 in a subset of TCRLBCLs
We used a previously validated,13,23 custom FISH assay targeting PD-L1 and -L2 on chromosome 9p24.1, and the centromeric region of chromosome 9 (CEP9), to identify PD-L1/PD-L2 disomy, polysomy, copy gain, amplification, and rearrangement in the malignant B cells of TCRLBCL (Figure 1A). We scored 1475 cells across 33 cases (median, 50 tumor nuclei analyzed per case; range 12-51) and found PD-L1/PD-L2 disomy in 2 cases (6%), polysomy in 8 (24%), copy gain in 14 (43%), amplification in 7 (21%), and rearrangement in 2 (6%), as the highest-level genetic alterations (Figure 1B). TCRLBCLs with malignant cells showing polysomy as the highest-level alteration included subpopulations with PD-L1/PD-L2 disomy. Those with copy gain as the highest-level genetic alteration included subpopulations with polysomy and disomy, and those with amplification as the highest-level genetic alteration included, for a subset of cases, subpopulations with copy gain, polysomy, and disomy, consistent with intratumoral genetic heterogeneity. PD-L1/PD-L2 polysomy was generally of low copy number, with 3 to 4 copies of the loci per cell (supplemental Table 1). Six biopsy samples represented relapsed disease, and all showed either PD-L1/PD-L2 copy gain (4 cases) or amplification (2 cases). The percentage of cases with PD-L1/PD-L2 copy gain or amplification (hereafter, PD-L1/PD-L2 relative gain) was significantly higher for TCRLBCL than for DLBCL-NOS (64% vs 24%; P = .0057) and significantly lower for TCRLBCL than for cHL, as reported previously (64% vs 92%, P = .0001; Figure 1C).13 These data identify PD-L1/PD-L2 relative gain as a genetic characteristic of most but not all TCRLBCLs.
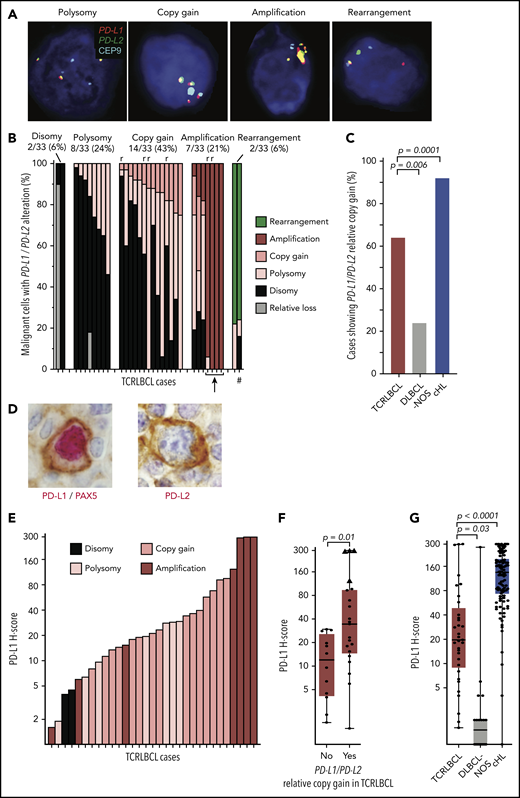
Alterations of PD-L1/PD-L2 correlate with expression of PD-L1 in malignant B cells. (A) Representative FISH images of probes targeting PD-L1 and PD-L2, which lie adjacent on chromosome 9p24.1, and a centromeric region of chromosome 9 (CEP9, aqua) hybridized against individual malignant cell nuclei highlighted by 4′,6-diamidino-2-phenylindole, showing PD-L1/PD-L2 polysomy, copy gain, amplification, and rearrangement (original magnification, ×100). (B) Waterfall plot showing individual TCRLBCL cases (x-axis) and the proportion of malignant cells with the indicated PD-L1/PD-L2 alteration (y-axis); r, relapsed/refractory cases; arrow, 4 cases with high-level amplifications; #, a case with a productive PD-L2 rearrangement (verified by PD-L2 IHC, panel D). (C) Comparison of the proportion of cases with PD-L1/PD-L2 relative gain (ie, copy gain or amplification) across cases of TCRLBCL (n = 33, red), cHL (n = 108, blue),13 and DLBCL-NOS (n = 21, gray). (D) Representative IHC demonstrating nuclear PAX5 (red) and membranous PD-L1 (brown) coexpression by a malignant B cell in a case of TCRLBCL with PD-L1/PD-L2 amplification (left), and representative IHC demonstrating membranous PD-L2 expression (brown, PAX5-staining was not performed) by a malignant B cell in a case of TCRLBCL, demonstrating rearrangement of PD-L2 (right) (original magification, ×100). (E) Waterfall plot showing individual TRLBCL cases (x-axis) and malignant cell-specific PD-L1 H-score (y-axis). The corresponding genetic classification for each case is indicated. (F) Comparison of PD-L1 H-scores for individual cases (● and ▲) displayed according to those with PD-L1/PD-L2 relative gain (ie, amplification or copy gain; n = 21) vs those without (n = 12). Four cases where >75% of tumor nuclei showed PD-L1/PD-L2 amplification are designated with triangles. (G) Comparison of malignant tumor cell PD-L1 H-scores for cases of TCRLBCL (n = 33, red), cHL (n = 106, blue),13 and DLBCL-NOS (n = 20, gray). For box-and-whisker plots (F, G) the median (line), 25th and 75th percentiles (boxes), and extreme values (whiskers) are indicated. Statistical comparisons by the 2-sided Mann-Whitney U test (F, G) and Fisher’s exact test with Bonferroni correction for multiple comparisons (C).
Alterations of PD-L1/PD-L2 correlate with expression of PD-L1 in malignant B cells. (A) Representative FISH images of probes targeting PD-L1 and PD-L2, which lie adjacent on chromosome 9p24.1, and a centromeric region of chromosome 9 (CEP9, aqua) hybridized against individual malignant cell nuclei highlighted by 4′,6-diamidino-2-phenylindole, showing PD-L1/PD-L2 polysomy, copy gain, amplification, and rearrangement (original magnification, ×100). (B) Waterfall plot showing individual TCRLBCL cases (x-axis) and the proportion of malignant cells with the indicated PD-L1/PD-L2 alteration (y-axis); r, relapsed/refractory cases; arrow, 4 cases with high-level amplifications; #, a case with a productive PD-L2 rearrangement (verified by PD-L2 IHC, panel D). (C) Comparison of the proportion of cases with PD-L1/PD-L2 relative gain (ie, copy gain or amplification) across cases of TCRLBCL (n = 33, red), cHL (n = 108, blue),13 and DLBCL-NOS (n = 21, gray). (D) Representative IHC demonstrating nuclear PAX5 (red) and membranous PD-L1 (brown) coexpression by a malignant B cell in a case of TCRLBCL with PD-L1/PD-L2 amplification (left), and representative IHC demonstrating membranous PD-L2 expression (brown, PAX5-staining was not performed) by a malignant B cell in a case of TCRLBCL, demonstrating rearrangement of PD-L2 (right) (original magification, ×100). (E) Waterfall plot showing individual TRLBCL cases (x-axis) and malignant cell-specific PD-L1 H-score (y-axis). The corresponding genetic classification for each case is indicated. (F) Comparison of PD-L1 H-scores for individual cases (● and ▲) displayed according to those with PD-L1/PD-L2 relative gain (ie, amplification or copy gain; n = 21) vs those without (n = 12). Four cases where >75% of tumor nuclei showed PD-L1/PD-L2 amplification are designated with triangles. (G) Comparison of malignant tumor cell PD-L1 H-scores for cases of TCRLBCL (n = 33, red), cHL (n = 106, blue),13 and DLBCL-NOS (n = 20, gray). For box-and-whisker plots (F, G) the median (line), 25th and 75th percentiles (boxes), and extreme values (whiskers) are indicated. Statistical comparisons by the 2-sided Mann-Whitney U test (F, G) and Fisher’s exact test with Bonferroni correction for multiple comparisons (C).
PD-L1/PD-L2 relative gain is associated with increased PD-L1 expression
We next used dual- and single-chromogenic IHC assays to evaluate membranous PD-L1 and PD-L2 expression on malignant B cells in TCRLCBL (Figure 1D). We found at least focal PD-L1 expression in 28 of 33 cases (85%) and, when expressed, we observed heterogeneity in the intensity and extent of PD-L1 expression, as captured by a broad range of pathologic H-scores (range, 1-300; median, 19.6; Figure 1E).
TCRLBCL cases with PD-L1/PD-L2 relative gain demonstrated significantly higher median PD-L1 H-scores than those without (median 35 vs 12; P = .0111; Figure 1F). Four cases with near-uniform PD-L1/PD-L2 amplification across the malignant B-cell population (Figure 1B; cases denoted by an arrow) had the highest PD-L1 H-scores (range, 124-300; Figure 1F; cases denoted by triangles). PD-L2 was rarely seen on malignant cells; however, we observed 1 case with strong and diffuse PD-L2 expression (PD-L2 H-score 233; Figure 1D; right panel) and a corresponding rearrangement of PD-L2 (Figure 1B; case denoted by a hash mark). The median H-scores for malignant B-cell PD-L1 expression were significantly higher for TCRLBCL than for DLBCL-NOS (median, 19.6 vs 1.5; P = .0275) and significantly lower for TCRLBCL than for HRS-cell PD-L1 expression in cHL (median, 135; P < .0001; Figure 1G).23 We conclude that PD-L1/PD-L2 alterations drive malignant cell-specific PD-L1 expression in TCRLBCL, and that these changes occur more often in TCRLBCL than in DLBCL-NOS, but less often in TCRLBCL than in cHL.
Malignant B-cells contact locally enriched populations of PD-L1+ TAMs
Our review of double-chromogenic IHC with antibodies targeting PAX5 and PD-L1 revealed extensive PD-L1 expression by nonmalignant cells (supplemental Figure 1). To better characterize this observation, we sequentially stained the case series with antibodies identifying B cells (PAX5), TAMs (CD68), T cells (CD3), PD-L1, and PD-1 and imaged the stained samples with mIF microscopy. A review of the mIF images suggested that PAX5+ malignant B cells were in frequent contact with PD-L1+ TAMs (Figure 2A; supplemental Figure 2). Phenotypic maps colored to show contacts between specified cell types confirmed this impression (Figure 2B). By quantitative analysis, we found that a median of 25% of all malignant B-cell contacts occurred with PD-L1+ TAMs, whereas only 2% of all malignant B-cell contacts occurred with PD-L1− TAMs (P < .0001; Figure 2C).
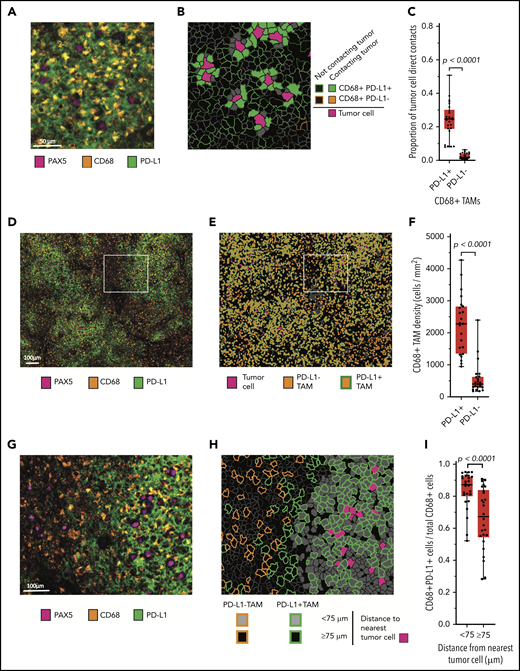
Malignant B cells are in frequent contact with PD-L1+ TAMs. (A) Representative high-power mIF image demonstrating PD-L1 expression on the surface of CD68+ TAMs in contact with a PAX5+ malignant B cells. (B) Cell-cell contact map of the mIF image shown in panel A (same scale). PD-L1+ TAMs, PD-L1− TAMs (not present in the image), and other cells in contact with malignant cells and PD-L1+ TAMs and PD-L1− TAMs not in contact with malignant cells are indicated. (C) Proportion of malignant B-cell contacts for individual cases (●) displayed according to the proportion of contacts with PD-L1+ TAMs vs PD-L1− TAMs (n = 26). (D) Low-power, maximum field-of-view mIF image of TCRLBCL shown in panel A. (E) Cell phenotype map corresponding to the mIF image in panel D: PD-L1+ TAMs, PD-L1− TAMs, and malignant cells are indicated. (F) TAM density for individual cases (●) displayed according to the density of PD-L1+ TAMs and PD-L1− TAMs. (G) Intermediate-power mIF image of the region highlighted in panel D: PD-L1 expression on CD68+ TAMs and PAX5+ B cells. (H) Cell proximity map of the region highlighted in panel E, showing the spatial distribution of PD-L1+ TAMs and PD-L1− TAMs relative to malignant B cells (<75 μm and ≥75 μm). (I) The ratio of PD-L1+ TAMs to total TAMs for individual cases (●) displayed according to whether the TAMs are located <75 or ≥75 μm from malignant B cells. For the box-and-whisker plots (C, F, I) the median (line), 25th and 75th percentiles (boxes), and extreme values (whiskers) are indicated. Statistical comparisons by 2-sided Mann-Whitney U test, Wilcoxon matched-pairs signed rank test, and the Kruskal-Wallis test with Dunn’s test for multiple comparisons.
Malignant B cells are in frequent contact with PD-L1+ TAMs. (A) Representative high-power mIF image demonstrating PD-L1 expression on the surface of CD68+ TAMs in contact with a PAX5+ malignant B cells. (B) Cell-cell contact map of the mIF image shown in panel A (same scale). PD-L1+ TAMs, PD-L1− TAMs (not present in the image), and other cells in contact with malignant cells and PD-L1+ TAMs and PD-L1− TAMs not in contact with malignant cells are indicated. (C) Proportion of malignant B-cell contacts for individual cases (●) displayed according to the proportion of contacts with PD-L1+ TAMs vs PD-L1− TAMs (n = 26). (D) Low-power, maximum field-of-view mIF image of TCRLBCL shown in panel A. (E) Cell phenotype map corresponding to the mIF image in panel D: PD-L1+ TAMs, PD-L1− TAMs, and malignant cells are indicated. (F) TAM density for individual cases (●) displayed according to the density of PD-L1+ TAMs and PD-L1− TAMs. (G) Intermediate-power mIF image of the region highlighted in panel D: PD-L1 expression on CD68+ TAMs and PAX5+ B cells. (H) Cell proximity map of the region highlighted in panel E, showing the spatial distribution of PD-L1+ TAMs and PD-L1− TAMs relative to malignant B cells (<75 μm and ≥75 μm). (I) The ratio of PD-L1+ TAMs to total TAMs for individual cases (●) displayed according to whether the TAMs are located <75 or ≥75 μm from malignant B cells. For the box-and-whisker plots (C, F, I) the median (line), 25th and 75th percentiles (boxes), and extreme values (whiskers) are indicated. Statistical comparisons by 2-sided Mann-Whitney U test, Wilcoxon matched-pairs signed rank test, and the Kruskal-Wallis test with Dunn’s test for multiple comparisons.
We then asked whether the high frequency of malignant B-cell contacts with PD-L1+ TAMs was related to a general preponderance of PD-L1+ TAMs within the TME, a consequence of spatial enrichment in proximity to malignant B cells, or both. The median density of PD-L1+ TAMs was significantly higher than the median density of PD-L1− TAMs (median, 2260 cells/mm2 vs 445 cells/mm2, respectively; P < .0001; Figure 2D-F), indicating that PD-L1+ TAMs are a globally increased cell population. Using within-without analysis, we also determined that TAMs located <75-μm radial distance from malignant B cells were more frequently PD-L1+ than were TAMs located ≥75-μm radial distance (median 87% vs 67%, respectively; P < .0001; Figure 2G-I), consistent with enrichment of this cell population in proximity to malignant B cells.
We did not observe gains in PD-L1/PD-L2 among the nonneoplastic TAMs. We therefore sought an alternative mechanism for PD-L1 induction. Prior studies have demonstrated that IFN-γ–mediated JAK-STAT signaling induces PD-L1 expression on cells via a STAT1-responsive ISRE/IRF1 element in the PD-L1 promoter.32,33 A prior study has also shown that the TCRLBCL TME is characterized by a robust IFN-γ gene signature.7 We therefore examined whether IFN-γ and activated STAT1 were characteristic features in 2 cases with robust TAM PD-L1 expression. ISH with an antisense probe targeting IFNG transcripts revealed prominent IFNG production by a subset of lymphoid cells adjacent to malignant cells in both cases (supplemental Figure 3A-B).27 Double-IHC staining with antibodies specific for the phosphorylated (activated) form of STAT1 (pSTAT1) and the macrophage marker CD68 revealed nuclear pSTAT1 in nearly all CD68+ TAMs adjacent to malignant cells (supplemental Figure 3C-D). Together, these data highlight robust IFN-γ activity in the TCRLBCL TME and suggest IFN-γ–mediated JAK-STAT signaling as a potential mechanism underlying PD-L1 expression in TAMs.
Malignant B-cells contact diffusely infiltrating populations of PD-1+ T cells
A review of chromogenic IHC for PD-1 suggested that malignant B cells were in frequent contact with the PD-1+ cells (supplemental Figure 4). mIF images (Figure 3A) and phenotypic maps colored to show contacts between specified cell types revealed PD-1 expression almost entirely on T cells (Figure 3B). Whereas we observed no PD-1 expression on CD68+ macrophages, we found at least focal PD-1 expression by the malignant B cells in 8 of 31 cases (26%; supplemental Figure 5). By quantitative analysis, we found that a median of 31% of all malignant B-cell contacts occurred with PD-1+ T cells, whereas a median of 10% of malignant B-cell contacts occurred with PD-1− T cells (P < .0001; Figure 3C). PD-1+ T-cell contacts represented both CD4+ and CD8+ subsets, with marked skewing in the CD4/CD8 ratio in individual cases (median CD4/CD8 ratio, 1.6:1; range, 0.06:1-14.4:1).

Malignant B cells are in frequent contact with PD-1+ T cells. (A) Representative high-power mIF image demonstrating PD-1 expression on the surface of CD3+ T cells in contact with a PAX5+ B cells). (B) Cell-cell contact map of the mIF image shown in panel A (same scale). PD-1+ T cells, PD-1− T cells, and other cells (solid gray) in contact with malignant cells and PD-1+ T cells and PD-1− T cells (outlined) not in contact with malignant cells. (C) Proportion of malignant cell contacts for individual cases (●) displayed according to the proportion of PD-1+ T-cell contacts vs PD-1− T-cell contacts (n = 26). (D) Low-power, maximum field-of-view mIF image of TCRLBCL in panel A: PD-1 on CD3+ T cells intermixed with PAX5+ B cells. (E) Cell phenotype map corresponding to the mIF image in panel D: PD-1+ T cells, PD-1− T cells, and malignant B cells. (F) T-cell density for individual cases (●) displayed according to the density of PD-1+ T cells and PD-1− T cells. (G) Intermediate-power mIF image of the boxed region in panel D: PD-1 expression on CD3+ T cells intermixed with PAX5+ B cells. (H) Cell proximity map of the region highlighted in panel E: spatial distribution of PD-1+ T cells and PD-1− T cells relative to malignant cells, showing T cells that are located <75 μm from malignant cells and those that are located ≥75 μm from malignant cells. (I) The ratio of PD-1+ T cells to total T cells for individual cases (●) displayed according whether the T cells are located <75 or ≥75 μm from malignant B cells. For the box-and-whisker plots (C,F,I), the median (line), 25th and 75th percentiles (boxes), and extreme values (whiskers) are indicated. Statistical comparisons by the 2-sided Mann-Whitney U test, Wilcoxon matched-pairs signed-rank test, and the Kruskal-Wallis test with Dunn’s test for multiple comparisons.
Malignant B cells are in frequent contact with PD-1+ T cells. (A) Representative high-power mIF image demonstrating PD-1 expression on the surface of CD3+ T cells in contact with a PAX5+ B cells). (B) Cell-cell contact map of the mIF image shown in panel A (same scale). PD-1+ T cells, PD-1− T cells, and other cells (solid gray) in contact with malignant cells and PD-1+ T cells and PD-1− T cells (outlined) not in contact with malignant cells. (C) Proportion of malignant cell contacts for individual cases (●) displayed according to the proportion of PD-1+ T-cell contacts vs PD-1− T-cell contacts (n = 26). (D) Low-power, maximum field-of-view mIF image of TCRLBCL in panel A: PD-1 on CD3+ T cells intermixed with PAX5+ B cells. (E) Cell phenotype map corresponding to the mIF image in panel D: PD-1+ T cells, PD-1− T cells, and malignant B cells. (F) T-cell density for individual cases (●) displayed according to the density of PD-1+ T cells and PD-1− T cells. (G) Intermediate-power mIF image of the boxed region in panel D: PD-1 expression on CD3+ T cells intermixed with PAX5+ B cells. (H) Cell proximity map of the region highlighted in panel E: spatial distribution of PD-1+ T cells and PD-1− T cells relative to malignant cells, showing T cells that are located <75 μm from malignant cells and those that are located ≥75 μm from malignant cells. (I) The ratio of PD-1+ T cells to total T cells for individual cases (●) displayed according whether the T cells are located <75 or ≥75 μm from malignant B cells. For the box-and-whisker plots (C,F,I), the median (line), 25th and 75th percentiles (boxes), and extreme values (whiskers) are indicated. Statistical comparisons by the 2-sided Mann-Whitney U test, Wilcoxon matched-pairs signed-rank test, and the Kruskal-Wallis test with Dunn’s test for multiple comparisons.
We next evaluated the density and spatial distribution of PD-1+ T cells in the TME. The median density of PD-1+ T cells was higher than that of the PD-1− T cells (median, 3357 cells/mm2 vs 1334 cells/mm2; respectively; P = .0003; Figure 3D-F) indicating a globally increased PD-1+ T-cell population. We did not observe spatial enrichment for PD-1+ T cells in proximity to malignant cells (median, 76% <75 μm of malignant cells vs 77% ≥75 μm of malignant cells; P = .2914; Figure 3G-I). This result did not change when the radial size of the niche was increased beyond 75 μm, suggesting that the high number of cell contacts between malignant B cells and PD-1+ T cells reflected the high density of the latter cell population within the TME. Individual malignant B cells in contact with PD-1+ T cells also showed frequent direct interaction with PD-L1+ TAMs (median, 50%; range, 26% to 79%; supplemental Figure 6), indicating that these interactions are not mutually exclusive.
Spatially resolved immune signatures distinguish TCRLBCL from cHL and DLBCL-NOS
The results of the cell-cell contact, cell density, and proximity analyses suggested that the exceptionally high densities and spatial distributions of PD-L1+ TAMs and PD-1+ T cells within the TCRLBCL TME may distinguish TCRLBCL from cHL and DLBCL-NOS. To test this notion, we used unbiased clustering of spatially resolved cell phenotypes from our TCRLCBL mIF cohort and data we generated from comparison cohorts of cHL and DLBCL-NOS. We defined a series of overlapping cellular neighborhoods, 75 μm in radius, surrounding every cell in the TCRLBCL, cHL, and DLBCL-NOS series, and then quantified the fractional composition of individual cell phenotypes within each neighborhood (Figure 4A). We then performed k-means clustering across all identified neighborhoods (n = 1 863 437) and identified 7 distinct tumor-immune neighborhood clusters, according to differences in fractional cell composition (Figure 4A-B; supplemental Figure 7A-B).
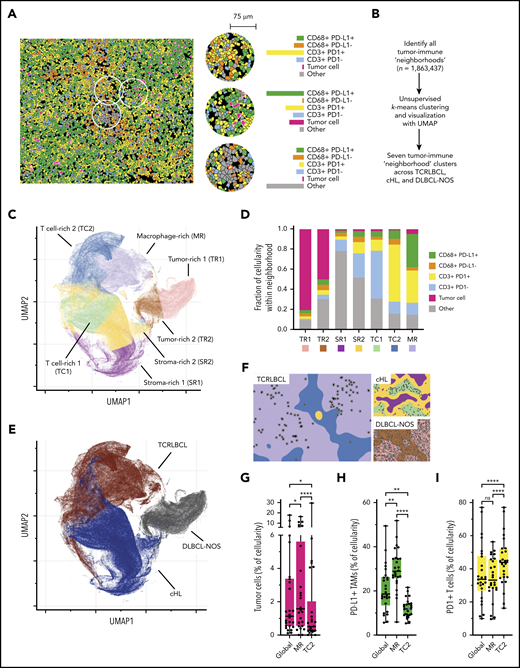
Spatially defined immune cell neighborhoods distinguish TCRLBCL from cHL and DLBCL-NOS. (A) Representative cell phenotype map generated from a 5-marker mIF panel (CD3, PAX5, CD68, PD-1, and PD-L1), which highlights PD-L1+ TAMs, PD-L1− TAMs, PD-1+ T cells, PD-1− T cells, malignant B cells, and other cell types (original magnification, ×20). Circles surround the cellular neighborhoods of 3 representative “anchor” cells (yellow with red outline). Neighborhoods are defined by calculating the fractional composition of cell types <75 μm radial distance surrounding each anchor cell. (B) Neighborhood analysis workflow, which included unsupervised k-means clustering of all cell neighborhoods (n = 1 863 437) defined across cases of TCRLBCL (n = 26), cHL (n = 19), and DLBCL-NOS (n = 18) and assigned to 1 of 7 neighborhood clusters. (C) UMAP plot of pooled neighborhood data from TCRLBCL, cHL, and DLBCL-NOS cases with the 7 clusters color-coded. (D) Fractional composition of cell types within each of 7 defined clusters, color-coded. (E) UMAP plot from panel C colored according to the underlying pathologic diagnosis and demonstrating segregation of cell-neighborhoods from cases of TCRLBCL (red), cHL (blue), and DLBCL-NOS (black) into distinct regions. (F) Projections of color-coded neighborhoods (according to panel C) onto the original mIF images for representative cases of TCRLBCL (left, same case as shown in panel A), cHL (top right panel), and DLBCL-NOS (bottom right panel). Malignant cells are denoted by circles. (G-I) Percentage of global and neighborhood-specific cellularity in TCRLBCL comprised of malignant B cells (G), PD-L1+ TAMs (H), and PD-1+ T cells (I). (G-I) Individual cases (●) and the median (line), 25th and 75th percentiles (boxes), and extreme values (whiskers) are indicated. Statistical comparisons by the Friedman test with Dunn’s test for multiple comparisons. *P < .05; **P < .01; ****P < .0001.
Spatially defined immune cell neighborhoods distinguish TCRLBCL from cHL and DLBCL-NOS. (A) Representative cell phenotype map generated from a 5-marker mIF panel (CD3, PAX5, CD68, PD-1, and PD-L1), which highlights PD-L1+ TAMs, PD-L1− TAMs, PD-1+ T cells, PD-1− T cells, malignant B cells, and other cell types (original magnification, ×20). Circles surround the cellular neighborhoods of 3 representative “anchor” cells (yellow with red outline). Neighborhoods are defined by calculating the fractional composition of cell types <75 μm radial distance surrounding each anchor cell. (B) Neighborhood analysis workflow, which included unsupervised k-means clustering of all cell neighborhoods (n = 1 863 437) defined across cases of TCRLBCL (n = 26), cHL (n = 19), and DLBCL-NOS (n = 18) and assigned to 1 of 7 neighborhood clusters. (C) UMAP plot of pooled neighborhood data from TCRLBCL, cHL, and DLBCL-NOS cases with the 7 clusters color-coded. (D) Fractional composition of cell types within each of 7 defined clusters, color-coded. (E) UMAP plot from panel C colored according to the underlying pathologic diagnosis and demonstrating segregation of cell-neighborhoods from cases of TCRLBCL (red), cHL (blue), and DLBCL-NOS (black) into distinct regions. (F) Projections of color-coded neighborhoods (according to panel C) onto the original mIF images for representative cases of TCRLBCL (left, same case as shown in panel A), cHL (top right panel), and DLBCL-NOS (bottom right panel). Malignant cells are denoted by circles. (G-I) Percentage of global and neighborhood-specific cellularity in TCRLBCL comprised of malignant B cells (G), PD-L1+ TAMs (H), and PD-1+ T cells (I). (G-I) Individual cases (●) and the median (line), 25th and 75th percentiles (boxes), and extreme values (whiskers) are indicated. Statistical comparisons by the Friedman test with Dunn’s test for multiple comparisons. *P < .05; **P < .01; ****P < .0001.
Visualization of these data by a UMAP plot revealed robust separation of individual cell neighborhoods into distinct neighborhood clusters (Figure 4C). Each neighborhood cluster was characterized by a distinct composition of malignant (tumor) cells, TAMs, T cells, and other cells (including stromal cells, endothelial cells, and other immune cell types that were not specifically phenotyped) and PD-1/PD-L1 expression status (Figure 4D). Remarkably, these neighborhood clusters readily separated individual neighborhoods according to the underlying pathologic diagnosis (Figure 4E) and identified the major features of the TME within each tumor type, including tumor cell–rich neighborhoods in DLBCL-NOS (tumor-rich 1 [TR1] and tumor-rich 2, [TR2]), and stroma-rich neighborhoods in cHL (stroma-rich 1 [SR1] and stroma-rich 2 [SR2], Figure 4F).
Unbiased cluster analysis also identified tumor-defining, immune-rich neighborhoods that distinguished TCRLBCL from cHL. Specifically, we found 2 distinct neighborhood clusters within the TCRLBCL immune-rich microenvironment: 1 containing numerous PD-L1+ TAMs (macrophage-rich [MR]) and 1 containing numerous PD-1+ T cells (T-cell–rich 2 [TC2]; Figure 4F). By contrast, immune-rich neighborhoods in cHL were characterized by a distinct T-cell–rich cluster (T cell-rich 1, [TC1]) containing frequent PD-1− T cells intermixed with proportionally smaller but distinct populations of PD-1+ T cells and PD-L1+ macrophages (Figure 4F).
Further, the unbiased cluster analysis revealed differences in the spatial distribution of malignant and immune cell populations within immune-rich neighborhoods in TCRLBCL, which were consistent with the results of the directed spatial analyses. Namely, we found that malignant cells were statistically enriched within the MR neighborhood cluster (median, 1.6% of cellularity within MR neighborhoods) when compared with the TC2 neighborhood cluster (median, 0.5% of cellularity; P < .0001) or to the entire TME (median, 1.1% of cellularity; P = .0377; Figure 4G). In addition, PD-L1+ TAMs were enriched within the MR neighborhood cluster (median, 29% of cellularity) when compared with the TC2 neighborhood cluster (median, 12% of cellularity; P < .0001) or the entire TME (median, 19% of cellularity; P = .0016; Figure 4H). PD-1+ T cells were not enriched within the MR neighborhood cluster (median 33% of cellularity) relative to the entire TME (median 34% of cellularity; P > .99) but were depleted relative to the TC2 neighborhood cluster (median, 44% of cellularity; P < .0001; Figure 4I). We did not find significant differences in the relative percentage of neighborhoods classified as MR1 or TC2 between TCRLBCL cases with PD-L1/PD-L2 relative gain and those without (P = .6 and 0.2, respectively). We conclude that TCRLBCL, cHL, and DLBCL-NOS have distinct, spatially defined immune signatures, with TCRLBCL distinguished by immune-rich neighborhoods with an exceptionally high number of PD-L1+ TAMs close to malignant cells, with surrounding neighborhoods dominated by PD-1+ T cells.
Responses to PD-1 blockade
The genetic and microenvironmental evidence for PD-1 pathway activation in TCRLBCL provided a rationale for evaluating clinical responses to PD-1 blockade in patients with this disease. We identified 5 patients with TCRLBCL among all patients enrolled in 2 ongoing trials of pembrolizumab monotherapy for relapsed/refractory hematologic neoplasms at our institution and reviewed their clinical outcomes (Table 1; see “Methods”). Three of 5 patients (60%) experienced a clinical response, including 2 with a complete response (CR) and 1 with a partial response (PR). Among those who achieved a CR, patient 1 received pembrolizumab monotherapy over a 2-year period and remained disease-free ∼1 year after discontinuing treatment. Salvage treatment had failed in patient 2, who received anti-CD19–directed CAR-T cells but went on to a CR after 6 months of pembrolizumab monotherapy and has continued in CR. Patient 3 experienced a PR after 9 months of pembrolizumab, which was followed by mixed radiologic progression. Patients 4 and 5 experienced early progressive disease after 3 to 5 cycles of pembrolizumab. We conclude that anti-PD-1 monotherapy can produce sustained clinical responses in patients with relapsed/refractory TCRLBCL.
Patient characteristics and response to pembrolizumab
| Patient | |||||
|---|---|---|---|---|---|
| 1 | 2 | 3 | 4 | 5 | |
| Prior therapies, n | 2 | 4 | 2 | 3 | 2 |
| Prior anti-CD19 CAR-T cells | No | Yes | No | No | No |
| Cycles of pembrolizumab, n | 32 | 9 | 14 | 3 | 5 |
| Best radiographic response | CR (ongoing*) | CR (ongoing*) | PR | PD | PD |
| Patient | |||||
|---|---|---|---|---|---|
| 1 | 2 | 3 | 4 | 5 | |
| Prior therapies, n | 2 | 4 | 2 | 3 | 2 |
| Prior anti-CD19 CAR-T cells | No | Yes | No | No | No |
| Cycles of pembrolizumab, n | 32 | 9 | 14 | 3 | 5 |
| Best radiographic response | CR (ongoing*) | CR (ongoing*) | PR | PD | PD |
PD, progressive disease.
For patient 1, CR >2 years; for patient 2, CR >6 months.
Biopsy tissue from patient 1, who achieved a long-standing CR after pembrolizumab, was available for analysis. We found that the malignant B cells were disomic for PD-L1/PD-L2 and largely negative for PD-L1 (supplemental Figure 8A-B). In contrast, PD-L1+ TAMs and PD-1+ T cells were numerous in proximity to the malignant cells and throughout the TME (supplemental Figure 8B-C). Consistent with this finding, cell neighborhood analysis of mIF data from this case revealed an abundance of TCRLBCL-defining MR and TC2 neighborhoods (supplemental Figure 8D-F). These data suggest that PD-L1+ TAMs are critical in the mechanism of effective immune evasion in TCRLBCL. However, detailed study of a larger cohort of cases is needed to better define the relationship between PD-L1/PD-L2 status, TME characteristics, and clinical response to PD-1-blockade in TCRLBCL.
Discussion
In our study, multiple lines of evidence suggest that malignant B cells in TCRLBCL evade antitumor immunity through PD-1/PD-L1 signaling. First, we observed recurrent PD-L1/PD-L2 amplification or copy gain and associated PD-L1 expression in the malignant B cells in 64% of cases. Second, we found that PD-L1+ TAMs and PD-1+ T cells reside within the TME in very high numbers and are organized according to a tumor-specific, spatially resolved immune signature. Third, we identified clinical responses in 3 of 5 patients with relapsed/refractory disease treated with single-agent pembrolizumab, including 2 durable CRs.
HRS cell-specific PD-L1/PD-L2 relative gain is a near universal feature of cHL, occurring in >90% of cases.13,23 We found that TCRLBCL has a lower incidence of PD-L1/PD-L2 gain in comparison with cHL, which may indicate a lesser dependence upon the genetic lesion for successful immune evasion. TCRLBCL has an incidence of PD-L1/PD-L2 gain comparable to that of primary mediastinal large B-cell lymphoma (MLBCL), which harbors PD-L1/PD-L2 gain in 45% to 60% of cases.11,26,34 In multiple studies of cHL and MLBCL, we demonstrated that PD-L1/PD-L2 relative gain is associated with elevated PD-L1 expression, as we have now observed for TCRLBCL, and provides further support to the concept that PD-L1/PD-L2 alterations constitute a genetic basis for immune evasion for a subset of TCRLBCL.11,13,23,26
In contrast to TCRLBCL, the incidence of PD-L1/PD-L2 gain was low in DLBCL-NOS. This result is also consistent with those in prior studies. We have reported PD-L1/PD-L2 copy gain or amplification in 15 of 73 (21%) DLBCLs from patients treated with nivolumab,25 and others have reported PD-L1/PD-L2 copy gain or amplification in 24 of 105 (23%) DLBCLs when using similar methods.35 In addition, we and others have observed malignant cell-specific PD-L1 expression in 8% to 11% of DLBCL-NOS, an incidence far lower than that for cHL, MLBCL, and now, TCRLBCL.12,25,35-37 Unexpectedly, we observed PD-1 expression by the malignant B cells in 8 of 31 (26%) evaluable TCRLBCL cases, but in none of the DLBCL-NOS cases. The PD-1 status of the malignant cells was not associated with the fraction of PD-L1+ TAMs, however. Although this finding is of uncertain significance, engagement of B-cell specific PD-1 has been shown to promote a tolerogenic immune microenvironment in other cancer types.38,39
The TCRLBCL TME resembles the cHL TME, at least superficially.6 Recently, we reported that the topology of cHL is distinctive, with HRS cells within a microenvironmental niche enriched for PD-L1+ TAMs in contact with PD-1+ CD4+ T cells.14,15 In this study, the malignant B cells of TCRLBCL also resided within a local microenvironment enriched for PD-L1+ TAMs. Such polarization is likely to increase the local reservoir of PD-L1 available to bind PD-1 and enforce T-cell inhibition in proximity to malignant cells.14,15 The TCRLBCL TME differed from cHL, however, in the consistently higher densities of PD-L1+ TAMs and PD-1+ T cells. Remarkably, PD-L1+ TAMs comprised 83% of all TAMs, and PD-1+ “exhausted” T cells comprised 72% of all T cells in TCRLBCL. We speculate that the lower incidence of PD-L1/PD-L2 relative gain and malignant cell-specific PD-L1 expression in TCRLBCL, when compared with cHL, is compensated for by the higher density of PD-L1+ TAMs to ensure adequate PD-1 engagement for immune evasion.
We used unsupervised clustering analysis of cell neighborhoods to establish that the TME in TCRLBCL is distinct from cHL and DLBCL-NOS with respect to PD-1/PD-L1 expression and spatial organization. To our knowledge, this is the first demonstration of an unbiased classification of closely related tumor types according to quantifiably distinct cellular constituents and spatial organization. These results raise the possibility that additional lymphoma subtypes may be characterized and defined by spatially resolved immune signatures. Such quantifiable signatures may prove useful for both diagnosis and patient stratification within diagnostic categories for therapeutic purposes. For instance, in a recent study, investigators reported that a subset of DLBCLs (not including TCRLBCL) with the highest number of intra-tumoral T cells had additional transcriptional and genetic markers of immune evasion, which included 2 cases with PD-L1/PD-L2 gain and response to pembrolizumab.35 A quantitative PD-1 and PD-L1 immune signature could resolve the histologic and phenotypic spectrum between TCRLBCL and DLBCL-NOS and identify those patients who may benefit from PD-1 blockade.
Although the small number of anti-PD-1–treated patients reported in our study precludes definitive conclusions about the true efficacy of this therapy in TCRLBCL, the presence of clinical responses in 3 of 5 patients (including 2 CR and 1 PR) is comparable to the ORR for relapsed/refractory cHL (65% to 80%)10,22 and MLBCL (45% to 48%)26 and contrasts with the extremely low response rate for patients with relapsed/refractory DLBCL-NOS treated with nivolumab or pembrolizumab (8% to 14%).25,35 Furthermore, the potential efficacy of PD-1 blockade in relapsed/refractory TCRLBCL is notable, given anecdotal reports of poor efficacy of anti-CD19 CAR-T therapy (C.A.J., oral communication), which otherwise represents an important therapeutic option for patients with relapsed/refractory DLBCL-NOS. Notably, prior therapy with anti-CD19 CAR-T cells had failed in 1 patient in our anti-PD-1–treated cohort but the patient went on to experience a CR after 6 months of single-agent PD-1 blockade. Although promising, these findings highlight the importance of further testing the efficacy of PD-1 blockade in an expanded cohort of patients with relapsed/refractory TCRLBCL. Finally, recent analyses of the cHL TME suggest roles for molecules beyond PD-1 in regulating immune evasion, including LAG-3 and CTLA-4.15,40,41 It will be of interest to examine whether these and other immunoregulatory proteins are prevalent in the TCRLBCL TME and also represent rational targets for therapy.
The original data are available by e-mail request to the corresponding author.
The online version of this article contains a data supplement.
The publication costs of this article were defrayed in part by page charge payment. Therefore, and solely to indicate this fact, this article is hereby marked “advertisement” in accordance with 18 USC section 1734.
Acknowledgments
This work was supported by National Institutes of Health, National Heart, Lung, and Blood Institute T32 training grant HL007627; the Stanley L. Robbins Memorial Research Fund Award within the Department of Pathology, Brigham and Women’s Hospital (both G.K.G.); and the Center for Immuno-Oncology, the Dana-Farber Cancer Institute.
Authorship
Contribution: G.K.G., J.L.W., M.G.M.R., P.-H.C., D.G., J.J.I., G.J.F., F.S.H., P.A., M.A.S., and S.J.R. designed the experiments; G.K.G., J.L.W., M.G.M.R., M.L., A.K., P.-H.C., D.G., J.J.I., E.J., C.P., M.H.R., J.X., B.J.C., A.R.S., S.B.L., J.S.A., A.I.K., C.A.J., A.S.L., C.D.F., E.D.J., and S.J.R. collected the data; G.K.G., D.G., E.G., B.C., D.N., G.J.F., A.H.L., P.A., M.A.S., and S.J.R. analyzed the data; and G.K.G., K.W., J.L.W., D.N., P.A., M.A.S., and S.J.R. wrote and edited the manuscript.
Conflict-of-interest disclosure: G.K.G. has been a consultant for Moderna Therapeutics. J.J.I. has been a consultant for Tango Therapeutics and Phenomic AI. A.H.L. has served on a Data Safety Monitoring Board for BMS. P.A. has been a consultant for Merck, BMS, Pfizer, Affimed, Adaptive, Infinity, ADC Therapeutics, Celgene, Morphosys, Daiichi Sankyo, Miltenyi, Tessa, GenMab, C4, and Enterome; and has received research funding (institutional) from Merck, BMS, Affimed, Adaptive, Roche, Tensha, Otsuka, Sigma Tau, Genentech, and IGM and honoraria from Merck and BMS. G.J.F. has patents/pending royalties on the PD-1/PD-L1 pathway from Roche, Merck MSD, Bristol-Myers-Squibb, Merck KGA, Boehringer-Ingelheim, AstraZeneca, Dako, Leica, Mayo Clinic, and Novartis. G.J.F. has served on advisory boards for Roche, Bristol-Myers-Squibb, Xios, Origimed, Triursus, iTeos, NextPoint, IgM, and Jubilant and has equity in Nextpoint, Triursus, Xios, and IgM. J.S.A. has been a consultant for Abbvie, Allogene, C4 Therapeutics, Celgene, EMD Serono, Karyopharm, Kite Pharm, Merck, Morphosys, Novartis, and Roche. F.S.H. reports institutional funding from Bristol-Myers Squibb during the conduct of the study; grants, personal fees, and other remuneration from Bristol-Myers Squibb and Novartis; personal fees from Merck, EMD Serono, Takeda, Surface, Genentech/Roche, Compass Therapeutics, Apricity, Bayer, Aduro, Partners Therapeutics, Sanofi, Pfizer, Pionyr, 7 Hills Pharma, Verastem, Torque, Rheos, Kairos, Bicara, Psioxus Therapeutics, and Amgen; and other remuneration from Pieris Pharmacutical, Boston Pharmaceuticals, and Zumutor, outside the submitted work; and patents “Methods for Treating MICA-Related Disorders” (no. 20100111973), with royalties paid; “Tumor Antigens and Uses Thereof (no. 7250291), issued; “Angiopoiten-2 Biomarkers Predictive of Anti-immune Checkpoint Response” (no. 20170248603), pending; “Copositions and Methods for Identification, Assessment, Prevention, and Treatment of Melanoma Using PD-L1 Isoforms” (no. 20160340407), pending; “Therapeutic Peptides” (no. 20160046716), pending; “Therapeutic Peptides” (no. 20140004112), pending; “Therapeutic Peptides” (no. 20170022275), pending; “Therapeutic Peptides” (no. 20170008962), pending; “Therapeutic Peptides” (no. 9402905), issued; “Methods of Using Pembrolizumab and Trebananib” (no. 2019028012), pending; “Vaccine Compositions and Methods for Restoring NKG2D Pathway Function against Cancers” (no. 10279021), issued; and “Antibodies that Bind to MHC class I Polypeptide-Related Sequence A” (no. US10106611), issued. S.J.R. has received research support from Bristol-Myers Squibb, Merck, Affimed, and KITE/Gilead, and has been a member of the Science Advisory Boards for KITE/Gilead and Immunitas. The remaining authors declare no competing financial interests.
Correspondence: Scott J. Rodig, Department of Pathology, Brigham and Women’s Hospital, Boston, MA 02115; e-mail: srodig@bwh.harvard.edu.

This feature is available to Subscribers Only
Sign In or Create an Account Close Modal