

Key Points
Hyperinflammation-associated JAK/STAT pathway signaling decreases the apoptotic potential of immune cells in response to glucocorticoids.
JAK/STAT pathway inhibition sensitizes immune cells to glucocorticoid-induced apoptosis in vitro and dampens hyperinflammation in vivo.

Abstract
Cytokine storm syndromes (CSS) are severe hyperinflammatory conditions characterized by excessive immune system activation leading to organ damage and death. Hemophagocytic lymphohistiocytosis (HLH), a disease often associated with inherited defects in cell-mediated cytotoxicity, serves as a prototypical CSS for which the 5-year survival is only 60%. Frontline therapy for HLH consists of the glucocorticoid dexamethasone (DEX) and the chemotherapeutic agent etoposide. Many patients, however, are refractory to this treatment or relapse after an initial response. Notably, many cytokines that are elevated in HLH activate the JAK/STAT pathway, and the JAK1/2 inhibitor ruxolitinib (RUX) has shown efficacy in murine HLH models and humans with refractory disease. We recently reported that cytokine-induced JAK/STAT signaling mediates DEX resistance in T cell acute lymphoblastic leukemia (T-ALL) cells, and that this could be effectively reversed by RUX. On the basis of these findings, we hypothesized that cytokine-mediated JAK/STAT signaling might similarly contribute to DEX resistance in HLH, and that RUX treatment would overcome this phenomenon. Using ex vivo assays, a murine model of HLH, and primary patient samples, we demonstrate that the hypercytokinemia of HLH reduces the apoptotic potential of CD8 T cells leading to relative DEX resistance. Upon exposure to RUX, this apoptotic potential is restored, thereby sensitizing CD8 T cells to DEX-induced apoptosis in vitro and significantly reducing tissue immunopathology and HLH disease manifestations in vivo. Our findings provide rationale for combining DEX and RUX to enhance the lymphotoxic effects of DEX and thus improve the outcomes for patients with HLH and related CSS.
Introduction
Cytokine storm syndromes (CSS) are characterized by rampant and often fatal systemic hyperinflammation. CSS arise in response to infectious or noninfectious etiologies, including rheumatologic diseases, malignancies, and inherited genetic defects in immune cell function. Regardless of etiology, CSS are associated with an uncontrolled immune response that leads to excessive activation of immune cells; the immune cells infiltrate tissues and secrete proinflammatory cytokines that further drive immune cell activation, leading to tissue damage and death.1,2
The pathophysiology of CSS is perhaps best understood in the context of familial hemophagocytic lymphohistiocytosis (fHLH), an inherited disorder caused by loss-of-function mutations in genes involved in immune cell cytotoxicity, including Perforin 1 (PRF1). PRF1 encodes the pore-forming protein perforin, which is required for target cell destruction.3 Prf1−/− mice infected with lymphocytic choriomeningitis virus (LCMV) develop a fatal CSS typified by splenomegaly, trilineage cytopenias, hyperferritinemia, and severe tissue inflammation, thereby recapitulating many of the key features of human fHLH.4 This model has advanced our understanding of CSS and has facilitated the investigation of novel therapeutic agents. Interestingly, the selective depletion of CD8 T cells ameliorates disease in this model, implicating these cells as critical drivers of disease pathogenesis.4
Because of the integral role for CD8 T cells in CSS, treatment focuses on the use of lymphotoxic therapies, including glucocorticoids (GCs).5 GCs mediate their cytotoxic effects by activating the GC receptor (GR), a transcriptional enhancer that activates a proapoptotic program.6 In HLH, the GC dexamethasone (DEX) is used a central component of frontline therapy in conjunction with the chemotherapeutic agent etoposide.7 However, in over 30% of cases, HLH is refractory to frontline therapy or relapses after an initial response, resulting in poor clinical outcomes.8 It has recently been demonstrated that T cells may become resistant to DEX under certain physiologic and pathophysiologic conditions.9-12 Toward this end, we and others recently demonstrated that exposing T cell acute lymphoblastic leukemia (T-ALL) cells to cytokines, such as interleukin (IL)–2, IL-4, and IL-7, induces DEX resistance by modulating the intrinsic apoptotic pathway to promote a prosurvival state.10,12-14 Furthermore, these cytokines signal via the JAK/STAT pathway, and we demonstrated that targeting this pathway with the JAK1/2 inhibitor ruxolitinib (RUX) restores the sensitivity of T-ALL cells to DEX-induced apoptosis.12,14
On the basis of these findings, we hypothesized that hypercytokinemia may mediate DEX resistance in primary CD8 T cells in patients with HLH and other CSS, thereby contributing to poor responses to therapy. In this study, we establish that STAT5 activation downstream of IL-12 and the common γ-chain cytokines confers DEX resistance in murine CD8 T cells. Subsequently, we demonstrate both ex vivo and in vivo that RUX restores DEX sensitivity by priming CD8 T cells for apoptosis. Finally, we show that the cytokine composition in plasma samples from patients with active HLH confers DEX resistance in CD8 T cells, providing further evidence for a state of relative DEX resistance. Together, these data demonstrate a role for hypercytokinemia as a mediator of DEX resistance and provide rationale for using RUX to augment the efficacy of DEX in patients with HLH and related CSS.
Materials and methods
Patient samples
Pretreatment plasma samples were obtained from pediatric patients with HLH at Texas Children’s Hospital, and control plasma was obtained from pediatric patients who were treated for noninflammatory conditions. Written informed consent was obtained from patients or their guardians at the time of sample collection, and studies were performed according to protocols approved by the Institutional Review Board of Baylor College of Medicine.
Mice
Perforin-deficient (C57BL/6 Prf1tm1Sdz/J) and WT (C57BL/6-J) mice were purchased from Jackson Laboratory and maintained in specific pathogen-free facilities at St. Jude Children’s Research Hospital or the University of California, San Francisco. Animals were age and sex matched and were used at 6 to 12 weeks. Animal experiments were approved by the Institutional Animal Care and Use Committees of St. Jude Children’s Research Hospital or the University of California, San Francisco.
Primary HLH model
LCMV-Armstrong was originally provided by John Wherry (University of Pennsylvania). Prf1−/− mice were intraperitoneally (i.p.) injected with 2 × 10⁵ plaque-forming units of LCMV. Beginning on day 4 postinjection, mice were treated with vehicle control (phosphate-buffered saline), DEX, RUX, or the combination of DEX and RUX. DEX was administered at 1.5 mg/kg/d i.p., with the exception of supplemental Figure 2B (available on the Blood Web site), where DEX was administered ad lib in drinking water containing 7.5 µg/mL of DEX. RUX was administered ad lib in modified rodent chow (Incyte) at a dose of ∼60 mg/kg/d. We have previously demonstrated that a dose of 90 mg/kg twice daily by oral gavage results in a peak serum level of 3 to 4 µM,15 which is comparable to the level achieved using a 25-mg dose in humans (Ross Levine; unpublished observation, May 2015). For most experiments, treatment continued through day 8 postinfection, and animals were euthanized for analysis the following morning. For the survival study, treatment extended from day 7 to 17, and mice were euthanized when moribund or at the termination of the study. For analysis of STAT5 phosphorylation (pSTAT5) in CD8 T cells following in vivo drug treatment, mice received 1 dose of 1.5 mg/kg of DEX, 60 mg/kg of RUX, or both i.p. on day 4 postinfection, and animals were euthanized 12 hours later.
T cell activation and expansion
For isolation of human CD8 T cells, peripheral blood mononuclear cells (PBMCs) were obtained from blood samples from healthy donors from the Vitalant blood bank in San Francisco. Murine CD8 T cells were isolated from the spleens of naïve WT or Prf1−/− C57BL/6 mice. The methods used for T cell isolation are described in detail in the supplemental Methods.
Flow cytometry
Murine splenocytes were stained with the fluorescently-labeled antibodies listed in supplemental Table 1. All flow cytometry data were acquired with a BD LSRII Fortessa or a BD FACSVerse and analyzed using FlowJo software.
Measurement of STAT protein phosphorylation was performed as previously described.12 Briefly, human or murine CD8 T cells were rested for 1 hour in serum-free medium and stimulated with cytokines (Peprotech) at 100 ng/mL for 15 minutes unless otherwise indicated, fixed with 2% paraformaldehyde, and permeabilized with methanol. For analysis of pSTAT5 in CD8 T cells from vehicle- and drug-treated mice, cells were immediately fixed and permeabilized following harvesting. STAT protein staining was performed with the antibodies listed in supplemental Table 1, and data were recorded as the median fluorescence intensity (MFI).
For the analysis of B-cell lymphoma-2 (BCL-2), B-cell lymphoma extra large (BCL-xL), and induced myeloid leukemia cell differentiation (MCL-1) protein expression, murine CD8 T cells were fixed and permeabilized and stained with the antibodies listed in supplemental Table 1. Data were recorded as the MFI in the cleaved caspase 3-negative gate.
T cell viability assays
Human CD8 T cells were cultured in plasma from control individuals or HLH patients supplemented with RPMI 1640 Amino Acids Solution (Sigma-Aldrich), RPMI 1640 Vitamins Solution (Sigma-Aldrich), and D-(+)-Glucose Solution (Sigma-Aldrich). Murine CD8 T cells were cultured in complete Dulbecco’s modified Eagle medium. Cells were treated with vehicle control (dimethyl sulfoxide [DMSO]), DEX (Sigma-Aldrich), and/or RUX (Selleck Chemicals) with or without supplementation with recombinant cytokines for 48 hours for human T cells and 24 hours for murine T cells. To assess viability, cells were stained with Hoechst 33258 (Molecular Probes) and analyzed by flow cytometry. Data were recorded as the percentage of Hoechst-negative cells, and data were normalized to vehicle control.
Complete blood counts (CBCs), histology, and plasma protein quantification
CBCs and histology were performed by the veterinary pathology core facility at St. Jude Children’s Research Hospital. For CBCs, heparinized blood samples were analyzed on a Forecyte multi-species hematology system (Oxford Science). Detailed histology methods are provided in the supplemental Methods, and the antibodies are listed in supplemental Table 1.
Plasma protein quantification from human plasma was performed using Milliplex MAP antibody panels (Millipore) for the MagPix instrument. The concentration of each analyte was measured by comparing to protein standards. For mouse serum, a Milliplex mouse cytokine/chemokine magnetic bead panel (EMD Millipore) was used according to the manufacturer’s instructions, and results were collected and analyzed with BIO-Plex 200 System (Bio-Rad) and xPONENT software. Ferritin and soluble CD25 (sCD25) were measured with ELISA kits (ALPCO and R&D Systems).
Western blotting
To assess localization of STAT5 and GR, murine CD8 T cells were pretreated with vehicle control (DMSO) or 10 ng/mL of IL-2 for 1 hour prior to treatment with vehicle control or 1 µM DEX for 30 minutes. Cytoplasmic and nuclear protein lysates were generated using the NE-PER kit (ThermoFisher). Immunoblotting was performed with the antibodies listed in supplemental Table 1. Donkey antirabbit IRDye800 and donkey antimouse IRDye680 secondary antibodies (LI-COR Biosciences) were used for detection, and imaging was performed using the Odyssey Imaging System (LI-COR Biosciences). Protein bands were quantified using ImageStudioLite software and the quantification is presented as the ratio of arbitrary units for total or phosphorylated STAT5 or GR relative to the appropriate cytoplasmic or nuclear loading control.
Quantitative polymerase chain reaction (qPCR)
For GR target gene expression, murine CD8 T cells were pretreated with vehicle control (DMSO) or 10 ng/mL of IL-2 for 1 hour prior to exposure to vehicle or 1 µM DEX for 4 hours. RNA was isolated using a RNeasy Mini Kit (Qiagen), and cDNA was generated using a Superscript III kit (ThermoFisher). Taqman qPCR probes (Applied Biosystems) were used in conjunction with Taqman Master Mix (Applied Biosystems). Experiments were performed in technical triplicate and run on a QuantStudio 5 Real-Time PCR Instrument (Applied Biosystems). The fold change in transcript expression was calculated relative to cells cultured without DEX using the delta-delta Ct method, with Gapdh transcript for normalization.
BH3 profiling
BH3 profiling was performed as previously described.16 Briefly, murine CD8 T cells were cultured in the presence or absence of 10 ng/mL of IL-2, 1 µM DEX, and 500 nM RUX for 16 hours prior to analysis and then stained with LIVE/DEAD Fixable Violet Dead Cell Stain (Life Technologies). For analysis of apoptotic potential following in vivo treatment, analysis was performed immediately after harvesting cells from mice. Cells were permeabilized with digitonin (Sigma-Aldrich) and exposed to ABT-199 (ApexBio), WEHI-539 (ApexBio), S63845 (Selleck Chemicals), or phorbol-12-myristate-13-acetate-induced protein 1 (NOXA) peptide (New England Peptide) at the indicated concentrations for 90 minutes prior to fixation with paraformaldehyde. Cells were stained with an anticytochrome c antibody (supplemental Table 1) and analyzed by flow cytometry. Cells exposed to alamethicin (Alfa Aesar) or DMSO were used as positive and negative controls and percent priming was calculated on the basis of the relative cytochrome c release in cells exposed to BH3 mimetics or NOXA peptide relative to these controls.
Statistical analyses
Statistical analyses were performed using Prism 8 (GraphPad). All tests were 2-sided, with a significance threshold of P ≤ .05. Comparisons between groups were made using Student t tests, with 1-way ANOVA and Tukey’s method for multiple comparisons adjustment for comparisons of 3 or more groups. For in vivo survival analysis, the log-rank test was used to perform pairwise comparisons between curves. Interactions between drugs were assessed using Bliss independence analysis.17 Standard error of the mean is plotted. Outliers were removed using 1-way ANOVA with Grubb’s test. All experiments were performed on a minimum of 4 biological replicates, and when indicated, data are presented as the combined analysis from 2 independent experiments.
Results
STAT5-activating cytokines confer DEX resistance in CD8 T cells
In light of our recent finding that cytokine-mediated JAK/STAT signaling confers DEX resistance in T-ALL cells,12,14 we hypothesized that the high levels of cytokines in HLH may similarly drive DEX resistance. To test this, we measured levels of cytokines in plasma from patients with active HLH and compared them to those of controls. Consistent with previous reports,18,19 we found that cytokines from many cytokine families, including interferon (IFN)–γ and its downstream effector CXCL9, were elevated in at least a subset of the HLH samples, with CXCL9, tumor necrosis factor (TNF)–α, and IL-6 demonstrating statistically significant elevations (Figure 1A). Additionally, we observed significant elevations in sCD25 (Figure 1A), a component of the IL-2 receptor that serves as a marker of T cell activation and the local production and consumption of IL-2.20 To determine whether any of these cytokines mediate DEX resistance in CD8 T cells, we isolated and activated murine CD8 T cells and exposed them to DEX in the presence or absence of cytokines. We observed that IL-2, a common γ-chain cytokine, and IL-12 conferred DEX resistance, whereas TNF-α, IFN-γ, IL-6, IL-1β, and IL-10 did not (Figure 1B). Furthermore, the effects of IL-2 and IL-12 on drug sensitivity were specific to DEX, because we did not detect any IL-2– or IL-12–induced resistance to etoposide (Figure 1B). Consistent with our previous finding that STAT5 activation is required for cytokine-mediated DEX resistance,14 IL-2 and IL-12 significantly increased pSTAT5 in murine CD8 T cells, whereas IL-6 and IFN-γ, 2 cytokines that are elevated in HLH yet failed to confer DEX resistance, did not activate STAT5 in the same manner (Figure 1C; supplemental Figure 1A).
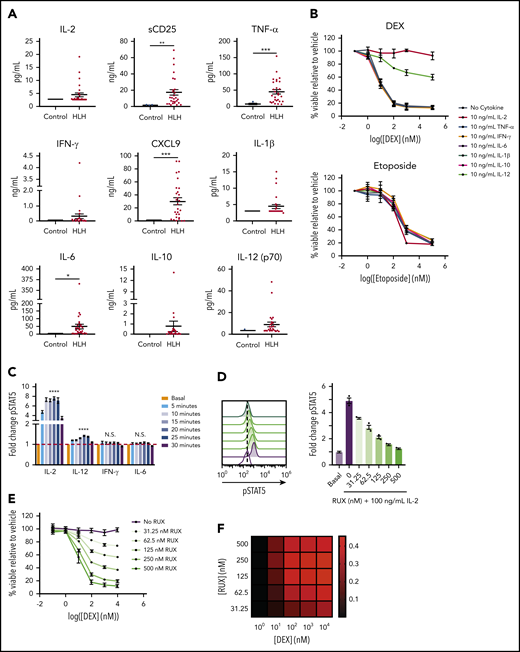
STAT5-activating cytokines confer DEX resistance in CD8 T cells. (A) Levels of HLH-associated plasma proteins in plasma from control patients versus patients with HLH. (B) Viability relative to vehicle control of murine CD8 T cells treated with increasing concentrations of DEX or etoposide in the absence or presence of 10 ng/mL of the indicated cytokine for 24 hours in technical triplicate. (C) Fold change in the MFI of pSTAT5 in murine CD8 T cells stimulated with 100 ng/mL of the indicated cytokine for the indicated period of time in technical triplicate. Statistical significance is indicated for the difference between the basal condition and the peak pSTAT5 value for each cytokine. (D) Fold change and the representative histograms of pSTAT5 in murine CD8 T cells in the basal condition or after 1 hour of pretreatment with the indicated concentration of RUX followed by a 15-minute stimulation with 100 ng/mL of IL-2 in technical triplicate. Statistical significance is relative to the vehicle-treated IL-2-stimulated condition. (E) Viability relative to vehicle control of murine CD8 T cells treated with increasing concentrations of DEX in the presence of 10 ng/mL of IL-2 and the indicated concentration of RUX for 24 hours in technical triplicate. (F) Heatmap of Bliss independence scores calculated as the average of technical triplicates of cell viability in murine CD8 T cells treated with the indicated concentrations of DEX and RUX in the presence of 10 ng/mL of IL-2 for 24 hours. Positive values, indicated in red, are indicative of a synergistic interaction. Statistical significance was assessed using 2-sample Student t tests (A and C) or 1-way ANOVA with Tukey’s method for multiple comparisons adjustment (D). All data are representative of 3 independent experiments. ****P < .0001; ***P < .001; **P < .01; *P < .05. N.S., not significant.
STAT5-activating cytokines confer DEX resistance in CD8 T cells. (A) Levels of HLH-associated plasma proteins in plasma from control patients versus patients with HLH. (B) Viability relative to vehicle control of murine CD8 T cells treated with increasing concentrations of DEX or etoposide in the absence or presence of 10 ng/mL of the indicated cytokine for 24 hours in technical triplicate. (C) Fold change in the MFI of pSTAT5 in murine CD8 T cells stimulated with 100 ng/mL of the indicated cytokine for the indicated period of time in technical triplicate. Statistical significance is indicated for the difference between the basal condition and the peak pSTAT5 value for each cytokine. (D) Fold change and the representative histograms of pSTAT5 in murine CD8 T cells in the basal condition or after 1 hour of pretreatment with the indicated concentration of RUX followed by a 15-minute stimulation with 100 ng/mL of IL-2 in technical triplicate. Statistical significance is relative to the vehicle-treated IL-2-stimulated condition. (E) Viability relative to vehicle control of murine CD8 T cells treated with increasing concentrations of DEX in the presence of 10 ng/mL of IL-2 and the indicated concentration of RUX for 24 hours in technical triplicate. (F) Heatmap of Bliss independence scores calculated as the average of technical triplicates of cell viability in murine CD8 T cells treated with the indicated concentrations of DEX and RUX in the presence of 10 ng/mL of IL-2 for 24 hours. Positive values, indicated in red, are indicative of a synergistic interaction. Statistical significance was assessed using 2-sample Student t tests (A and C) or 1-way ANOVA with Tukey’s method for multiple comparisons adjustment (D). All data are representative of 3 independent experiments. ****P < .0001; ***P < .001; **P < .01; *P < .05. N.S., not significant.
Because of the DEX resistance observed with IL-2, we used IL-2 in subsequent mechanistic experiments. We found that IL-2 induced DEX resistance in a dose-dependent manner (supplemental Figure 1B). Consistent with reports that STAT5 is the predominant effector of IL-2 receptor (IL-2R) signaling,21 we observed no increase in pSTAT1 or pSTAT3 upon IL-2 exposure (supplemental Figure 1C). To confirm that this DEX resistance is mediated specifically by JAK/STAT pathway activation, we used the JAK1/2 inhibitor, RUX, and found that RUX abrogated the cytokine-induced increase in pSTAT5 (Figure 1D) and synergized with DEX to induce cell death (Figure 1E-F). These observations reveal that IL-2 and IL-12, cytokines that activate STAT5 in CD8 T cells, result in resistance to DEX-induced apoptosis. Furthermore, this resistance can be overcome upon concomitant treatment with RUX.
IL-2 inhibits DEX-induced apoptosis in CD8 T cells by altering cellular apoptotic potential
To understand how IL-2 mediates DEX resistance, we asked whether IL-2 interferes with GR signaling. Following DEX exposure, total and S211 phosphorylated GR colocalized to the nucleus with pSTAT5, regardless of IL-2 exposure (Figure 2A). Similarly, IL-2R signaling did not interfere with upregulation of GR target genes, including Bcl2l11, Gilz, and Fkbp5 (Figure 2B). These data indicate that GR signaling remains intact in the presence of IL-2.
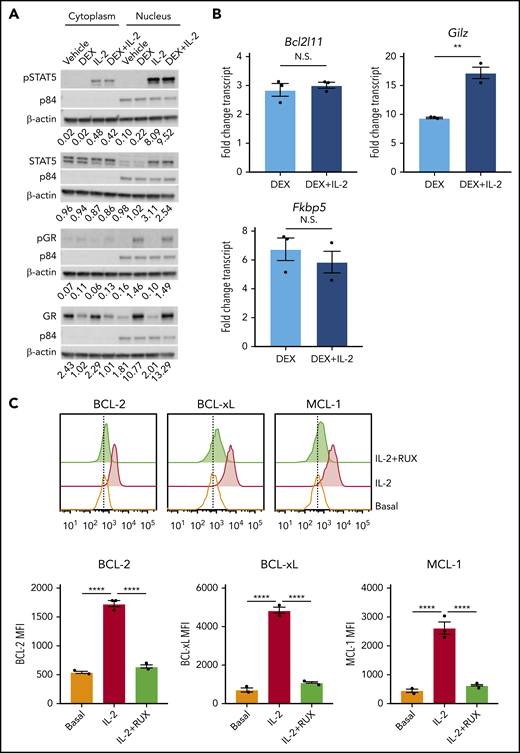
IL-2 upregulates antiapoptotic proteins. (A) Western blot of cytoplasmic and nuclear total and phosphorylated STAT5 and GR in murine CD8 T cells pretreated or not with 10 ng/mL of IL-2 followed by treatment with vehicle control or 1 µM DEX for 30 minutes. β-actin is used as a cytoplasmic loading control and p84 is used as a nuclear loading control. The numbers below each panel of images represent the ratio between total or phosphorylated STAT5 or GR and the relevant cytoplasmic or nuclear loading control obtained via image quantification. (B) Fold change in transcript expression of the direct GR target genes Bcl2l11, Gilz, and Fkbp5 in murine CD8 T cells pretreated or not with 10 ng/mL of IL-2 for 1 hour followed by treatment with vehicle control or 1 µM DEX for 4 hours in technical triplicate. Fold change values are relative to untreated or IL-2–treated cells, respectively. (C) MFIs and representative histograms of BCL-2, BCL-xL, and MCL-1 protein expression in murine CD8 T cells in the basal state or following exposure to 10 ng/mL of IL-2 with or without 500 nM RUX for 24 hours in technical triplicate. Statistical significance was assessed using 2-sample Student t tests (B) or 1-way ANOVA with Tukey’s method for multiple comparisons adjustment (C). All data are representative of 3 independent experiments. ****P < .0001; ***P < .001; **P < .01; *P < .05.
IL-2 upregulates antiapoptotic proteins. (A) Western blot of cytoplasmic and nuclear total and phosphorylated STAT5 and GR in murine CD8 T cells pretreated or not with 10 ng/mL of IL-2 followed by treatment with vehicle control or 1 µM DEX for 30 minutes. β-actin is used as a cytoplasmic loading control and p84 is used as a nuclear loading control. The numbers below each panel of images represent the ratio between total or phosphorylated STAT5 or GR and the relevant cytoplasmic or nuclear loading control obtained via image quantification. (B) Fold change in transcript expression of the direct GR target genes Bcl2l11, Gilz, and Fkbp5 in murine CD8 T cells pretreated or not with 10 ng/mL of IL-2 for 1 hour followed by treatment with vehicle control or 1 µM DEX for 4 hours in technical triplicate. Fold change values are relative to untreated or IL-2–treated cells, respectively. (C) MFIs and representative histograms of BCL-2, BCL-xL, and MCL-1 protein expression in murine CD8 T cells in the basal state or following exposure to 10 ng/mL of IL-2 with or without 500 nM RUX for 24 hours in technical triplicate. Statistical significance was assessed using 2-sample Student t tests (B) or 1-way ANOVA with Tukey’s method for multiple comparisons adjustment (C). All data are representative of 3 independent experiments. ****P < .0001; ***P < .001; **P < .01; *P < .05.
DEX has well-established effects on the intrinsic apoptotic pathway in lymphocytes,22,23 and STAT5 directly regulates antiapoptotic members of this pathway in T cells.24 Therefore, we hypothesized that IL-2R signaling may alter the apoptotic potential of CD8 T cells, making them refractory to DEX. To test this, we measured expression of antiapoptotic BCL-2 family members, all of which are STAT5 target genes.24 Following IL-2 exposure, CD8 T cells upregulated BCL-2, BCL-xL, and MCL-1 proteins (Figure 2C), and RUX reduced expression to basal levels, confirming that these proteins are induced downstream of the IL-2R/JAK/STAT pathway (Figure 2C).
To determine the functional significance of these changes in protein expression, we used BH3 profiling to assess the apoptotic potential of CD8 T cells. Ex vivo, DEX alone induced a significant increase in apoptotic priming with respect to BCL-2, BCL-xL, and MCL-1 activity (Figure 3A-C, light blue bars). We found that the apoptotic potential of CD8 T cells was reduced in the presence of IL-2, such that DEX was no longer able to increase apoptotic priming (Figure 3A-C, red and dark blue bars). Exposure to RUX restored the basal apoptotic potential of CD8 T cells exposed to IL-2 (Figure 3A-C, green bars), and with the addition of RUX, DEX was again capable of increasing apoptotic priming (Figure 3A-C, purple bars).
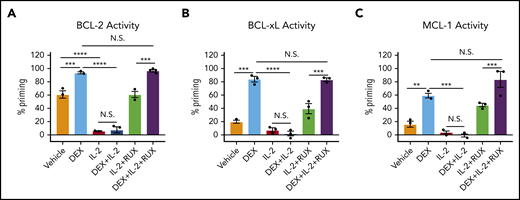
IL-2 exposure decreases the apoptotic potential of murine CD8 T cells and this apoptotic potential is restored upon RUX exposure. (A-C) Percent priming values generated from BH3 profiling of murine CD8 T cells treated ex vivo with or without 10 ng/mL of IL-2, 1 µM DEX, and/or 500 nM RUX for 16 hours in technical triplicate prior to BH3 profiling with 1 µM ABT-199 to measure BCL-2 activity (A), 10 µM WEHI-539 to measure BCL-xL activity (B), or 10 µM synthetic NOXA peptide to measure MCL-1 activity (C). Statistical significance was assessed using 1-way ANOVA with Tukey’s method for multiple comparisons adjustment. All data are representative of 3 independent experiments. ****P < .0001; ***P < .001; **P < .01; *P < .05.
IL-2 exposure decreases the apoptotic potential of murine CD8 T cells and this apoptotic potential is restored upon RUX exposure. (A-C) Percent priming values generated from BH3 profiling of murine CD8 T cells treated ex vivo with or without 10 ng/mL of IL-2, 1 µM DEX, and/or 500 nM RUX for 16 hours in technical triplicate prior to BH3 profiling with 1 µM ABT-199 to measure BCL-2 activity (A), 10 µM WEHI-539 to measure BCL-xL activity (B), or 10 µM synthetic NOXA peptide to measure MCL-1 activity (C). Statistical significance was assessed using 1-way ANOVA with Tukey’s method for multiple comparisons adjustment. All data are representative of 3 independent experiments. ****P < .0001; ***P < .001; **P < .01; *P < .05.
DEX and RUX function cooperatively to lessen hyperinflammation in a murine HLH model
We next sought to examine whether RUX augments DEX responses in vivo. For these studies, we employed the Prf1−/− mouse model, which closely recapitulates many features of human HLH (supplemental Figure 2A). Ex vivo, IL-2 conferred DEX resistance in CD8 T cells from both wild-type and Prf1−/− mice, confirming that the resistance phenotype is independent of an underlying genetic defect in cytotoxic function (supplemental Figure 2B). To facilitate in vivo treatment studies, we first determined that 1.5 mg/kg/d of DEX induces a modest amelioration of HLH manifestations without completely controlling disease (supplemental Figure 2C-E). We used this dose for subsequent combination experiments. Beginning on day 4 after LCMV infection, we treated mice with vehicle, DEX, or DEX in combination with RUX at a dose that mediated a measurable reduction in pSTAT5 (supplemental Figure 2F). Consistent with prior reports,15,25 all LCMV-infected vehicle-treated mice lost weight and died by 2 weeks postinfection (Figure 4A-B). Although LCMV-infected mice treated with DEX exhibited slightly longer survival, all animals eventually succumbed to disease. In contrast, LCMV-infected mice treated with RUX alone, or with DEX and RUX, survived for the entire 18-day course of these experiments (Figure 4A-B).
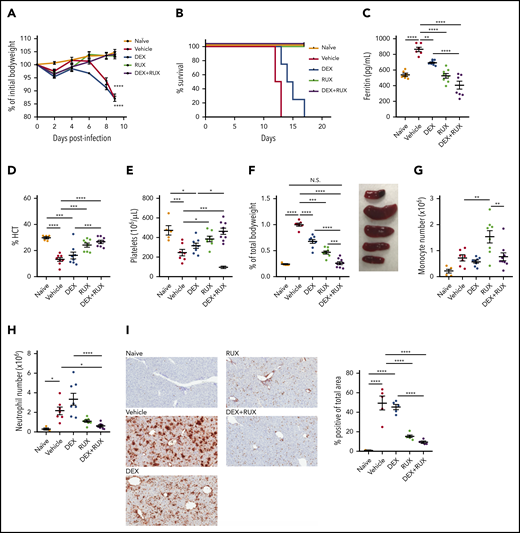
The combination of DEX and RUX cooperatively attenuates disease manifestations in an in vivo model of HLH. (A) Bodyweight over time relative to baseline bodyweight of naïve mice and vehicle- and drug-treated LCMV-infected mice. Statistical significance is relative to the naïve condition. (B) Survival of naïve mice and vehicle- and drug-treated LCMV-infected mice. (C) Plasma ferritin levels in naïve mice and vehicle- and drug-treated LCMV-infected mice on day 9 postinfection. (D) Hematocrit (HCT) values in naïve mice and vehicle- and drug-treated LCMV-infected mice on day 9 postinfection. (E) Platelet count in naïve mice and vehicle- and drug-treated LCMV-infected mice on day 9 postinfection. (F) Spleen weight as percentage of initial bodyweight and representative spleen images from naïve and vehicle- and drug-treated LCMV-infected mice on day 9 postinfection. (G) Number of monocytes in spleens from naïve and vehicle- and drug-treated LCMV-infected mice on day 9 postinfection. (H) Number of neutrophils in spleens from naïve and vehicle- and drug-treated LCMV-infected mice on day 9 postinfection. (I) Representative histologic images and percentage of total area staining positively for Ly6B.2 in livers from naïve and vehicle- and drug-treated LCMV-infected mice on day 9 postinfection. Statistical significance was assessed using 1-way ANOVA with Tukey’s method for multiple comparisons adjustment (A, C-I). With the exception of panels B and I, all data represent a combined analysis of 2 independent experiments. ****P < .0001; ***P < .001; **P < .01; *P < .05.
The combination of DEX and RUX cooperatively attenuates disease manifestations in an in vivo model of HLH. (A) Bodyweight over time relative to baseline bodyweight of naïve mice and vehicle- and drug-treated LCMV-infected mice. Statistical significance is relative to the naïve condition. (B) Survival of naïve mice and vehicle- and drug-treated LCMV-infected mice. (C) Plasma ferritin levels in naïve mice and vehicle- and drug-treated LCMV-infected mice on day 9 postinfection. (D) Hematocrit (HCT) values in naïve mice and vehicle- and drug-treated LCMV-infected mice on day 9 postinfection. (E) Platelet count in naïve mice and vehicle- and drug-treated LCMV-infected mice on day 9 postinfection. (F) Spleen weight as percentage of initial bodyweight and representative spleen images from naïve and vehicle- and drug-treated LCMV-infected mice on day 9 postinfection. (G) Number of monocytes in spleens from naïve and vehicle- and drug-treated LCMV-infected mice on day 9 postinfection. (H) Number of neutrophils in spleens from naïve and vehicle- and drug-treated LCMV-infected mice on day 9 postinfection. (I) Representative histologic images and percentage of total area staining positively for Ly6B.2 in livers from naïve and vehicle- and drug-treated LCMV-infected mice on day 9 postinfection. Statistical significance was assessed using 1-way ANOVA with Tukey’s method for multiple comparisons adjustment (A, C-I). With the exception of panels B and I, all data represent a combined analysis of 2 independent experiments. ****P < .0001; ***P < .001; **P < .01; *P < .05.
Next, naïve, vehicle-, and drug-treated LCMV-infected animals were examined for hyperferritinemia, anemia, thrombocytopenia, and organomegaly following drug treatment. We have previously shown that RUX has potent single-agent efficacy in this model of HLH,15 and we observed similar results here. Specifically, RUX alone significantly reduced serum ferritin levels and improved hematocrit and platelet values, but when compared with single agent DEX or RUX, combination treatment further lessened these disease manifestations (Figure 4C-E). LCMV-infected Prf1−/− mice develop severe splenomegaly, and although single agent DEX or RUX produced modest reductions in spleen size, only combination treatment resulted in spleen sizes similar to those of naïve mice (Figure 4F). With regard to innate immune cells, neither drug reduced splenic monocytes (Figure 4G; supplemental Figure 3A); however, RUX reduced numbers of splenic neutrophils, and this effect tended to be enhanced upon combination with DEX (Figure 4H; supplemental Figure 3B). Concordantly, the area of liver tissue infiltrated by neutrophils was also significantly reduced following combination treatment (Figure 4I).
The combination of DEX and RUX targets activated CD8 T cells, critical effectors of HLH
We next analyzed the T cell compartment in vehicle- and drug-treated mice. Splenic CD8 T cells were significantly reduced in treated mice, and most significantly with the combination of DEX and RUX (Figure 5A; supplemental Figure 3C). There was also a significant reduction in CD8 T cell infiltration of the liver in the mice receiving DEX and RUX (Figure 5B). With respect to effector-like CD8 T cells, combination treatment reduced the number of CD44 high, CD62L low CD8 T cells to nearly half those of vehicle-treated mice, whereas neither agent alone produced such a dramatic effect (Figure 5C). Similarly, combination treatment exerted the greatest effects on the numbers of CD8 T cells expressing the costimulatory molecules CD28 and inducible T cell costimulator (ICOS; Figure 5D) or the IL-2 receptor CD25 (Figure 5E). Animals treated with DEX and RUX also exhibited the lowest levels of soluble CD25 in the serum (Figure 5E-F).

The combination of DEX and RUX cooperatively attenuates CD8 T cell number and markers of CD8 T cell activation in an in vivo model of HLH. (A) Number of splenic CD8 T cells in naïve and vehicle- and drug-treated LCMV-infected mice on day 9 postinfection. (B) Representative histologic images and percentage of total area staining positively for CD3 in livers from naïve and vehicle- and drug-treated LCMV-infected mice on day 9 postinfection. (C) Number of CD44 high/CD62L low cells in spleens from naïve and vehicle- and drug-treated LCMV-infected mice on day 9 postinfection. (D) Number of CD28 and ICOS double-positive cells in spleens from naïve and vehicle- and drug-treated LCMV-infected mice on day 9 postinfection. (E) Number of CD25-positive CD8 T cells in spleens from naïve and vehicle- and drug-treated LCMV-infected mice on day 9 postinfection. (F) Levels of soluble CD25 in plasma from naïve and vehicle- and drug-treated LCMV-infected mice on day 9 postinfection. Statistical significance was assessed using 1-way ANOVA with Tukey’s method for multiple comparisons adjustment (A-F). The data in panels A and F represent a combined analysis of 2 independent experiments. ****P < .0001; ***P < .001; **P < .01; *P < .05.
The combination of DEX and RUX cooperatively attenuates CD8 T cell number and markers of CD8 T cell activation in an in vivo model of HLH. (A) Number of splenic CD8 T cells in naïve and vehicle- and drug-treated LCMV-infected mice on day 9 postinfection. (B) Representative histologic images and percentage of total area staining positively for CD3 in livers from naïve and vehicle- and drug-treated LCMV-infected mice on day 9 postinfection. (C) Number of CD44 high/CD62L low cells in spleens from naïve and vehicle- and drug-treated LCMV-infected mice on day 9 postinfection. (D) Number of CD28 and ICOS double-positive cells in spleens from naïve and vehicle- and drug-treated LCMV-infected mice on day 9 postinfection. (E) Number of CD25-positive CD8 T cells in spleens from naïve and vehicle- and drug-treated LCMV-infected mice on day 9 postinfection. (F) Levels of soluble CD25 in plasma from naïve and vehicle- and drug-treated LCMV-infected mice on day 9 postinfection. Statistical significance was assessed using 1-way ANOVA with Tukey’s method for multiple comparisons adjustment (A-F). The data in panels A and F represent a combined analysis of 2 independent experiments. ****P < .0001; ***P < .001; **P < .01; *P < .05.
To assess cellular apoptotic potential, we then performed BH3 profiling on CD8 T cells from naïve and vehicle- and drug-treated Prf1−/− mice on day 9 following LCMV infection. In keeping with our ex vivo findings, cells from vehicle-treated LCMV-infected mice had reduced apoptotic potential relative to naïve mice (Figure 6A-C, red bars). DEX alone was insufficient to significantly increase the apoptotic potential, but combined treatment with RUX effectively restored this potential (Figure 6A-C). These results support a model in which the hypercytokinemia in HLH upregulates expression of antiapoptotic proteins in CD8 T cells that then protect cells from DEX-induced apoptosis. This is inhibited by the JAK1/2 inhibitor RUX, which resensitizes CD8 T cells to apoptosis and synergizes with DEX to effect cell death in vitro and dampen CD8 T cell-mediated immunopathology in vivo.

LCMV-induced hyperinflammation decreases the apoptotic potential of CD8 T cells in Prf1−/−mice and this apoptotic potential is restored upon treatment with RUX. (A-C) Percent priming values generated from BH3 profiling of murine CD8 T cells harvested on day 9 postinfection from naïve or vehicle- or drug-treated LCMV-infected mice prior to BH3 profiling with 10 µM ABT-199 to measure BCL-2 activity (A), 10 µM WEHI-539 to measure BCL-xL activity (B), or 10 µM S63845 to measure MCL-1 activity (C). Statistical significance was assessed using 1-way ANOVA with Tukey’s method for multiple comparisons adjustment. ****P < .0001; ***P < .001; **P < .01; *P < .05.
LCMV-induced hyperinflammation decreases the apoptotic potential of CD8 T cells in Prf1−/−mice and this apoptotic potential is restored upon treatment with RUX. (A-C) Percent priming values generated from BH3 profiling of murine CD8 T cells harvested on day 9 postinfection from naïve or vehicle- or drug-treated LCMV-infected mice prior to BH3 profiling with 10 µM ABT-199 to measure BCL-2 activity (A), 10 µM WEHI-539 to measure BCL-xL activity (B), or 10 µM S63845 to measure MCL-1 activity (C). Statistical significance was assessed using 1-way ANOVA with Tukey’s method for multiple comparisons adjustment. ****P < .0001; ***P < .001; **P < .01; *P < .05.
The cytokines in plasma from patients with HLH confer DEX resistance in human CD8 T cells
Finally, we asked whether STAT5-activating cytokines confer DEX resistance in human CD8 T cells, and we expanded our analysis to include the entire common γ-chain cytokine family. Toward this end, we observed that, in addition to IL-2 (Figure 1A), IL-4, IL-7, IL-9, and IL-15 were elevated in at least a subset of HLH plasma samples, though only IL-7 and IL-15 reached statistical significance when compared across the entire cohort (Figure 7A). We next exposed human CD8 T cells to DEX in the presence or absence of individual recombinant cytokines to determine whether any of them independently confer DEX resistance. Although each resulted in increased DEX resistance, IL-2, IL-7, and IL-15 exerted the greatest effects (Figure 7B). Notably, the extent to which each cytokine conferred DEX resistance was directly proportional to the level of pSTAT5 (Figure 7C), consistent with findings that STAT5 activation mediates cytokine-induced DEX resistance.14 To determine whether the cytokine composition of plasma from patients with HLH is sufficient to confer DEX resistance in humans, we exposed primary human CD8 T cells to plasma from control or HLH patients and assessed viability following treatment with DEX. Strikingly, cells exposed to nearly all HLH plasma samples exhibited DEX resistance, whereas cells cultured in the presence of control plasma did not (Figure 7D). Overall, these data demonstrate that the plasma from patients with active HLH directly confers DEX resistance in CD8 T cells.
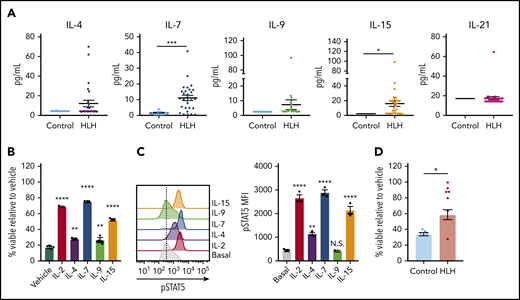
The cytokine composition of plasma from patients with HLH confers DEX resistance in CD8 T cells. (A) Levels of common γ-chain cytokines in plasma from control patients versus patients with HLH. (B) Viability relative to vehicle control of human CD8 T cells following exposure to 1 µM DEX for 48 hours in the presence or absence of 10 ng/mL of the indicated cytokine in technical triplicate. Statistical significance is relative to the vehicle condition. (C) MFI and representative histograms of pSTAT5 in human CD8 T cells following stimulation with 100 ng/mL of the indicated cytokine for 15 minutes in technical triplicate. Statistical significance is relative to the basal condition. (D) Viability relative to vehicle control in human CD8 T cells cultured in plasma from control patients or patients with HLH and treated with 1 µM DEX for 48 hours. Statistical significance was assessed using 2-sample Student t tests (A and D) or 1-way ANOVA with Tukey’s method for multiple comparisons adjustment (B and C). The data in panels B and C are representative of 3 independent experiments. ****P < .0001; ***P < .001; **P < .01; *P < .05.
The cytokine composition of plasma from patients with HLH confers DEX resistance in CD8 T cells. (A) Levels of common γ-chain cytokines in plasma from control patients versus patients with HLH. (B) Viability relative to vehicle control of human CD8 T cells following exposure to 1 µM DEX for 48 hours in the presence or absence of 10 ng/mL of the indicated cytokine in technical triplicate. Statistical significance is relative to the vehicle condition. (C) MFI and representative histograms of pSTAT5 in human CD8 T cells following stimulation with 100 ng/mL of the indicated cytokine for 15 minutes in technical triplicate. Statistical significance is relative to the basal condition. (D) Viability relative to vehicle control in human CD8 T cells cultured in plasma from control patients or patients with HLH and treated with 1 µM DEX for 48 hours. Statistical significance was assessed using 2-sample Student t tests (A and D) or 1-way ANOVA with Tukey’s method for multiple comparisons adjustment (B and C). The data in panels B and C are representative of 3 independent experiments. ****P < .0001; ***P < .001; **P < .01; *P < .05.
Discussion
The etiology of CSS is diverse, including primary immune deficiencies, infections, autoimmune conditions, malignancies, and iatrogenic causes. GCs are used to treat CSS because of their potent anti-inflammatory activity; however, many patients do not respond and ultimately die of their disease. This underscores the need for an improved understanding of the mechanisms of GC resistance and for novel therapeutic strategies to enhance the efficacy of GCs in CSS. Here, we have used ex vivo assays, a murine model of fHLH, and primary samples from patients with HLH to elucidate 1 mechanism by which GCs may inadequately control hyperinflammation, potentially contributing to poor clinical outcomes in fHLH and other CSS. Specifically, we demonstrate that JAK/STAT5 signaling induces a prosurvival state that antagonizes DEX-induced apoptosis. We show that this is overcome with the JAK1/2 inhibitor RUX, providing evidence supporting a combinatorial therapeutic strategy to augment the efficacy of DEX in hyperinflammation.
These studies focus on CD8 T cells, which are known to be important drivers of CSS arising from multiple etiologies.2 CD8 T cells are critical effectors of immune responses and immune homeostasis, because they directly target infected or malignant cells as well as the antigen-presenting cells and other T cells themselves through the process of fratricide.26 Consistent with this, mice that have T cells with impaired perforin- or Fas-dependent killing have exacerbated HLH-like disease, and depletion of CD8 T cells in this model is protective.4,27 Mechanistically, this can be attributed to continued expansion and activation of immune cells in the absence of CD8 T cell cytolytic activity. This central role for CD8 T cells in disease pathogenesis underlies the utility of DEX in the treatment of CSS because of its lymphotoxic effects, and highlights the importance of optimizing DEX sensitivity in this cell population.
The expansion of CD8 T cells in CSS both requires and results in the production of cytokines, particularly common γ-chain cytokines such as IL-2.28 Previous work has demonstrated that deletion of the CD25 component of the IL-2 receptor on CD8 T cells in Prf1−/− mice is sufficient to abrogate the LCMV-induced expansion and activation of CD8 T cells and it significantly prolongs survival.29 IL-2 is a T cell–derived cytokine that signals through JAK1 and JAK3 to activate STAT5, which then transcriptionally upregulates the antiapoptotic molecules BCL-2, BCL-xL, and MCL-1.30,31 Through analysis of the apoptotic potential of CD8 T cells following cytokine exposure, we demonstrate that these antiapoptotic proteins mediate DEX resistance by promoting a prosurvival state that is not overcome upon DEX exposure. Interestingly, our studies suggest that cytokine-mediated DEX resistance is not restricted to IL-2, but extends to other STAT5-activating cytokines, including IL-4, IL-7, IL-9, and IL-15, which resulted in a degree of DEX resistance commensurate with the degree of STAT5 phosphorylation in human CD8 T cells. These cytokines have well-established roles in mediating T cell activation and survival32 ; however, their role in the pathogenesis of CSS and as potential therapeutic targets for these diseases has yet to be elucidated.33
A critical aspect of this work is the finding that cytokine-induced DEX resistance is effectively overcome upon targeting JAK, a common signaling node downstream of numerous cytokine receptors. Because of this ability to inhibit the activity of multiple cytokines simultaneously, RUX may be superior to a therapeutic strategy focused on targeting a single cytokine. RUX also has the potential to inhibit the activity of cytokines that contribute to disease pathogenesis, but do not modulate DEX sensitivity, such as IFN-γ. IFN-γ did not promote DEX resistance in our model, but is currently under investigation as a therapeutic target in HLH.25 Thus, our work, in conjunction with the established role for CD8 T cells as drivers of HLH, suggests that combining DEX and RUX has the dual potential to enhance DEX-induced apoptosis and attenuate other cytokine-mediated contributions to disease progression.
Importantly, a strategy combining DEX and RUX is poised for imminent clinical translation, particularly because DEX is already a component of frontline therapy for HLH and other CSS.8 Because of the poor clinical outcomes on current HLH treatment protocols, the introduction of a novel biologically-based agent such as RUX into future treatment regimens is clinically warranted. Furthermore, many data exist regarding the safety profile of RUX, allowing for the development of clinical trials that safely and effectively use RUX to augment the current standard of care. Specifically, in prior studies of RUX, the most common adverse effects include reversible cytopenias and transaminitis, with rarer complications including reactivation of specific viral infections such as hepatitis B, varicella, and herpes simplex.34,35 Despite these adverse effects, RUX has been shown to be safe in children.36,37 In conclusion, the findings presented in this study support a role for combining DEX and RUX to more effectively control hyperinflammation and thus improve survival for patients with HLH and the emerging spectrum of severe and often life-threatening CSS.
For original data, please contact Kim E. Nichols (kim.nichols@stjude.org) or Michelle L. Hermiston (michelle.hermiston@ucsf.edu).
The publication costs of this article were defrayed in part by page charge payment. Therefore, and solely to indicate this fact, this article is hereby marked “advertisement” in accordance with 18 USC section 1734.
The online version of this article contains a data supplement.
Acknowledgments
The authors thank Scott Perry in the Flow Cytometry Core Facility at St. Jude Children’s Research Hospital for his help with flow cytometric analyses for the in vivo experiments presented, Incyte Corporation for providing ruxolitinib-containing chow, and Joshua Stokes from Biomedical Communications at St. Jude Children’s Research Hospital for his assistance with the design of the visual abstract.
This work was supported by Incyte Corporation, Novartis Pharmaceuticals Corporation, and by grants from the National Institutes of Health, National Institute of Allergy and Infectious Diseases (K.E.N.), Histiocytosis Association of America (K.E.N.), American Lebanese Syrian Associated Charities (K.E.N.), a Buster Posey Family Pediatric Cancer Pilot Award (M.L.H.), the Campini Family Foundation (M.L.H.), the Pepp Family Foundation (M.L.H.), a St. Baldrick’s Innovation Award (C.E.A.), a Genentech Foundation Research Fellowship (L.K.M.), and the National Institutes of Health Medical Scientist Training Program grant T32GM007618 (L.K.M.). Additionally, this work was facilitated by the University of California, San Francisco (UCSF) Helen Diller Family Comprehensive Cancer Center National Institutes of Health grant P30CA082103, which supports the shared resource facilities that were used to conduct the flow cytometry work at UCSF.
Authorship
Contribution: L.K.M. and K.C.V. designed and conducted most experiments, analyzed and interpreted data, assembled figures, and wrote the manuscript; S.A., R.C.B., and A.N.S. provided technical assistance on all in vivo experiments; S.A. performed luminex assays; H.T. performed and analyzed all IHC experiments; B.P.S. and C.E.A. collected plasma samples from patients and controls; M.L.H. and K.E.N. procured funding for studies, directed experimental approaches, and assisted with data interpretation; and S.A., B.P.S., R.C.B., A.N.S., H.T., C.E.A., M.L.H., and K.E.N. reviewed the manuscript.
Conflict-of-interest disclosure: K.E.N. receives research funding from Incyte Corporation. M.L.H. serves on an external advisory board for Swedish Orphan Biovitrum (SOBI). The remaining authors declare no competing financial interests
Correspondence: Kim E. Nichols, St. Jude Children’s Research Hospital, 262 Danny Thomas Blvd, Memphis, TN 38105; e-mail: kim.nichols@stjude.org; and Michelle L. Hermiston, Department of Pediatrics, University of California, 550 16th St, 4th Floor, Mail Stop 0434, San Francisco, CA 94158; e-mail: michelle.hermiston@ucsf.edu.

This feature is available to Subscribers Only
Sign In or Create an Account Close Modal