

Key Points
WM patients naturally segregate into 2 distinct groups using global DNA methylation patterns with memory and PC-like features.
WM methylation subtypes demonstrate distinct tumor-specific molecular, morphological, genetic, and phenotypic features and pathways.

Abstract
Epigenetic changes during B-cell differentiation generate distinct DNA methylation signatures specific for B-cell subsets, including memory B cells (MBCs) and plasma cells (PCs). Waldenström macroglobulinemia (WM) is a B-cell malignancy uniquely comprising a mixture of lymphocytic and plasmacytic phenotypes. Here, we integrated genome-wide DNA methylation, transcriptome, mutation, and phenotypic features of tumor cells from 35 MYD88-mutated WM patients in relation to normal plasma and B-cell subsets. Patients naturally segregate into 2 groups according to DNA methylation patterns, related to normal MBC and PC profiles, and reminiscent of other memory and PC-derived malignancies. Concurrent analysis of DNA methylation changes in normal and WM development captured tumor-specific events, highlighting a selective reprogramming of enhancer regions in MBC-like WM and repressed and heterochromatic regions in PC-like WM. MBC-like WM hypomethylation was enriched in motifs belonging to PU.1, TCF3, and OCT2 transcription factors and involved elevated MYD88/TLR pathway activity. PC-like WM displayed marked global hypomethylation and selective overexpression of histone genes. Finally, WM subtypes exhibited differential genetic, phenotypic, and clinical features. MBC-like WM harbored significantly more clonal CXCR4 mutations (P = .015), deletion 13q (P = .006), splenomegaly (P = .02), and thrombocytopenia (P = .004), whereas PC-like WM harbored more deletion 6q (P = .012), gain 6p (P = .033), had increased frequencies of IGHV3 genes (P = .002), CD38 expression (P = 4.1e-5), and plasmacytic differentiation features (P = .008). Together, our findings illustrate a novel approach to subclassify WM patients using DNA methylation and reveal divergent molecular signatures among WM patients.
Introduction
Waldenström macroglobulinemia (WM) is a rare lymphoproliferative neoplasm that is neither lymphoma nor myeloma yet retains features of both disease types. WM is defined as a lymphoplasmacytic lymphoma with bone marrow (BM) infiltration and secretion of monoclonal immunoglobulin M (IgM).1 The disease is characterized as a malignancy of clonally related small B lymphocytes, plasmacytoid lymphocytes, and plasma cells (PC), thus encompassing a wide range of potential B-cell differentiation states in a given individual patient.2 Immunoglobulin gene sequences in WM suggest that tumor cells are related to IgM+ and/or IgM+IgD+ memory B cells (MBC); however, other immunophenotypic and morphologic features also suggest a relationship to PCs. The histopathologic heterogeneity and complex immunophenotypic features render assessment of cell of origin challenging.3 WM is associated with clinical behavior ranging from asymptomatic, indolent forms to symptomatic patients with hyperviscosity, organomegaly, and cytopenias.1 An approach for assessing the predominance of lymphocytic or plasmacytic states may benefit WM patients.
Recent studies reveal a remarkable degree of epigenetic change during B-cell development, involving the highly coordinated activity of a discrete subgroup of transcription factors (TFs).4 This spectrum of epigenetic landscapes underlies the various types of B-cell tumors from pregerminal center-derived malignancies to neoplasia of mature PCs, aiding in the identification of the normal B-cell subsets most closely related to a given tumor type.5 Subclassification of patients according to their degree of epigenetic maturation has indicated clinical impact within various B-cell malignancies.6-8 Comparison of DNA methylation patterns in tumor cells to the changes occurring in normal B cells also provided insight into molecular events associated with transformation. Using this approach in chronic lymphocytic leukemia (CLL), we have uncovered a role for the TFs NFAT, EGR, TCF3/E2A, and SPI1/PU.1.4
Acquired genomic abnormalities observed in WM are often shared with other related B-cell malignancies and point at crucial pathways. Central to the disease is a mutation in the myeloid differentiation primary response 88 (MYD88) gene, with the L265P alteration detected in ∼ 90% of WM patients and the remaining either lacking or exhibiting a different MYD88 mutation.9 MYD88 functions as a scaffold to adapt the cytoplasmic domain of toll-like receptors (TLRs), and mutations cause constitutive activation of the TLR pathway.10 Chromosomal aberrations include deletion 6q, 13q, 17p, and trisomy 18 and 4.11-13 Mutations in the chemokine receptor CXCR4 present in a third of patients are relatively selective for WM and associated with poor prognosis.12,14 Finally, an activating mutation affecting the SPI1 gene in a fraction of patients appears associated with poor prognosis.15
In this study, we undertook genome-wide methylation analyses of flow-sorted WM tumor cells and found that patients naturally separate into 2 distinct groups. Comparison of their CpG methylation profiles to specific stages of normal B-cell maturation revealed that the 2 subgroups of WM patients relate to either MBCs or PCs. These subtypes show differential enrichment of mutational, phenotypic, morphologic, and clinical features related to normal and tumor counterparts of MBCs or PCs representing a novel classification approach for WM patients.
Methods
Patients and materials
A total of 35 patients were enrolled in this study meeting the diagnostic criteria for WM, including >10% BM infiltrating cells.16 Written consent for BM samples and analyses was obtained in accordance with the declaration of Helsinki and with ethical approval from the local ethics committee (CPP Ile-De-France 05/21/2014). Characteristics of this cohort are summarized in supplemental Table 1, available on the Blood Web site. Cytogenetic analyses were performed as described previously.13 Morphological analyses were performed on BM aspirate smears according to World Health Organization criteria.17 All patients exhibited clonal MYD88 mutations with variant-allele frequencies (VAFs) >30%; 34 of 35 patients had L265P alterations and 1 patient had M232T.
Cell sorting and nucleic acid extraction
BM samples were processed as described15,18 and stained with fluorescein isothiocyanate anti-CD3, phycoerythrin (PE)-Cy7 anti-CD19, PE anti-Igκ, and APC anti-Igλ (BD Biosciences). Tumor cells were sorted using CD19-positivity in 9 (26%) patients or CD19+ and monotypic light chain restriction in 26 (74%); no differences in tumor sample characteristics were found between sorting strategies (supplemental Table 2). CD3-positive T lymphocytes were used as matched germline controls. Cell populations were sorted using an Influx cell sorter (BD Biosciences) and re-sorted to obtain a purity of >98%. Dual DNA/RNA extraction was done using the AllPrep Kit (Qiagen).
Genome-wide DNA methylation analysis
Genome-wide DNA methylation data were generated using Infinium MethylationEPIC Kit (Illumina) at the German Cancer Research Center (DKFZ) in Heidelberg, Germany. Tumor cell purity was derived from deconvolution of normal and tumor-specific methylation signatures.19 Thirty of 35 WM samples showed >90% tumor content, and 5 samples ranged from 70% to 90% and were excluded from certain downstream analyses as indicated (supplemental Table 3). Data for normal donor MBC, PC samples, multiple myeloma (MM) samples (>85% purity, n = 53), and CLL (HP-CLL subtype, n = 39) samples were obtained from Oakes et al, Kulis et al, and Agirre et al.4,20,21 Further details are described in the supplemental material.
Whole-exome and targeted DNA sequencing
Whole-exome and targeted sequencing were conducted on paired BM samples from 11 and 24 patients, respectively,15,18 with the SureSelect All Exon kit (Agilent Technologies) or using Ion AmpliSeq Designer (ThermoFisher Scientific) on 20 recurrently mutated genes (supplemental Table 4). Sequences were analyzed as described18 with minor modifications. Sequencing read statistics are displayed in supplemental Table 5.
RNA sequencing
RNA-seq data were analyzed as described15,18,22 and were available for 24 samples with matched genome-wide methylation and genomic sequencing data. No differences in patient and sample features were detected between those with and without RNA-seq data. IGHV gene rearrangements and mutation status were determined from RNA-seq data according to Blachly et al23 and validated using conventional IGHV analysis for 10 patients. RNA sequencing data for normal donor MBC and PC samples were obtained from the Blueprint portal (http://dcc.blueprint-epigenome.eu). Gene expression values in normal donor and WM patient samples were median normalized excluding immunoglobulin genes. Further details are supplied in the supplemental material. Genomic, expression, and methylation data are available from the European Genome-Phenome Archive (EGA) under the accession number EGAS00001003603.
Results
DNA methylation segregates WM patients into 2 groups with memory B-cell and PC expression patterns
To query epigenetic patterns in WM, we investigated genome-wide DNA methylation in tumor cells from 35 WM patients using Illumina EPIC/850K arrays. Principal component analysis (PCA) of the 10 000 most-variable cytosine guanine dinucleotides (CpGs) revealed 2 highly distinct methylation subgroups (Figure 1A). Unsupervised clustering using these CpGs further revealed differential methylation to be vastly unidirectional (Figure 1B), with 125 265 vs 25 hypomethylated CpGs between respective subgroups (Figure 1C). To investigate whether methylation groups are associated with a different transcription profile, we analyzed expression data of purified tumor cells from 24 WM patients with sufficient available material. PCA of global gene expression levels (top 1% most-variable genes analyzed by RNA sequencing) failed to reveal distinct subgroups (supplemental Figure 1); however, we observed a trend toward separation of DNA methylation subgroups in the third principal component (PC), indicating that some genes may exhibit differential expression between methylation subgroups. To address this, we used gene set enrichment analysis (GSEA) to directly compare the 2 DNA methylation subgroups specifically for enrichment of known immunological signatures. In this collection comprising 4872 gene sets, the top gene set was differential expression between normal IgM MBCs and PCs (Figure 1D). Furthermore, of the top 10 most-enriched gene sets in the immunological signatures database, 7 gene sets represented a comparison of PCs with MBCs and/or other B-cell subtypes, further demonstrating the predominance of a B-cell maturation signature between WM methylation subgroups (supplemental Table 6). Thus, we termed these subgroups MBC-like and PC-like WM subtypes, respectively.
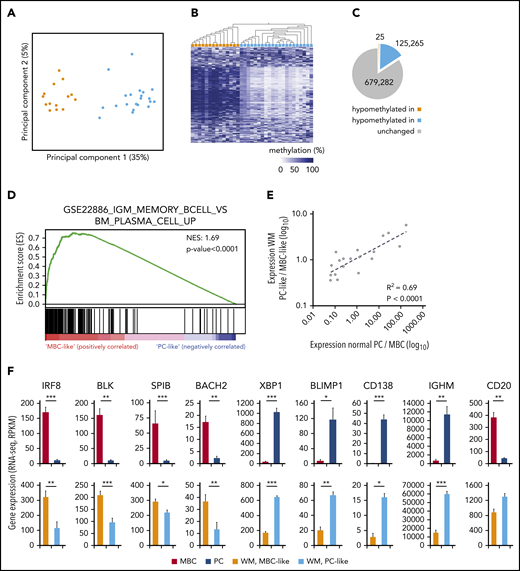
Genome-wide DNA methylation patterns define 2 subtypes of WM with transcriptional signatures reminiscent of normal plasma and MBCs. (A) PCA of the 10 000 most-variable CpG methylation levels from Illumina EPIC arrays across 35 WM patients. Samples are colored according to hierarchical clustering in panel B (orange, MBC-like; blue, PC-like). (B) Heat map showing the methylation levels of the top 1000 most-variable CpGs across patients. WM patients are arranged by hierarchical clustering (blue, methylated; white, unmethylated). (C) Pie chart displaying the number of CpGs that displays relative hypomethylation between subgroups defined by mean difference >20%, false-discovery rate q < 0.05. The number of CpGs is indicated (D) GSEA output showing highly significant enrichment of a plasma vs MBC expression signature between WM methylation subgroups. NES, normalized enrichment score. (E) Correlation of differential expression between WM subgroups and normal MBCs compared with PCs. A set of 19 genes previously defined to be important for PC differentiation was extracted from RNA sequencing data. (F) Histograms showing the expression levels of 9 of 19 genes significantly differentially expressed between MBCs and PCs in both normal and WM subtypes. Significance assessed by Student t test; *P < .05; **P < .01; ***P < .001. RPKM, reads per kilobase of transcript, per million mapped reads.
Genome-wide DNA methylation patterns define 2 subtypes of WM with transcriptional signatures reminiscent of normal plasma and MBCs. (A) PCA of the 10 000 most-variable CpG methylation levels from Illumina EPIC arrays across 35 WM patients. Samples are colored according to hierarchical clustering in panel B (orange, MBC-like; blue, PC-like). (B) Heat map showing the methylation levels of the top 1000 most-variable CpGs across patients. WM patients are arranged by hierarchical clustering (blue, methylated; white, unmethylated). (C) Pie chart displaying the number of CpGs that displays relative hypomethylation between subgroups defined by mean difference >20%, false-discovery rate q < 0.05. The number of CpGs is indicated (D) GSEA output showing highly significant enrichment of a plasma vs MBC expression signature between WM methylation subgroups. NES, normalized enrichment score. (E) Correlation of differential expression between WM subgroups and normal MBCs compared with PCs. A set of 19 genes previously defined to be important for PC differentiation was extracted from RNA sequencing data. (F) Histograms showing the expression levels of 9 of 19 genes significantly differentially expressed between MBCs and PCs in both normal and WM subtypes. Significance assessed by Student t test; *P < .05; **P < .01; ***P < .001. RPKM, reads per kilobase of transcript, per million mapped reads.
To confirm the association with normal MBC and PC subsets, we compared RNA sequencing data from WM patients with normal MBCs (n = 5) and PCs (n = 7). We first investigated a recently published set of 19 genes that are robustly associated with the maturation of PCs.24-26 We found the relative expression differences between normal MBC/PC and MBC-like/PC-like WM patients were highly correlated (Figure 1E; r2 = 0.69, P < .0001). Sixteen of 19 genes were found to be significantly differentially expressed between MBCs and PCs. Of these 16 genes, 10 show a significant difference (also in the same direction) when comparing WM MBC-like with PC-like groups (Figure 1F), including key genes controlling PC development.25,26 In addition, immunoglobulin heavy constant μ expression, the RNA encoding the μ heavy chain, was significantly higher in PC-like WM samples, as is observed in normal PCs.27 Together, these data show that unsupervised DNA methylation subgrouping identifies patients with distinct MBC-like and PC-like features.
Similar DNA methylation patterns between WM and normal cells
WM tumor populations variably display cellular phenotypes ranging from lymphocytic to plasmacytic cells in a given patient. To explore this feature using genome-wide DNA methylation, we extracted the 1000 most-variable CpGs between normal MBCs (n = 7 non-class-switched IgM+/IgD+, n = 5 class-switched to IgG+/IgA+) and PCs (n = 5 purified from tonsil, n = 3 purified from BM) derived from global DNA methylation analysis using Illumina arrays. Using this CpG probe set, we interrogated the similarity of WM cases using PCA. The first PC (PC1; 53% of variation) largely separated non-class-switched MBCs (ncsMBCs), class-switched MBCs (csMBCs), and PCs and also WM samples according to their proximity to MBCs and PCs (Figure 2A). This signature involved both loss and gain of methylation from MBC to PC (72% and 28% of CpGs, respectively). The MBC-like and PC-like WM methylation subtypes (defined in Figure 1) were more closely associated with MBCs and PCs, respectively, and displayed significantly different distributions across PC1, indicating different degrees of epigenetic differentiation between subtypes.
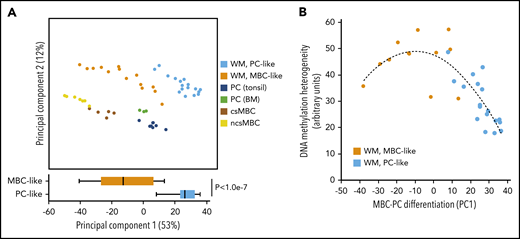
Comparison of DNA methylation patterns of WM patients with normal cells reveals a range of overall differentiation states. (A) PCA of WM patients and normal MBC subsets and PCs using the 1000 most-variable CpGs among normal cells. (bottom) Comparison of the degree of differentiation between WM subtypes as assessed by PC1. (B) Comparison of differentiation with intratumor heterogeneity of DNA methylation patterns. Samples showing an intermediate degree of maturity displayed highest heterogeneity of methylation patterns, suggesting these samples are a mixture of cells with MBC-like and PC-like states.
Comparison of DNA methylation patterns of WM patients with normal cells reveals a range of overall differentiation states. (A) PCA of WM patients and normal MBC subsets and PCs using the 1000 most-variable CpGs among normal cells. (bottom) Comparison of the degree of differentiation between WM subtypes as assessed by PC1. (B) Comparison of differentiation with intratumor heterogeneity of DNA methylation patterns. Samples showing an intermediate degree of maturity displayed highest heterogeneity of methylation patterns, suggesting these samples are a mixture of cells with MBC-like and PC-like states.
Using this signature, we next investigated if samples exhibiting ambiguous, intermediately differentiated states represent either mixtures of cells with MBC-like and PC-like states or are composed of a uniform, intermediate differentiation state. To address this, we tested the relationship between differentiation and inferred heterogeneity of DNA methylation patterns as performed previously.28 Comparison of methylation heterogeneity and differentiation revealed that patients exhibiting an ambiguous maturity displayed relatively higher levels of methylation heterogeneity (Figure 2B). This suggests that WM samples of intermediate differentiation are composed of a mixture of MBC-like and PC-like states instead of a uniformly intermediate phenotype.
MBC-like and PC-like WM subtypes display distinct epigenetic features reminiscent of other B-cell malignancies
Global methylation levels are distinct between malignancies of plasma and MBC origins; thus, we next compared the global methylation levels exhibited by MBC-like and PC-like WM subgroups, including normal B cells and other related B-cell malignancies. WM tumors displayed global DNA hypomethylation in comparison with normal blood cell types, including MBCs and PCs, as assessed by the average methylation level (β values) across all CpGs interrogated on Illumina arrays (Figure 3A). WM methylation subtypes displayed highly distinct, nonoverlapping average methylation levels, with the PC-like subgroup exhibiting considerably lower methylation (P = 8.2 × 10⁻¹²). We included MM and CLL (representing plasma and MBC-derived malignancies, respectively), selectively including high-programmed (HP) CLL methylation subtype because it is most MBC-like.4,20 Indeed, MBC-like WM global methylation levels were most similar to levels observed in HP-CLLs (Figure 3A). PC-like WM displayed low global methylation, however not to the overall degree observed in MM. A t-distributed stochastic neighbor embedding (tSNE) cluster analysis of WM along with MM, HP-CLL, and normal B-cell subsets using the most-variable CpGs among WM and normal B cells revealed WM subgroups were distinct from these other malignancies, with the MBC-like WMs partially clustering together with HP-CLL (Figure 3B). Together, these analyses show that WM subtypes have distinct epigenomes, showing differential similarity to other plasma and MBC-derived tumors.
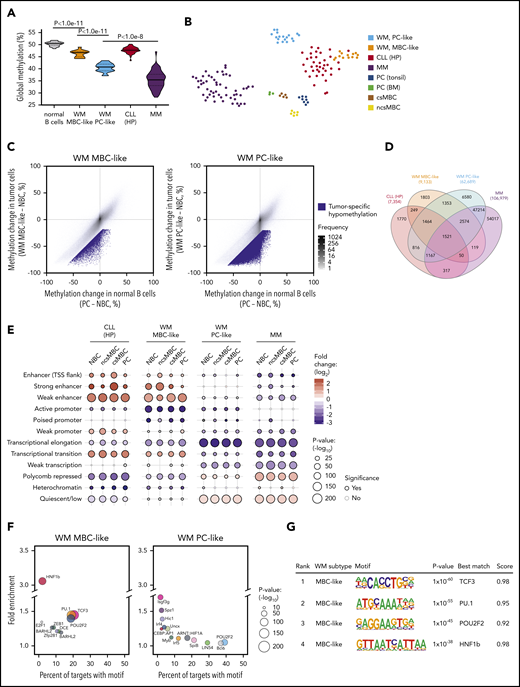
WM subtype-specific DNA methylation signatures are shared with other malignancies and highlight candidate deregulated TFs. (A) Global DNA methylation levels in normal and malignant B cells assessed by the average β value on Illumina arrays. Normal B-cell group composed of ncsMBC (n = 6), csMBC (n = 5), PC-tonsil (n = 8), and PC-BM (n = 3); MBC-like WM (n = 14), PC-like WM (n = 18), HP-CLL (n = 39), MM (n = 53). Box represents interquartile range with median, whiskers 2.5% to 97.5% confidence interval. (B) T-distributed stochastic neighbor embedding plot of the 2500 most variable CpGs among normal B cells, WM, HP-CLL, and MM showing unique methylation patterns among normal and malignant cell types. WM more closely associates with HP-CLL than MM. Same sample numbers per group as in panel A. (C) Scatterplots displaying the methylation changes occurring during normal B-cell development (x-axis) with changes occurring in WM tumor cells. Both comparisons use naive B cells (NBCs) as a fixed reference. Mean methylation per cell type of all CpGs assessed by the Illumina arrays are plotted (gray dots). CpGs that demonstrate a methylation loss of >20% beyond the decrease during normal development represent tumor-specific hypomethylation (blue dots). (D) Four-way Venn diagram displaying the overlap of tumor-specific hypomethylated CpGs between WM subtypes along with those in HP-CLL and MM. (E) Enrichment of tumor-specific hypomethylation in genomic regions defined by chromatin states in normal B-cell subsets. Hypomethylation was primarily enriched in enhancer regions in MBC-like WM, whereas was enriched in repressed and quiescent regions in PC-like WM; similar patterns were observed in HP-CLL and MM, respectively. (F) Bubble scatterplots showing the enrichment and prevalence of TF motifs in tumor-specific hypomethylation in MBC-like and PC-like WM. Motifs were determined by de novo motif finding, and motifs present in >2% of regions and P < .05 are displayed. MBC-like WM shows highly prevalent and enriched motifs for POU2F2 (OCT2), TCF3/E2A, and PU.1 (SPI1). (G) Motif logo, consensus match score, and enrichment statistics for highly enriched TF motifs in WM. TSS, transcription start site.
WM subtype-specific DNA methylation signatures are shared with other malignancies and highlight candidate deregulated TFs. (A) Global DNA methylation levels in normal and malignant B cells assessed by the average β value on Illumina arrays. Normal B-cell group composed of ncsMBC (n = 6), csMBC (n = 5), PC-tonsil (n = 8), and PC-BM (n = 3); MBC-like WM (n = 14), PC-like WM (n = 18), HP-CLL (n = 39), MM (n = 53). Box represents interquartile range with median, whiskers 2.5% to 97.5% confidence interval. (B) T-distributed stochastic neighbor embedding plot of the 2500 most variable CpGs among normal B cells, WM, HP-CLL, and MM showing unique methylation patterns among normal and malignant cell types. WM more closely associates with HP-CLL than MM. Same sample numbers per group as in panel A. (C) Scatterplots displaying the methylation changes occurring during normal B-cell development (x-axis) with changes occurring in WM tumor cells. Both comparisons use naive B cells (NBCs) as a fixed reference. Mean methylation per cell type of all CpGs assessed by the Illumina arrays are plotted (gray dots). CpGs that demonstrate a methylation loss of >20% beyond the decrease during normal development represent tumor-specific hypomethylation (blue dots). (D) Four-way Venn diagram displaying the overlap of tumor-specific hypomethylated CpGs between WM subtypes along with those in HP-CLL and MM. (E) Enrichment of tumor-specific hypomethylation in genomic regions defined by chromatin states in normal B-cell subsets. Hypomethylation was primarily enriched in enhancer regions in MBC-like WM, whereas was enriched in repressed and quiescent regions in PC-like WM; similar patterns were observed in HP-CLL and MM, respectively. (F) Bubble scatterplots showing the enrichment and prevalence of TF motifs in tumor-specific hypomethylation in MBC-like and PC-like WM. Motifs were determined by de novo motif finding, and motifs present in >2% of regions and P < .05 are displayed. MBC-like WM shows highly prevalent and enriched motifs for POU2F2 (OCT2), TCF3/E2A, and PU.1 (SPI1). (G) Motif logo, consensus match score, and enrichment statistics for highly enriched TF motifs in WM. TSS, transcription start site.
We next identified CpGs that demonstrate tumor-specific methylation states in each WM subtype by comparing the changes in CpG methylation that occur across the spectrum of normal B-cell maturation (from naive B cells to PCs) to those that occur in the WM tumor cells (Figure 3C). For the MBC-like and PC-like WM subtypes, we identified 9133 and 62 689 CpGs that display a mean loss of >25% methylation within each subtype, respectively. The PC-like WM subtype exhibited greater than sixfold more tumor-specific hypomethylated CpGs than MBC-like WM, consistent with global analyses. WM subtype-specific CpG methylation demonstrated overlap between subtypes with 75.7% of hypomethylated CpGs in MBC-like WM coinciding with PC-like WM (Figure 3D). Compared with other related malignancies, 40% of hypomethylated CpGs in MBC-like WM overlapped with HP-CLL, and 84.7% of PC-like WM hypomethylation overlapped with MM. To determine how tumor-specific methylation patterns relate to the functional compartments of the genome, we compared subtype-specific hypomethylation to chromatin states in normal B cells. Chromatin states demarcate regions into functional domains, such as promoter, enhancer, transcribed, repressed, and quiescent states, as well as activity level (strong, weak, poised, etc), using combinations of informative histone modifications.29 MBC-like WM hypomethylated CpGs were highly enriched in enhancers and transcribed regions (gene bodies), whereas were depleted in polycomb-repressed, quiescent, and heterochromatic regions (Figure 3E). Hypomethylation in the PC-like WM subtype showed an inverse pattern, exhibiting enrichment in polycomb-repressed and quiescent regions and depletion in active regions such as enhancer and gene body regions. The patterns of enrichment/depletion observed in MBC-like and PC-like WM subtypes were found to be largely consistent with patterns observed in HP-CLL and MM, respectively (Figure 3E). Overall, these enrichment patterns were consistent across chromatin states defined in various normal B-cell subsets. These results demonstrate differential targeting of epigenetic changes between WM subtypes, with DNA methylation changes in MBC-like WM targeted to functional domains associated with transcriptional activation, whereas in PC-like WM, broader methylation loss instead occurs primarily in repressed, heterochromatic, and intergenic regions.
Sequence-specific binding of TFs often controls the epigenetic state and activity of enhancers. Thus, to investigate potential mechanisms underlying differential targeting of epigenetic changes between WM subtypes, we looked for enrichment of TF motifs in tumor-specific hypomethylated regions. An unbiased de novo motif search in MBC-like WM-specific hypomethylation revealed strong enrichment for TCF3/E2A, OCT2 (POU2F2), and PU.1, each present in ∼20% of hypomethylated regions (Figure 3F). Motifs belonging to these TF families were also selectively enriched when searching a comprehensive database of 365 known motifs (supplemental Tables 7 and 8). Enrichment of PU.1 motifs in hypomethylated regions was also observed in HP-CLL along with OCT2 and TCF3, further demonstrating the relationship with MBC-like WM (supplemental Figure 2). In contrast, we did not detect obvious enrichment of TF motifs in the PC-like WM subtype, consistent with the lack of enrichment of hypomethylation at enhancer regions (Figure 3E-F). These data indicate that the aberrant epigenetic patterns observed in MBC-like WM involve selective activation of TFs targeted to enhancer and transcribed regions, differing from the broad hypomethylation that appears to occur in quiescent and heterochromatic regions in PC-like WM. Overall, WM subtypes display unique constellations of epigenetic features, while sharing some tumor-specific events between subtypes and among other B-cell tumors.
MBC-like and PC-like WM subtypes display differential tumor-specific transcriptional signatures
We further evaluated gene expression differences between WM subtypes using RNA-seq data from 9 MBC-like and 15 PC-like patients. In addition to the MBC vs PC signatures described above, GSEA revealed strong enrichment for the neighborhood of MYD88 (the top ranked gene neighborhood in 858 computational gene sets) in MBC-like WM (Figure 4A). This was accompanied by increased TLR signaling in MBC-like WM as evidenced by enrichment of genes activated upon CpG oligonucleotide stimulation. Indeed, MYD88 was more highly transcribed in MBC-like WM cases (Figure 4B). This enrichment occurred despite both subtypes harboring equivalent overall MYD88 VAFs (supplemental Table 3).
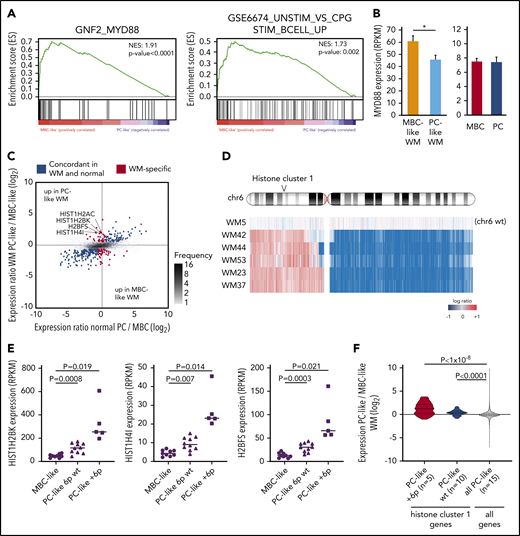
WM subgroups show differential TLR/MYD88 pathway activation and histone expression. (A) GSEA comparing MBC-like and PC-like WM patients revealed strong enrichment of the MYD88 neighborhood and CpG stimulation of B cells indicative of enhanced TLR signaling in MBC-like WM. (B) Elevation of MYD88 expression in MBC-like vs PC-like WM patients (P = .024) not observed in normal donor MBC vs PC. (C) Analysis of MBC-like vs PC-like WM subtype-specific gene expression accounting for differences that occur in normal donor MBC/PCs. Scatterplot comparing differential gene expression between normal MBC/PC (x-axis) and WM subtypes (y-axis) of all genes (gray dots). Genes differentially expressed between MBC-like and PC-like WM (fold change >1.5, q < 0.05) are highlighted in red with those that show concordant expression differences between normal donor MBC vs PC in blue. Histone genes showing discordant overexpression in PC-like WM are highlighted. (D) Genomic profile across chromosome 6 in patients showing gain of chr6p. All +6p patients also show loss of 6q. One patient (WM5) with no copy number alterations on chromosome 6 is shown for reference. Histone cluster 1 is gained in all patients with +6p. (E) Expression levels of selected discordantly expressed histone genes in MBC-like and PC-like WM separated by chromosome 6p status. (F) Expression of all histone genes in cluster 1 (n = 49) in PC-like vs MBC-like WM separated by chromosome 6p status. Expression of histone cluster 1 genes in PC-like relative to MBC-like WM patients is significantly elevated relative to all other expressed genes (n = 14 069). P values assessed by Kruskal-Wallis and post hoc Mann-Whitney tests.
WM subgroups show differential TLR/MYD88 pathway activation and histone expression. (A) GSEA comparing MBC-like and PC-like WM patients revealed strong enrichment of the MYD88 neighborhood and CpG stimulation of B cells indicative of enhanced TLR signaling in MBC-like WM. (B) Elevation of MYD88 expression in MBC-like vs PC-like WM patients (P = .024) not observed in normal donor MBC vs PC. (C) Analysis of MBC-like vs PC-like WM subtype-specific gene expression accounting for differences that occur in normal donor MBC/PCs. Scatterplot comparing differential gene expression between normal MBC/PC (x-axis) and WM subtypes (y-axis) of all genes (gray dots). Genes differentially expressed between MBC-like and PC-like WM (fold change >1.5, q < 0.05) are highlighted in red with those that show concordant expression differences between normal donor MBC vs PC in blue. Histone genes showing discordant overexpression in PC-like WM are highlighted. (D) Genomic profile across chromosome 6 in patients showing gain of chr6p. All +6p patients also show loss of 6q. One patient (WM5) with no copy number alterations on chromosome 6 is shown for reference. Histone cluster 1 is gained in all patients with +6p. (E) Expression levels of selected discordantly expressed histone genes in MBC-like and PC-like WM separated by chromosome 6p status. (F) Expression of all histone genes in cluster 1 (n = 49) in PC-like vs MBC-like WM separated by chromosome 6p status. Expression of histone cluster 1 genes in PC-like relative to MBC-like WM patients is significantly elevated relative to all other expressed genes (n = 14 069). P values assessed by Kruskal-Wallis and post hoc Mann-Whitney tests.
We next compared differential expression between subtypes in the context of expression changes that occur during B-cell differentiation to reveal genes expressed in a tumor-specific manner. Parallel comparison of the WM subtype differences with normal MBCs and PCs identified 242 genes that were concordantly expressed (>1.5-fold difference, q < 0.05) in normal PCs/PC-like WM and normal MBC/MBC-like WM samples (Figure 4C blue dots). To identify genes that were expressed outside of the range expected during normal development, we identified genes that were not concordantly different between normal MBC/PC and yet differentially expressed between WM subtypes (red dots). This analysis revealed only 50 and 30 tumor-specific genes upregulated in MBC-like and PC-like WM, respectively (supplemental Table 9), further indicating that the difference between WM subtypes is largely due to underlying differences between normal MBC and PC phenotypes. Four of 30 genes selectively upregulated in PC-like WM were histones, with 3 of 4 belonging to histone cluster 1 located on chromosome 6p22. Recurrent chromosome 6p gains have been reported in WM,30 and 5 patients (all PC-like) displayed single-copy gain of 6p22 (Figure 4D). Interestingly, these histone genes were upregulated in PC-like WM regardless of 6p status, and to a greater degree than expected by a single copy gain (mean 6.6-fold increase; Figure 4E). Genes in histone cluster 1 (n = 49) were more highly expressed overall in PC-like than in MBC-like WM in comparison with all other expressed genes and regardless of 6p status (Figure 4F).
Distinct biological and clinical features of MBC-like and PC-like WM subtypes
To further explore biological features of MBC-like and PC-like WM subtypes, we compared acquired genetic alterations, including mutations and copy-number alterations. Deletions on chromosome 6q occurred almost exclusively in the PC-like subgroup, with 11 of 21 patients displaying 6q loss and only 1 MBC-like WM patient with the aberration (Figure 5A; P = .012). Gain of chromosome 6p, which occurred concomitantly with 6q deletions as described previously,30,31 exclusively occurred in the PC-like WM subtype (P = .033). Conversely, deletions on 13q (all containing the 13q14/DLEU2 locus) occurred mainly within the MBC-like subtype (P = .012). We next separated available whole-exome sequencing and targeted mutation data15 by WM subtype (supplemental Tables 10 and 11). Other than MYD88, the only gene mutations in >3 patients were CXCR4 and SPI1 (PU.1). CXCR4 mutations occurred in 7 of 14 MBC-like WM patients and in 2 of 21 PC-like WM patients at clonal VAFs with an additional 2 of 21 patients at subclonal frequency. Clonal CXCR4 mutations were significantly enriched in MBC-like WM patients (P = .015). Investigation of IGHV rearrangements revealed all PC-like WM samples analyzed (15/15) harbored rearrangements of VH3 genes, whereas MBC-like WM less frequently used VH3 (5/10), along with VH1 (3/10) and VH4 (2/10) rearrangements (χ2, P < .01; Figure 5B; supplemental Table 12). VH3 gene usage has been shown to be predominant (75% to 80%) in WM, whereas usage of IGHV1-2 genes is found in CLL and marginal zone lymphomas.32,33
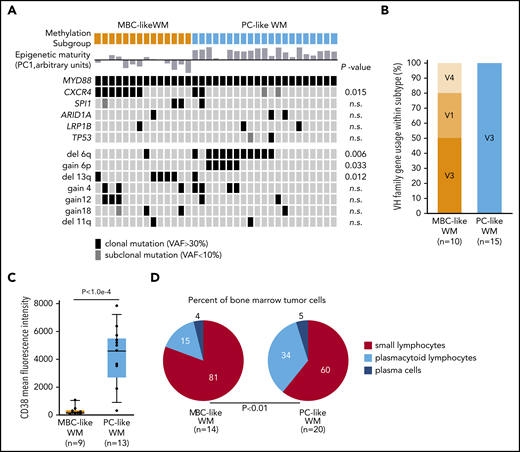
WM subgroups show differential biological features. (A) Oncoprint of genomic aberrations in WM separated by methylation subtype. Epigenetic maturity (as defined in Figure 3) is indicated for each sample; bars below and above represent low and high maturity, respectively. Mutations were mostly clonal VAFs (black) with a minority of subclonal mutations observed (VAF <10%; dark gray). (B) The proportion of patients with IGHV1-6 rearrangements separated by methylation subtype. (C) Box plot of the mean fluorescence intensity of CD38 on WM tumor cells separated by methylation subtype, gated on CD19+ and monotypic light chain–restricted cells. (D) Summary of tumor cell morphology of WM patient BM samples. Percentages of cell types were averaged within WM methylation subtypes. n.s., not significant.
WM subgroups show differential biological features. (A) Oncoprint of genomic aberrations in WM separated by methylation subtype. Epigenetic maturity (as defined in Figure 3) is indicated for each sample; bars below and above represent low and high maturity, respectively. Mutations were mostly clonal VAFs (black) with a minority of subclonal mutations observed (VAF <10%; dark gray). (B) The proportion of patients with IGHV1-6 rearrangements separated by methylation subtype. (C) Box plot of the mean fluorescence intensity of CD38 on WM tumor cells separated by methylation subtype, gated on CD19+ and monotypic light chain–restricted cells. (D) Summary of tumor cell morphology of WM patient BM samples. Percentages of cell types were averaged within WM methylation subtypes. n.s., not significant.
We next compared patient clinical and pathological features between subtypes. CD5 surface expression was generally very lowly expressed across patients; however, increased staining was observed in 2 MBC-like WM patients. The mean fluorescence intensity of CD38 was significantly higher overall in PC-like WM (Figure 5C), consistent with known elevated surface CD38 in plasma vs memory cells and robust expression in MM.3,34 Morphological examination of tumor cells in BM samples uncovered variable differentiation between subtypes, with MBC-like and PC-like patients displaying higher proportions of small lymphocytes and plasmacytoid lymphocytes cells, respectively (P < .01; Figure 5D; supplemental Table 13). MBC-like patients more frequently experienced splenomegaly (5/14 vs 1/21; P = .02) and thrombocytopenia (7/14 vs 0/21; P < .0001). Together with the divergent genetic aberrations between WM subtypes, these biological and clinical features further support the existence of distinct biological subtypes of WM patients that can be classified using epigenetic profiles.
Discussion
WM exhibits cellular phenotypes ranging from small lymphocytic B cells to plasmacytic cells.3 In this study, we observed that DNA methylation has the capacity to assign WM patients to 2 distinct subtypes displaying remarkable, nonoverlapping differences in global methylation levels and distinct genome-wide patterns. These subtypes display characteristics reminiscent of normal MBC and PC subsets, including genes differentially expressed between normal MBCs and PCs. WM subtypes also display differential genetic aberrations (CXCR4 mutations, deletions on 6q and 13q), immunogenetic profiles, immunophenotype, and certain clinical features.
Despite the phenotypic heterogeneity observed in WM tumors, studies have shown consistent monotypic light chain usage and clonal IGHV rearrangements between lymphocytic and plasmacytic populations, demonstrating clonal origin.35 Clonal frequencies of recurrent mutations, such as those of MYD88 present in >90% of patients, further indicate clonal origin of WM cells. MYD88 mutations are found in premalignant steps36,37 and in a variety of B-cell disorders,38,39 underlying the early nature of these mutations and the lack of association with a specific B-cell phenotype. Previous studies of phenotypic heterogeneity in WM using morphology, immunohistochemistry, and flow cytometry approaches estimate that the lymphocytic component is generally predominant, with plasmacytic cells making up the majority of cells in 20% to 30% of patients,2 and <1% of marrow cells in WM patients retain a true normal PC immunophenotype. Using unsupervised analyses, we found that WM samples ranged in overall differentiation states from MBC-like to PC-like subtypes. We observed increased heterogeneity of methylation patterns in samples displaying overall intermediate differentiation, suggesting that these samples are mixtures of MBC-like and PC-like states, confirming the heterogeneous nature of WM with respect to B-cell differentiation. Our findings suggest that the MBC-like and PC-like subtypes represent WM populations arrested at differential stages of differentiation rather than originating from distinct populations of MBC or PC cells. Although the propensity to exist as primarily MBC-like or PC-like subtypes is associated with differential IGHV rearrangements, genomic mutations, and clinical features, the underlying basis remains to be clarified.
The relationship of WM subtypes to normal MBCs and PCs prompted the evaluation of other B-cell malignancies representing memory (HP-CLL) and PC-derived (MM) malignancies.5 Overall, WM has been shown to exhibit a CLL-like expression pattern,40 with sorted lymphocytic and plasmacytic cells more closely resembling CLL and MM, respectively.41 Indeed, nearly half of the tumor-specific hypomethylation in MBC-like WM was shared with HP-CLL and a remarkable 85% of hypomethylation in PC-like WM was shared with MM, demonstrating the subtype-specific relationship of WM subtypes to these malignancies. Genomic distribution of epigenetic changes was also very similar, with MBC-like WM and HP-CLL alterations targeted to enhancers and transcribed regions, and alterations in PC-like WM and MM enriched in heterochromatic and repressed intergenic regions. Hypomethylation of TCF/E2A, OCT2, and PU.1 motifs occurs during normal B-cell differentiation4 ; however, their further enrichment in WM tumor-specific hypomethylation indicates increased activity of these TFs in tumor cells above normal levels. Although PC-like WM and MM lacked evidence of TF-driven alterations, MBC-like WM and HP-CLL shared enrichment of TF motifs in hypomethylated regions, including TCF3 and PU.1, indicating aberrant activation of common upstream pathways in these MBC-like malignancies. PU.1 is a tightly controlled gatekeeper of terminal PC maturation42 and may influence differentiation of WM cells.
Global loss of DNA methylation is a hallmark of B-cell malignancies, and PC-like WM partially recapitulated the extreme hypomethylation exhibited by MM.21 This profound methylation loss in PC-like WM was not associated with altered expression of DNA methyltransferases, TET enzymes, and other regulators of DNA methylation. Histone expression is tightly regulated in normal cells and maintains the genome-wide patterns of histone modifications and variants that underlie chromatin structure.43 Although a link of histone expression and altered DNA methylation has not been established, differences in amino acid sequences among replication-dependent histones (mostly found in histone cluster 1) have been proposed to confer differential functions in normal and tumor cells. Of note, focal gains of 1q21 containing histone cluster 2 ranks among the most common copy number alterations in MM,43 which also exhibits 6p gains in a similar frequency as PC-like WM along with broad hypomethylation.
Recently, Hunter and colleagues24 revealed an association between global transcriptional profiles and genetic aberrations in WM, including CXCR4 mutations with an earlier stage of B-cell differentiation. This is consistent with our observation of CXCR4-mutant patients enriched in the less-differentiated MBC-like WM subtype. As our sample size is not sufficiently powered to uncover associations with patient outcomes, subclassification of WM patients into epigenetic subtypes in larger, uniformly treated cohorts may predict therapeutic responses anticipated by the maturity of WM tumors. A range of new therapies has been recently approved or is under investigation for WM, many of which also represent current and investigative approaches for other B-cell lymphomas and MM, including those showing selectivity and efficacy in MM, such as proteasome inhibitors, immunomodulatory drugs, histone deacetylase inhibitors, anti-CD38 monoclonal antibodies, and other novel therapies. The MBC-like WM subtype exhibited an elevated MYD88-associated gene expression signature, suggesting that targeting the TLR pathway, potentially using JAK/STAT or IRAK-specific inhibition,44 may show added benefit in MBC-like WM.
Contact the corresponding authors for original data.
The genomic, expression, and methylation data reported in this article are available from the European Genome-Phenome Archive (accession number EGAS00001003603).
The online version of this article contains a data supplement.
The publication costs of this article were defrayed in part by page charge payment. Therefore, and solely to indicate this fact, this article is hereby marked “advertisement” in accordance with 18 USC section 1734.
Acknowledgments
The authors thank all the patients who contributed to this study, as well as Karim Maloum and Catherine Settegrana, for help with patient data.
This work was supported by grants from INSERM, Institut National du Cancer (INCa), 2013-PLBIO-09, 2016-PLBIO-068, JTC 2014-143, INCa-DGOS-INSERM_12551, INCA-DGOS-Inserm_12560, Association Laurette Fugain (O.A.B. and F.N.-K.), LNCC, Fondation ARC (SFI20111203530), and GEFLUC. P.V. acknowledges funding from the MRC Disease Team Awards (G1000729/94931 and MR/L008963/1), MRC Molecular Haematology Unit, and the Oxford Partnership Comprehensive Biomedical Research Centre (NIHR BRC Funding scheme.oxfbrc-2012-1). T.Z. is supported by the Krebsliga, the Dornonville de la Cour Stiftung, and the CRPP (UZH). C.C.O. acknowledges support from the Gabrielle’s Angel Foundation for Cancer Research and the Leukemia Research Foundation.
Authorship
Contribution: D.R.-W., M.A., V.D.-V., H.G., C.D., and M.M. performed laboratory experiments; D.R.-W., B.G., J.L., and C.C.O. performed data analysis and interpretation; V.L., M.L.G.-T., P.V., T.Z., and F.N.-K. contributed reagents, samples, and/or data; D.R.-W., F.N.-K., O.A.B., and C.C.O. wrote the manuscript; and all authors reviewed and edited the manuscript.
Conflict-of-interest disclosure: The authors declare no competing financial interests.
Correspondence: Florence Nguyen-Khac, Unité de Cytogénétique Hématologique, Service d’Hématologie Biologique, GH Pitié-Salpêtrière/Charles Foix, 83 Bd de l’Hôpital, Paris 75013, France; e-mail: florence.nguyen-khac@aphp.fr; Olivier A. Bernard, INSERM U1170, Gustave Roussy, 39 rue Camille Desmoulins, 94805 Villejuif Cedex, France; e-mail: olivier.bernard@inserm.fr; and Christopher C. Oakes, Division of Hematology, Department of Internal Medicine, The Ohio State University, 400 W. 12th Ave, Suite 455, Columbus, OH 43210; e-mail: christopher.oakes@osumc.edu.

This feature is available to Subscribers Only
Sign In or Create an Account Close Modal