

Key Points
14-3-3ε controls the load/capacity balance in multiple myeloma cells via the mTORC1 pathway.
14-3-3ε expression predicts sensitivity to proteasome inhibitors in multiple myeloma.

Abstract
High protein load is a feature of multiple myeloma (MM), making the disease exquisitely sensitive to proteasome inhibitor (PIs). Despite the success of PIs in improving patient outcome, the majority of patients develop resistance leading to progressive disease; thus, the need to investigate the mechanisms driving the drug sensitivity vs resistance. With the well-recognized chaperone function of 14-3-3 proteins, we evaluated their role in affecting proteasome activity and sensitivity to PIs by correlating expression of individual 14-3-3 gene and their sensitivity to PIs (bortezomib and carfilzomib) across a large panel of MM cell lines. We observed a significant positive correlation between 14-3-3ε expression and PI response in addition to a role for 14-3-3ε in promoting translation initiation and protein synthesis in MM cells through binding and inhibition of the TSC1/TSC2 complex, as well as directly interacting with and promoting phosphorylation of mTORC1. 14-3-3ε depletion caused up to a 50% reduction in protein synthesis, including a decrease in the intracellular abundance and secretion of the light chains in MM cells, whereas 14-3-3ε overexpression or addback in knockout cells resulted in a marked upregulation of protein synthesis and protein load. Importantly, the correlation among 14-3-3ε expression, PI sensitivity, and protein load was observed in primary MM cells from 2 independent data sets, and its lower expression was associated with poor outcome in patients with MM receiving a bortezomib-based therapy. Altogether, these observations suggest that 14-3-3ε is a predictor of clinical outcome and may serve as a potential target to modulate PI sensitivity in MM.
Introduction
14-3-3 proteins are highly conserved from yeast to human and consist of 7 mammalian isoforms (β, γ, ζ, η, θ, σ, and ε) with unique expression patterns in different cell types and tissues.1,2 Human 14-3-3 proteins self-assemble into homo- and heterodimers3 with proteins containing specific phosphoserine/phosphothreonine motifs, RSXpSXP (mode 1) and RXXXpSXP (mode 2), where pS represents phosphoserine4-7 ; however, they can also bind to unphosphorylated proteins.8 Moreover, structurally constrained anchor residues outside the binding motifs may play a critical role in stabilizing the protein-protein interactions.9
Affinity purification of cellular 14-3-3 binding proteins in proteomic studies provides evidence for several different binding partners. Although all 7 isoforms can interact with common proteins, each isoform has been proposed to have unique interacting partners as a result of isoform-specific sequences at the N terminus.10 The binding induces conformational changes in the target proteins to alter the stability and/or catalytic activity of the ligand,5,11 resulting in the regulation of diverse biological activities. This highlights the role of 14-3-3 proteins as an integration point for proliferative, survival, apoptotic, and stress signaling processes.12
Emerging evidence suggests a rich and dynamic transcriptional and epigenetic regulation of 14-3-3 protein expression and functions13-15 ; however, the underlying regulatory mechanisms responsible for controlling the cellular levels of different 14-3-3 isoforms are not yet fully characterized. Altered expression of 14-3-3 proteins have been associated with development and progression of cancer,16-21 as well as response to therapy and prognosis.21-29 14-3-3 proteins have been reported to have dysregulated expression in multiple myeloma (MM),30 an incurable plasma cell malignancy.
MM is characterized by dysregulated translational control and high protein turnover, making MM cells exquisitely sensitive to proteasome inhibitor (PI) therapy31,32 and leading to improvement in patient outcome. However, long-term disease-free survival is still uncommon, and resistance to PIs is an emerging clinical issue, the mechanisms of which have not been fully elucidated. 14-3-3 proteins have been shown to regulate aggresome formation in an HDAC6-independent pathway,33 and recently, an important role for the isoform 14-3-3ζ in regulating MM cell growth and sensitivity to therapeutics was reported.34 Therefore, we performed an extensive analysis of 14-3-3 proteins in MM and observed a significant effect of the 14-3-3ε isoform expression on response to both bortezomib (BTZ) and carfilzomib (CFZ) in MM cell lines and primary MM cells. We here report a novel role for 14-3-3ε in promoting translation initiation and protein synthesis in myeloma cells and show that the decreased protein load consequent to 14-3-3ε loss contributes to reduced sensitivity to PI treatment in MM.
Materials and methods
Cells
Primary MM cells were isolated from bone marrow aspirates of patients with MM, using Ficoll-Hypaque density gradient sedimentation and CD138 microbead separation, after informed consent and institutional review board approval (Dana-Farber Cancer Institute and the Blood Diseases Hospital, respectively). CD19+ B cells were isolated using Ficoll-Hypaque density gradient sedimentation with CD19 microbead separation from peripheral blood of healthy donors after informed consent. The human myeloma cell lines and primary CD138+ MM cells were cultured in RPMI 1640 medium (Mediatech, Herndon, VA) supplemented with 10% fetal bovine serum. 293T cells (ATCC) cells were maintained in Dulbecco’s modified Eagle medium with 10% fetal bovine serum.
Plasmids
To generate the pLenti6-YWHAE overexpression (OE) plasmid, we cloned YWAHE cDNA from plasmid pcDNA3-HA-14-3-3 ε (#13273; Addgene), XbaI site in the 5′ end and EcoRI site in the 3′ end. FLAG-EglN1-pLenti6 vector (#36949; Addgene) was double digested by EcoRI-HF enzyme (NEB, #R3101S) and XbaI enzymes (#R0145S; New England Biolabs [NEB]), and ligated with a YWHAE fragment. To generate the pLenti6 control plasmid (pLenti6-empty), pcDNA 3.1 plasmid (Invitrogen) was digested with EcoRI-HF and XbaI to liberate the multiple cloning site with EcoRI-HF and XbaI overhangs. We subsequently ligated the multiple cloning site to the digested plenti6. The final FLAG-YWHAE-pLenti6 plasmid or empty-pLenti6 plasmid was then transformed into One Shot Stbl3 Chemically Competent Escherichia coli (#C7373-03; Invitrogen). CRISPR knockout (KO) was performed using the pSpCas9(BB)-2A-GFP (PX458) vector (a gift from Feng Zhang; Addgene plasmid #48138). To generate the pspCas9-GFP-YWHAE, we annealed the paired forward and reverse sgRNAs (designed with https://zlab.bio/guide-design-resources, caccgAAGCGAATAGGATGCGTTGG, caccgCCTAAGCGAATAGGATGCGT) in the following condition: 30°C for 30 minutes, 98°C for 10 minutes, ramp down at 3% to 25°C. The BbsI enzyme (#R0539; NEB) digested pspCas9-GFP vectors were ligated with annealed sgRNA with T4 DNA ligase (#M0202L; NEB) at 16°C overnight. The final pspCas9-GFP-YWHAE plasmid was then transformed into One Shot Stbl3 Chemically Competent E coli. To package the lentivirus particles, 293T cells were transfected with the Trans-Lentiviral shRNA Packaging System (GE Dharmacon; #TLP4616) following the manufacturer’s protocol.
shRNA gene knockdown
Human YWHAE short hairpin RNA (shRNA) vectors were purchased from MilliporeSigma. pLKO.1 was purchased from Addgene (plasmid #8453) and used as control, and 0.5 µg/mL puromycin (#A1113803; Gibco) was used as antibiotic selection.
shRNA#1.
CCGGCGCTGAGTGAAGAAAGCTATACTCGAGTATAGCTTTCTTCACTCAGCGTTTTTG
shRNA#2.
CCGGGCTGACAGTTGAAGAAAGAAACTCGAGTTTCTTTCTTCAACTGTCAGCTTTTTG
CRISPR KO
To generate YWHAE knockout cells, NCI-H929 and KMS-11 were transfected with 2 μg pspCas9-GFP-YWHAE or pspCas9-GFP, using the Amaxa Cell Line Nucleofector Kit V (VCA-1003; Lonza), following manufacturer’s protocol. After 2 days, GFP+ cells were sorted (BD FACSARIA II SORP; BD Biosciences, San Jose, CA) and single-cell cultured. KO was confirmed by quantitative polymerase chain reaction (PCR) and western blot. One derived KO clone was used for downstream experiments.
Stable overexpression and addback
WT or YWHAE-KO MM cells were transduced with pLenti6-empty or pLenti6-FLAG-YWHAE virus in Polybrene media (final concentration, 8 µg/mL) overnight, followed by antibiotic selection with 10 µg/mL blasticidin (#A11138903; Gibco).
Cell viability assay
Cells (0.5-2 × 10⁴/100 μL) were cultured in 96-well plates (white, opaque, #3917; Corning) and treated with BTZ (#S1013; Selleckchem) or CFZ (#PR-171; Selleckchem) at different concentrations. Cell viability assays were performed at 24 hours, using CellTiter-Glo Luminescent Cell Viability Assay (CTG, #G7572; Promega) according to manufacturer’s instruction.
Quantitative RT-PCR analysis
Expression of human YWHAE transcript in primary MM cells was determined using real-time quantitative reverse transcriptase-polymerase chain reaction (qRT-PCR) based on TaqMan fluorescence methodology, following manufacturer protocols (Applied Biosystems, Foster City, CA). Relative expression was calculated using the comparative ΔΔ(Ct) method.
Immunoblotting
Cells were harvested, processed by Ficoll density gradient centrifugation to remove dead cells, and lysed in lysis buffer (RIPA, #BP-115; Boston Bio Products) supplemented with Halt protease and phosphatases inhibitor cocktail (#78440; Thermo Fisher Scientific). Protein concentrations were determined using Pierce BCA Protein Assay Kit (#23227; Thermo Fisher Scientific). The following antibodies were used: 14-3-3ε antibody (#9635; Cell Signaling Technology [CST]), mTOR Pathway Antibody Sampler Kit (#9964; CST), Phospho-TSC2 Antibody Sampler Kit (#8350; CST), 4E-BP Antibody Sampler Kit (#9955; CST), eIF2α (D7D3) XP® rabbit monoclonal antibody (mAb) (#5324; CST), Phospho-eIF2α (Ser51; D9G8) XP rabbit mAb (#3398; CST), and ANTI-FLAG M2 antibody (#F3165; MilliporeSigma). Glyceraldehyde-3-phosphate dehydrogenase (GAPDH) (#2118; CST) and tubulin (#2148; CST) were used as loading controls.
Coimmunoprecipitation and mass spectrometry
Cell proteins were extracted with CHAPS lysis buffer (#BP-114; Boston Bio Products). 14-3-3ε binding proteins were pulled down with ANTI-FLAG M2 Affinity Gel (#A2220; MilliporeSigma).
Cap-binding assay
Cap-binding assay was performed following manufacturer’s instructions. Briefly, cell lysates (500 μg protein) were incubated at 4°C overnight with m7GTP Sepharose beads (#M7GTP-001A; Creative BioMart) to capture eIF4E and its binding partners. Precipitates were washed 3 times with the lysis buffer and resuspended in 2× Laemmli sample buffer followed by western blot analysis.
Protein synthesis
To determine protein synthesis, Click-iT AHA (L-azidohomoalaine), Alexa Fluor 488 alkyne, and Click-iT Cell Reaction Buffer Kit (#C10428; Invitrogen) were used according to the manufacturer’s protocol. Briefly, Click-iT AHA (50 μM) was added to cells in methionine-free medium (#A1451701; Invitrogen) for 1 hour. The cells were washed twice with phosphate-buffered saline, fixed with 4% paraformaldehyde, and permeabilized with 0.5% Triton X-100. Detection of the incorporated amino acid uses a click reaction between an azide and alkyne, where the azido-modified protein is detected with an Alexa Fluor 488 by flow cytometry.
Flow cytometric assay for intracellular monoclonal light chain expression
Intracellular clonal light chain levels were determined using APC anti-human Ig light chain κ antibody (#316510; Biolegend) and FITC anti-human Ig light chain λ antibody (#316606; Biolegend) staining according to the manufacturer’s protocol. Data were analyzed using FlowJo (Treestar, Ashland, OR) software.
ELISA
MM cells (5 × 10⁵ cells/mL) were incubated in complete medium for 24 hours. Human λ or κ levels were evaluated in the cell culture supernatant according to the manufacturer’s protocol (#E88-115 and #E88-116; Bethel Laboratories).
Proteasome activity
Proteasome activities were measured with a Proteasome-Glo Chymotrypsin-Like, Trypsin-Like, and Caspase-Like Cell-Based Assays kit (#G1180; Promega) according to the manufacturer’s protocol.
Human plasmacytoma xenograft models
All experiments involving animals were approved by an institutional Animal Care and Use Committee. KMS20 cells with and/or without 14-3-3ε OE (5 × 10⁶/100 μL with matrix gel) were subcutaneously inoculated into the mouse hind flank region. When the tumors were palpable (100 to 200 mm3), mice were randomly assigned and treated with vehicle control or BTZ (#179324-69-7, 0.5 mg/kg intraperitoneally biweekly; Selleckchem) for 2 weeks followed by 2 weeks off (5 mice in each group). Tumor growth was measured in 2 perpendicular dimensions, using a caliper and the following formula: V = (a2 × b)/2, where “a” is the width of the tumor (smaller diameter) and “b” is the length (larger diameter). Mice were euthanized when tumor volume reached 2000 mm3.
14-3-3 perturbation gene expression data
JJN3 MM cells were infected with either scrambled (pLKO.1) or 14-3-3ε-targeted shRNAs and selected with puromycin for 72 hours before RNA extraction and gene expression analysis using HTA 2.0.
Myeloma patient analysis
For gene correlation analysis, we used RNA-seq data of CD138+ MM cells collected from 360 newly diagnosed patients with MM from IFM-DFCI 2009 clinical trial (ClinicalTrials.gov identifier: NCT01191060). Rank-ordered gene lists derived from Pearson correlation coefficients between YWHAE and individual gene expression levels across all patients with MM were subjected to gene set enrichment analysis (GSEA).
Statistical analysis
Data were analyzed using unpaired Student t tests comparing 2 conditions, or a 1-way analysis of variance with Bonferroni or Newman-Keuls correction for multiple comparisons using the GraphPad Prism 8 software. A value of P < .05 was considered significant. Data are presented as means, and error bars in the figures depict standard deviation (SD).
Results
Expression of 14-3-3ε is associated with PI resistance in MM cells
Considering the known chaperone function of 14-3-3 proteins and their interaction with several functionally diverse molecules, we sought to evaluate their role in impacting proteasome activity and sensitivity to proteasome inhibition. We correlate expression of 14-3-3 proteins at both mRNA and protein levels with the sensitivity of 2 PIs, BTZ and CFZ, in a large panel of MM cell lines. We treated MM cell lines with 6 different drug concentrations (ranging from 0 to 100 nM) and assayed the response 24 hours posttreatment. The half maximal inhibitory concentrations (IC50s) were calculated and compared with individual 14-3-3 gene expression across all cell lines by Pearson correlation coefficients (Table 1). We observed that the expression level of only YWHAE (coding gene for the isoform 14-3-3ε) showed a significant positive correlation with both BTZ and CFZ response (Figure 1A-B; supplemental Figure 1A-C, available on the Blood Web site). We have further confirmed high expression of 14-3-3ε protein in a large panel of MM cell lines and primary patient MM cells with lower expression in healthy donor B cells (supplemental Figure 1D-E).
Correlation between 14-3-3 isoforms and PI sensitivity
| Gene name | Protein | PI sensitivity correlation in MM cell lines | |||
|---|---|---|---|---|---|
| BTZ | CFZ | ||||
| r | P | r | P | ||
| YWHAS/SFN | 14-3-3 σ | −0.02558 | .9251 | 0.3646 | .244 |
| YWHAB | 14-3-3 β | −0.1124 | .6786 | 0.1622 | .6145 |
| YWHAE | 14-3-3 ε | −0.5164 | .0406 | −0.74 | .0059 |
| YWHAG | 14-3-3 γ | 0.2677 | .3161 | 0.1756 | .5851 |
| YWHAH | 14-3-3 η | −0.5622 | .0234 | −0.4095 | .1862 |
| YWHAQ | 14-3-3 τ | −0.1914 | .4776 | −0.1329 | .6806 |
| YWHAZ | 14-3-3 ζ | 0.1478 | .5849 | 0.1166 | .7181 |
Pearson correlation analysis between expression of 14-3-3 proteins and sensitivity to BTZ and CFZ in a panel of MM cell lines. A Pearson correlation coefficient, r, value greater than 0 indicates a positive association; less than 0 indicates a negative association; 0 indicates no association between the 2 variables. Significant correlations are shown in bold and italics.

YWHAE/14-3-3ε expression levels correlates with PI sensitivity in MM cell lines. (A-B) A panel of MM cell lines were treated with different concentrations of BTZ (A) or CFZ (B) for 24 hours, and cell viability was evaluated by Cell-Titer Glo (CTG). IC50 was calculated with GraphPad Prism 8. Pearson correlation analysis of YWHAE mRNA expression level and IC50 for BTZ (A) or CFZ (B) is shown in the graph. (C-F) H929, JJN3, and AMO1 MM cells were infected with either scrambled (pLKO.1) or 14-3-3ε-targeted shRNA and selected with puromycin for 72 hours. Transduced cells were treated with different concentrations of BTZ or CFZ for 24 hours. Cell viability was evaluated by CTG. (C,E) Results are expressed as percentage change compared with each untreated control cell. (D,F) IC50 analysis was performed using the GraphPad Prism 8 and shown in the right panels. Data represent mean ± SD from 3 experiments performed in triplicate. Data were analyzed using unpaired Student t tests: *P ≤ .05; **P ≤ .01; ***P ≤ .001; ****P ≤ .0001.
YWHAE/14-3-3ε expression levels correlates with PI sensitivity in MM cell lines. (A-B) A panel of MM cell lines were treated with different concentrations of BTZ (A) or CFZ (B) for 24 hours, and cell viability was evaluated by Cell-Titer Glo (CTG). IC50 was calculated with GraphPad Prism 8. Pearson correlation analysis of YWHAE mRNA expression level and IC50 for BTZ (A) or CFZ (B) is shown in the graph. (C-F) H929, JJN3, and AMO1 MM cells were infected with either scrambled (pLKO.1) or 14-3-3ε-targeted shRNA and selected with puromycin for 72 hours. Transduced cells were treated with different concentrations of BTZ or CFZ for 24 hours. Cell viability was evaluated by CTG. (C,E) Results are expressed as percentage change compared with each untreated control cell. (D,F) IC50 analysis was performed using the GraphPad Prism 8 and shown in the right panels. Data represent mean ± SD from 3 experiments performed in triplicate. Data were analyzed using unpaired Student t tests: *P ≤ .05; **P ≤ .01; ***P ≤ .001; ****P ≤ .0001.
To confirm the effect of 14-3-3ε on PI sensitivity, we performed both loss-of-function and gain-of-function studies in a large panel of MM cell lines. The effect of 14-3-3ε perturbation on MM cell viability was found to be heterogenous; for the majority of the cell lines tested, we have observed a decrease in MM cell viability after knockdown (KD; supplemental Figure 2A-B), but not a consistent effect after 14-3-3ε OE or addback in KO cells (supplemental Figure 3A-B). However, shRNA-mediated 14-3-3ε KD in 3 MM cell lines significantly reduced sensitivity to both BTZ and CFZ (Figure 1C-F). Inhibition of the BTZ-induced upregulation of NOXA was also detected in KD cells (supplemental Figure 2C). In contrast, ectopic expression of 14-3-3ε in 4 MM cell lines (with low basal levels of 14-3-3ε) significantly increased PI sensitivity in vitro (Figure 2A-B). This observation was further confirmed by gene addback in 14-3-3ε KO KMS11 MM cells (Figure 2C). Finally, we evaluated expression of 14-3-3ε expression in the ANBL-6 MM cell line with acquired BTZ resistance through prolonged exposure to increasing drug concentrations (ANBL-6/V10R). BTZ-resistant ANBL-6/V10R displayed lower expression of 14-3-3ε compared with the drug-naive isogeneic cell line (supplemental Figure 1C). Moreover, OE of 14-3-3ε in the ANBL-6/V10R cell line restored its sensitivity to BTZ (and CFZ; Figure 2D). Importantly, 14-3-3ε KD did not impair the 3 major enzymatic activities of the proteasome (chymotrypsin-like, caspase-like, and trypsin-like) or the ability of BTZ to inhibit these activities (supplemental Figure 2D-E).

14-3-3ε modulation affects sensitivity to PIs in MM cells in vitro and in vivo. (A) Control and ectopically expressing 14-3-3ε KMS20 cells were treated with different concentrations of BTZ or CFZ. Cell viability was assessed by CTG after 24 hours of treatment and expressed as percentage change from untreated cells (top). IC50 analysis is also shown (bottom). Data represent mean ± SD from 3 experiments performed in triplicate. (B) Control and ectopically expressing 14-3-3ε LR5, KMS26, and SKMM1 cells were treated with different concentrations of BTZ or CFZ. IC50 is shown in the graph. Data represent mean ± SD from 3 experiments performed in triplicate. (C) YWHAE was knocked out in KMS11 with the CRISPR/Cas9 system, and then a single clone of KO cells was infected with either pLenti6-empty (empty) or pLenti6-FLAG-YWHAE OE plasmid (14-3-3ε). Expression of 14-3-3ε protein was evaluated by western blot. GAPDH was used as loading control (right). Infected cells were treated with different concentrations of BTZ or CFZ. Cell viability was assessed by CTG after 24 hours of treatment, and IC50 was calculated with GraphPad Prism 8 (left). (D) Control and ectopically expressing 14-3-3ε ANBL-6 WT and ANBL-6/V10R cells were treated with different concentrations of BTZ or CFZ. IC50 analysis is shown. Data represent mean ± SD from 3 experiments performed in triplicate. (E) Control and ectopically expressing 14-3-3ε KMS20 cells were injected subcutaneously in severe combined immunodeficiency mice. After detection of tumor, mice were treated either with placebo or 2 cycles of BTZ (0.5 mg/kg twice weekly for 2 weeks, followed by 2 weeks off). Tumor growth was evaluated weekly by caliper measurement and represented as tumor volume (millimeters cubed). (F) Comparison of tumor volume in control and treated mice after the first (left) and second (right) cycle of treatment, respectively. Data were analyzed using unpaired Student t tests: *P ≤ .05; **P ≤ .01; ***P ≤ .001; ****P ≤ .0001.
14-3-3ε modulation affects sensitivity to PIs in MM cells in vitro and in vivo. (A) Control and ectopically expressing 14-3-3ε KMS20 cells were treated with different concentrations of BTZ or CFZ. Cell viability was assessed by CTG after 24 hours of treatment and expressed as percentage change from untreated cells (top). IC50 analysis is also shown (bottom). Data represent mean ± SD from 3 experiments performed in triplicate. (B) Control and ectopically expressing 14-3-3ε LR5, KMS26, and SKMM1 cells were treated with different concentrations of BTZ or CFZ. IC50 is shown in the graph. Data represent mean ± SD from 3 experiments performed in triplicate. (C) YWHAE was knocked out in KMS11 with the CRISPR/Cas9 system, and then a single clone of KO cells was infected with either pLenti6-empty (empty) or pLenti6-FLAG-YWHAE OE plasmid (14-3-3ε). Expression of 14-3-3ε protein was evaluated by western blot. GAPDH was used as loading control (right). Infected cells were treated with different concentrations of BTZ or CFZ. Cell viability was assessed by CTG after 24 hours of treatment, and IC50 was calculated with GraphPad Prism 8 (left). (D) Control and ectopically expressing 14-3-3ε ANBL-6 WT and ANBL-6/V10R cells were treated with different concentrations of BTZ or CFZ. IC50 analysis is shown. Data represent mean ± SD from 3 experiments performed in triplicate. (E) Control and ectopically expressing 14-3-3ε KMS20 cells were injected subcutaneously in severe combined immunodeficiency mice. After detection of tumor, mice were treated either with placebo or 2 cycles of BTZ (0.5 mg/kg twice weekly for 2 weeks, followed by 2 weeks off). Tumor growth was evaluated weekly by caliper measurement and represented as tumor volume (millimeters cubed). (F) Comparison of tumor volume in control and treated mice after the first (left) and second (right) cycle of treatment, respectively. Data were analyzed using unpaired Student t tests: *P ≤ .05; **P ≤ .01; ***P ≤ .001; ****P ≤ .0001.
To test whether increased expression of 14-3-3ε in MM cells affects sensitivity to BTZ in vivo, we performed mouse xenograft studies with KMS20 cells stably expressing 14-3-3ε or empty vector. Treatment with low dose BTZ significantly reduced tumor burden in mice engrafted with 14-3-3ε overexpressing cells compared with the inhibition observed in control mice engrafted with empty vector cells (Figure 2E-F).
14-3-3ε interacts with and affects the mTORC1 signaling pathway
To elucidate the underlying molecular mechanism responsible for 14-3-3ε contribution to PI sensitivity, we evaluated its protein interactome by mass spectrometry. We observed interaction of 14-3-3ε with a large number of proteins, including established partners such as survival factor cRAF, the core protein component of the mitochondrial apoptotic machinery BAD, and the transcription factor forkhead box O1 (FOXO) family members35-38 (data not shown). Further analysis of the 14-3-3ε interactome in myeloma cells revealed enrichment in mTORC1, PI3K-AKT-mTOR, and unfolded protein response (UPR) pathway-related genes (Figure 3A; supplemental Figure 4A). These pathways have been well-established in myeloma biology, giving the rationale to further evaluate their role as binding partners of 14-3-3ε.39-42 Analysis of immunoprecipitated proteins confirmed interaction of 14-3-3ε with p-mTOR (S2448) and its upstream negative regulator p-TSC2 (S939), but not with other mTORC1 subunits or with the mTORC1 downstream targets p-p70 S6k and p-4E-BP1 (Figure 3B).
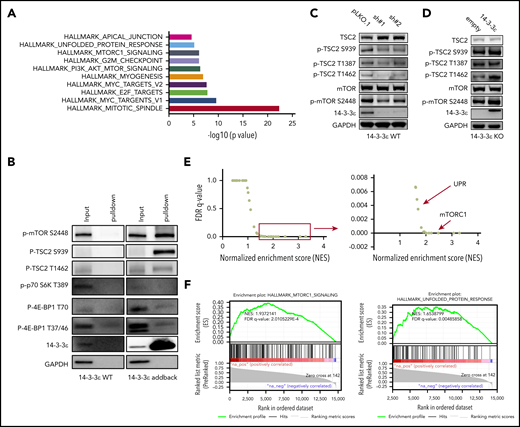
14-3-3ε interacts with and affects the mTORC1 signaling pathway. (A-B) Anti-FLAG antibody was used to pull down 14-3-3ε binding proteins in H929 KO cells expressing pLenti6-FLAG-YWHAE OE plasmid (14-3-3ε). Cell lysate from H929 (FLAG-negative with YWHAE WT) cells was used as negative control. Pull-down products were subjected to mass spectrometry or western blot analysis. (A) Hallmark GSEA of 14-3-3ε interacting proteins detected by mass spectrometry analysis. (B) Pull-down products were subjected to western blot analysis and probed with the indicated antibodies. (C) Western blot analysis in H929 MM cells infected with either scrambled (pLKO.1) or two 14-3-3ε-targeted shRNAs was performed using the indicated mAbs, including 14-3-3ε mAb to confirm KD efficiency. (D) Western blot analysis in H929 KO cells expressing pLenti6-empty (empty) or pLenti6-FLAG-YWHAE OE plasmid (14-3-3ε) was performed using the indicated mAbs, including 14-3-3ε to confirm addback efficiency. GAPDH was used as loading control. One representative blot of 2 is shown. (E) Pearson correlation coefficients between YWHAE and individual gene expression levels across all patients with MM were calculated; the resulting rank-ordered gene list was subjected to GSEA. GSEA false discovery rate (FDR)-q values and normalized enrichment scores for genes significantly correlated with YWHAE expression in primary MM cell RNA-seq data are shown in the graph. (F) GSEA-derived enrichment plots for mTORC1 and UPR pathways.
14-3-3ε interacts with and affects the mTORC1 signaling pathway. (A-B) Anti-FLAG antibody was used to pull down 14-3-3ε binding proteins in H929 KO cells expressing pLenti6-FLAG-YWHAE OE plasmid (14-3-3ε). Cell lysate from H929 (FLAG-negative with YWHAE WT) cells was used as negative control. Pull-down products were subjected to mass spectrometry or western blot analysis. (A) Hallmark GSEA of 14-3-3ε interacting proteins detected by mass spectrometry analysis. (B) Pull-down products were subjected to western blot analysis and probed with the indicated antibodies. (C) Western blot analysis in H929 MM cells infected with either scrambled (pLKO.1) or two 14-3-3ε-targeted shRNAs was performed using the indicated mAbs, including 14-3-3ε mAb to confirm KD efficiency. (D) Western blot analysis in H929 KO cells expressing pLenti6-empty (empty) or pLenti6-FLAG-YWHAE OE plasmid (14-3-3ε) was performed using the indicated mAbs, including 14-3-3ε to confirm addback efficiency. GAPDH was used as loading control. One representative blot of 2 is shown. (E) Pearson correlation coefficients between YWHAE and individual gene expression levels across all patients with MM were calculated; the resulting rank-ordered gene list was subjected to GSEA. GSEA false discovery rate (FDR)-q values and normalized enrichment scores for genes significantly correlated with YWHAE expression in primary MM cell RNA-seq data are shown in the graph. (F) GSEA-derived enrichment plots for mTORC1 and UPR pathways.
Western blot analysis also revealed activation of TSC2 and consequent inhibition of mTORC1 (via decrease of p-mTOR S2448 levels) in 14-3-3ε KD cells (Figure 3C). The effect of genetic depletion of 14-3-3ε on mTORC1 was rescued by 14-3-3ε-FLAG addback in KO cells (Figure 3D). Gene expression profiling in the 14-3-3ε KD cells confirmed a significant effect on the mTORC1 signaling pathway, as well as UPR-related genes, compared with scrambled cells (supplemental Figure 4B).
The role of 14-3-3ε in the mTORC1 pathway in MM cell was further confirmed using RNA-seq by observing a significant positive correlation (R > 0.8) between 14-3-3ε expression and the expression of genes involved in the mTORC1 and UPR pathways (Figure 3E-F) in primary MM cells from 360 newly diagnosed patients with MM. These results indicate that 14-3-3ε affects mTORC1 signaling in MM cells by binding to serine-phosphorylated residues on mTOR and its upstream negative regulator TSC2, resulting in mTORC1 activation. Depletion of 14-3-3ε inhibits TSC2 phosphorylation, causing a subsequent inhibition of mTORC1 signaling.
Depletion of 14-3-3ε inhibits translation initiation complex formation and decreases protein synthesis in MM
One major conserved function of mTORC1 is to promote mRNA translation and protein synthesis via activation of S6 kinase 1 (S6K1), as well as inhibition of the eukaryotic initiation factor 4E (eIF4E) binding protein (4E-BP).40 We observed modulation of 4E-BP1 activity in response to 14-3-3ε KD in several MM cell lines (Figure 4A-B; supplemental Figure 5A), whereas no significant effect was observed on S6K1 and phospho-40S ribosomal protein S6 (p-S6R), as well as the regulatory associated protein of mTOR (Raptor; supplemental Figure 5B). Importantly, 14-3-3ε addback in KO cells rescued the effect (Figure 4C). Dephosphorylated 4E-BP1 inhibits eIF4E-initiated cap-dependent translation, competing with eIF4G for binding to eIF4E and preventing formation of eIF4F complex.40,43 As shown in Figure 4D, compared with 14-3-3ε addback cells, 14-3-3ε KO cells displayed increased 4E-BP1-m7GTP binding along with decreased EIF4G-m7GTP binding, suggesting increased 4E-BP1-eIF4E interaction and inhibition of translation initiation complex formation. The protein level of all the subunits of translation initiation complex were not affected by genetic modulation of 14-3-3ε (supplemental Figure 5C). Finally, we have observed that 14-3-3ε binds directly to p-eIF2α (Figure 4E), and its depletion causes an increased phosphorylation of eIF2α on Ser-51 (Figure 4F), also leading to inhibition of translation initiation.44,45
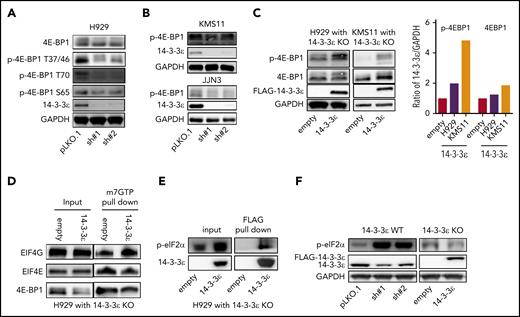
Depletion of YWHAE inhibits translation initiation complex formation. (A-B) Western blot analysis in H929 (A) and KMS11 and JJN3 (B) MM cell lines infected with either scrambled (pLKO.1) or two 14-3-3ε-targeted shRNAs was performed using the indicated mAbs. (C) Western blot analysis in H929 (left) and KMS11 (right) KO cells expressing pLenti6-empty (empty) or pLenti6-FLAG-YWHAE OE plasmid (14-3-3ε) was performed using the indicated mAbs, including 14-3-3ε to confirm addback efficiency. GAPDH was used as loading control. GAPDH ratio is shown (right). (D) m7GTP was used to pull down m7GTP binding proteins in H929 KO cells expressing pLenti6-empty (empty) or pLenti6-FLAG-YWHAE OE plasmid (14-3-3ε). Pull-down products were subjected to western blot analysis and probed with the indicated antibodies. (E) Anti-FLAG antibody was used to pull down 14-3-3ε binding proteins in H929 KO cells expressing pLenti6-FLAG-YWHAE OE plasmid. Cell lysate from H929 with YWHAE KO cells expressing pLenti6-empty was used as negative control (empty). Pull-down products were subjected to western blot analysis and probed with the indicated antibodies. (F) Western blot analysis in H929 MM cells infected with either scrambled (pLKO.1) or two 14-3-3ε-targeted shRNAs (left), and in H929 KO cells expressing pLenti6-empty (empty) or pLenti6-FLAG-YWHAE OE plasmid (14-3-3ε; right). One representative blot of 2 is shown.
Depletion of YWHAE inhibits translation initiation complex formation. (A-B) Western blot analysis in H929 (A) and KMS11 and JJN3 (B) MM cell lines infected with either scrambled (pLKO.1) or two 14-3-3ε-targeted shRNAs was performed using the indicated mAbs. (C) Western blot analysis in H929 (left) and KMS11 (right) KO cells expressing pLenti6-empty (empty) or pLenti6-FLAG-YWHAE OE plasmid (14-3-3ε) was performed using the indicated mAbs, including 14-3-3ε to confirm addback efficiency. GAPDH was used as loading control. GAPDH ratio is shown (right). (D) m7GTP was used to pull down m7GTP binding proteins in H929 KO cells expressing pLenti6-empty (empty) or pLenti6-FLAG-YWHAE OE plasmid (14-3-3ε). Pull-down products were subjected to western blot analysis and probed with the indicated antibodies. (E) Anti-FLAG antibody was used to pull down 14-3-3ε binding proteins in H929 KO cells expressing pLenti6-FLAG-YWHAE OE plasmid. Cell lysate from H929 with YWHAE KO cells expressing pLenti6-empty was used as negative control (empty). Pull-down products were subjected to western blot analysis and probed with the indicated antibodies. (F) Western blot analysis in H929 MM cells infected with either scrambled (pLKO.1) or two 14-3-3ε-targeted shRNAs (left), and in H929 KO cells expressing pLenti6-empty (empty) or pLenti6-FLAG-YWHAE OE plasmid (14-3-3ε; right). One representative blot of 2 is shown.
We have therefore assessed the effect of 14-3-3ε on translational efficiency in MM cells. In 3 MM cell lines 14-3-3ε depletion caused up to 50% reduction in protein synthesis (Figure 5A-B), whereas 14-3-3ε OE (Figure 5C-D) or addback in YWHAE-KO cells (Figure 5E) resulted in a marked upregulation of protein synthesis. Inhibition of mTORC with rapamycin decreased the enhanced protein synthesis observed in 14-3-3ε-overexpressing cells, confirming the critical role of mTORC pathway on the 14-3-3ε-mediated protein synthesis (Figure 5D). Moreover, treatment with CHX, an inhibitor of translation elongation, only partially rescued the enhanced protein synthesis observed in 14-3-3ε OE cells (supplemental Figure 5D).
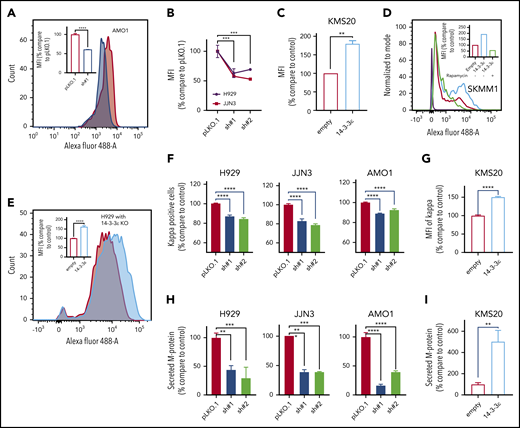
14-3-3ε modulation has a significant effect on protein synthesis and load in MM cells. (A) Protein synthesis was analyzed by flow cytometry in AMO1 cell line infected with either scrambled (pLKO.1) or 14-3-3ε-targeted shRNA. The overlay histogram plot shows mean fluorescent intensity (MFI) of incorporated l-homopropargylglycine (HPG) (Alexa Fluor 488) into proteins of pLKO.1 (red) and KD (blue) cells during active protein synthesis. In the inset, results are expressed as percentage change compared with pLKO.1 control cell. (B) Protein synthesis was analyzed by flow cytometry in H929 (black) and JJN3 (red) MM cell lines infected with either scrambled (pLKO.1) or 14-3-3ε-targeted shRNAs. Results are expressed as percentage change compared with each pLKO.1 control cell. (C) Protein synthesis was analyzed by flow cytometry in KMS20 MM cells infected with either pLenti6-empty (empty, red) or pLenti6-FLAG-YWHAE OE plasmid (14-3-3ε, blue), expressed as percentage change compared with control cells. (D) Protein synthesis was analyzed by flow cytometry in SKMM1 MM cells infected with either pLenti6-empty (empty) or pLenti6-FLAG-YWHAE OE plasmid (14-3-3ε). The overlay histogram plot shows MFI of incorporated HPG (Alexa Fluor 488) into proteins of empty control (red), 14-3-3ε OE (blue), and 14-3-3ε OE cells treated with rapamycin (5 μM, 24 hours; green) during active protein synthesis. The purple histogram represents the negative control. In the inset, results are expressed as percentage of empty control cells. (E) Flow cytometry evaluation of protein synthesis in H929 KO MM cells infected with either pLenti6-empty (empty) or pLenti6-FLAG-YWHAE OE plasmid (14-3-3ε). The overlay histogram plot shows MFI of incorporated HPG (Alexa Fluor 488) into proteins of empty (red) and addback (blue) cells. In the inset, results are expressed as percentage change compared with control cells. (F-G) Flow cytometry analysis of clonal cytoplasmic κ light chain expression in 14-3-3ε KD (F) or OE (G) MM cell line. Results are expressed as percentage change compared with each control cells. (H-I). Secreted M protein was evaluated by ELISA assay in 14-3-3ε KD (H) or OE (I) MM cell line. Results are expressed as percentage change compared with control cells. Data were analyzed using unpaired Student t tests: *P ≤ .05; **P ≤ .01; ***P ≤ .001; ****P ≤ .0001.
14-3-3ε modulation has a significant effect on protein synthesis and load in MM cells. (A) Protein synthesis was analyzed by flow cytometry in AMO1 cell line infected with either scrambled (pLKO.1) or 14-3-3ε-targeted shRNA. The overlay histogram plot shows mean fluorescent intensity (MFI) of incorporated l-homopropargylglycine (HPG) (Alexa Fluor 488) into proteins of pLKO.1 (red) and KD (blue) cells during active protein synthesis. In the inset, results are expressed as percentage change compared with pLKO.1 control cell. (B) Protein synthesis was analyzed by flow cytometry in H929 (black) and JJN3 (red) MM cell lines infected with either scrambled (pLKO.1) or 14-3-3ε-targeted shRNAs. Results are expressed as percentage change compared with each pLKO.1 control cell. (C) Protein synthesis was analyzed by flow cytometry in KMS20 MM cells infected with either pLenti6-empty (empty, red) or pLenti6-FLAG-YWHAE OE plasmid (14-3-3ε, blue), expressed as percentage change compared with control cells. (D) Protein synthesis was analyzed by flow cytometry in SKMM1 MM cells infected with either pLenti6-empty (empty) or pLenti6-FLAG-YWHAE OE plasmid (14-3-3ε). The overlay histogram plot shows MFI of incorporated HPG (Alexa Fluor 488) into proteins of empty control (red), 14-3-3ε OE (blue), and 14-3-3ε OE cells treated with rapamycin (5 μM, 24 hours; green) during active protein synthesis. The purple histogram represents the negative control. In the inset, results are expressed as percentage of empty control cells. (E) Flow cytometry evaluation of protein synthesis in H929 KO MM cells infected with either pLenti6-empty (empty) or pLenti6-FLAG-YWHAE OE plasmid (14-3-3ε). The overlay histogram plot shows MFI of incorporated HPG (Alexa Fluor 488) into proteins of empty (red) and addback (blue) cells. In the inset, results are expressed as percentage change compared with control cells. (F-G) Flow cytometry analysis of clonal cytoplasmic κ light chain expression in 14-3-3ε KD (F) or OE (G) MM cell line. Results are expressed as percentage change compared with each control cells. (H-I). Secreted M protein was evaluated by ELISA assay in 14-3-3ε KD (H) or OE (I) MM cell line. Results are expressed as percentage change compared with control cells. Data were analyzed using unpaired Student t tests: *P ≤ .05; **P ≤ .01; ***P ≤ .001; ****P ≤ .0001.
As MM is characterized by excess production of monoclonal immunoglobulins, we evaluated the effect of 14-3-3ε perturbation on intracellular κ and λ light chain production. We observed changes in the intracellular abundance of the light chains with 14-3-3ε modulation in all MM cell lines tested (Figure 5F-G; supplemental Figure 5E). Moreover, we also confirmed a decrease in the light chain secretion in 14-3-3ε-depleted cells (Figure 5H). These effects were reversed in cells ectopically expressing 14-3-3ε (Figure 5I).
Expression of 14-3-3ε correlates with PI sensitivity in primary MM cells and predicts outcome in MM
To explore the translational potential of our results, we evaluated the effect of 14-3-3ε expression on PI sensitivity and monoclonal protein production in primary patient MM cells. We evaluated sensitivity to both BTZ and CFZ and protein load in 2 cohorts of patients with MM with significantly different 14-3-3ε expression (supplemental Figure 6A). We observed that higher expression of 14-3-3ε correlated with enhanced sensitivity to PIs (Figure 6A-B) and increased protein load (Figure 6C). This positive correlation between 14-3-3ε expression and protein load was confirmed in an additional cohort of patients with MM (n = 27) (Figure 6D). As 14-3-3ε is located on chromosome 17p13.3, we have confirmed its lower expression in patients with myeloma and MM cell lines with del17p (supplemental Figure 6B-C). We have therefore evaluated the protein load in del17p patients with MM and observed a significantly lower monoclonal protein level in these patients with MM compared with others (Figure 6E). Importantly, within the del17p group, a poor clinical outcome was observed in patients with lower M protein load (Figure 6F; supplemental Figure 6D).

14-3-3ε expression level influences PI sensitivity and protein load in primary MM cells. (A) CD138+ cells from bone marrow aspirates of 11 patients with MM were assessed for 14-3-3ε (YWHAE) mRNA expression and sensitivity to PIs. YWHAE mRNA expression was assessed by quantitative polymerase chain reaction and presented as cycle threshold (CT) values (a higher value indicates lower mRNA expression). Cell viability was assessed by CTG after 24 hours of treatment in the presence of different concentrations of BTZ or CFZ, and IC50 values were calculated by GraphPad Prism 8. Pearson correlation analysis showed a significant correlation between 14-3-3ε mRNA expression level and IC50 for BTZ and CFZ treatment. (B) Comparison of BTZ and CFZ IC50 average between the 2 groups of patients with MM with high and low 14-3-3ε expression, respectively, using an unpaired Student t test. (C) Comparison of YWHAE levels in secretory and nonsecretory patients based on their M-spike levels. (D) YWHAE levels in secretory vs nonsecretory patients in a Chinese cohort of patients with MM (n = 27). (E) CD138+ cells from bone marrow aspirates were assessed for del17p status by FISH. M-protein levels in patients with del17p (n = 21) vs without del17p (n = 249) are reported in the graph. (F) PFS in del17p MM patients with different M protein levels undergoing BTZ-based therapy.
14-3-3ε expression level influences PI sensitivity and protein load in primary MM cells. (A) CD138+ cells from bone marrow aspirates of 11 patients with MM were assessed for 14-3-3ε (YWHAE) mRNA expression and sensitivity to PIs. YWHAE mRNA expression was assessed by quantitative polymerase chain reaction and presented as cycle threshold (CT) values (a higher value indicates lower mRNA expression). Cell viability was assessed by CTG after 24 hours of treatment in the presence of different concentrations of BTZ or CFZ, and IC50 values were calculated by GraphPad Prism 8. Pearson correlation analysis showed a significant correlation between 14-3-3ε mRNA expression level and IC50 for BTZ and CFZ treatment. (B) Comparison of BTZ and CFZ IC50 average between the 2 groups of patients with MM with high and low 14-3-3ε expression, respectively, using an unpaired Student t test. (C) Comparison of YWHAE levels in secretory and nonsecretory patients based on their M-spike levels. (D) YWHAE levels in secretory vs nonsecretory patients in a Chinese cohort of patients with MM (n = 27). (E) CD138+ cells from bone marrow aspirates were assessed for del17p status by FISH. M-protein levels in patients with del17p (n = 21) vs without del17p (n = 249) are reported in the graph. (F) PFS in del17p MM patients with different M protein levels undergoing BTZ-based therapy.
Finally, YWHAE (14-3-3ε) expression is a predictor of clinical outcome in a large data set of patients with myeloma receiving BTZ as first-line therapy (supplemental Figure 6E); it is important to note, however, that although 14-3-3ε does come out as an important prognostic variable, its connection with del17p and its close association with this high-risk phenotype suppresses its eventual selection in multivariate models.
Discussion
PI-based combination therapies have changed the outcome in MM. MM cells have specific sensitivity to PIs compared with other normal cells, and the load/capacity balance is being used to explain this differential sensitivity of MM cells. Dysregulation of the mTORC1 pathway is considered to play an important role in this process, as it is central to the regulation of proteasome assembly46 while playing a key regulatory role in the translation process promoting protein synthesis.41,47,48 Importantly, inhibition of the mTORC1 pathway has been identified as a possible mechanism driving BTZ resistance.42
We here report that 14-3-3ε promotes translation initiation and protein synthesis in MM cells by interacting and promoting phosphorylation of mTOR and sequestering its negative regulator TSC2, leading to mTORC1 activation. This change in the protein load shifts the balance to enhance MM cell sensitivity to PI (Figure 7). In contrast, depletion of 14-3-3ε releases the TSC1/TSC2 complex, leading to an impairment of mTORC1 activity and inhibition of translation initiation complex formation. This process mechanistically supports arrest of protein synthesis in MM cells and leads to decreased PI sensitivity. Our gain-of-function and loss-of-function studies confirmed the critical role of 14-3-3ε in maintaining the load/capacity balance in MM cells. In these studies, 14-3-3ε KD impaired the mTORC1-dependendent protein synthesis in MM cells, decreasing the sensitivity to both BTZ and CFZ in a panel of MM cell lines in vitro. In contrast, OE of 14-3-3ε significantly increased the sensitivity to low-dose BTZ in vitro as well as in vivo in a murine xenograft model of human MM. These results therefore highlight a unique function of the 14-3-3ε program that converges on regulation of mTOR-dependent protein synthesis in MM and implies 14-3-3ε expression levels as one of the mechanisms contributing to PI sensitivity in MM cells.
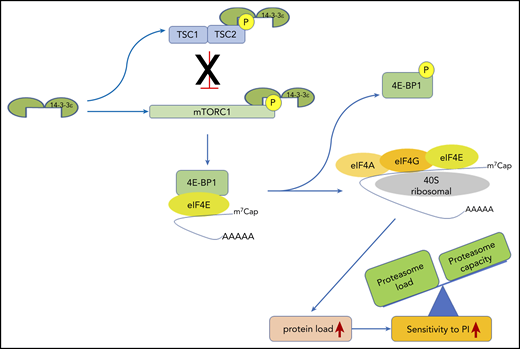
14-3-3ε functional model in MM. 14-3-3ε induces the activation of mTORC1 through binding and inhibition of the TSC1/TSC2, complex as well as directly interacting and promoting phosphorylation of the mTORC1 subunit mTOR. On activation, mTORC1 phosphorylates 4E-BP1 releasing eIF4E, to allow cap-dependent mRNA translation. As a consequence, MM cell protein load increases, shifting the load/capacity balance and resulting in enhanced sensitivity to PIs.
14-3-3ε functional model in MM. 14-3-3ε induces the activation of mTORC1 through binding and inhibition of the TSC1/TSC2, complex as well as directly interacting and promoting phosphorylation of the mTORC1 subunit mTOR. On activation, mTORC1 phosphorylates 4E-BP1 releasing eIF4E, to allow cap-dependent mRNA translation. As a consequence, MM cell protein load increases, shifting the load/capacity balance and resulting in enhanced sensitivity to PIs.
This association among 14-3-3ε expression, PI sensitivity, and M protein production was further confirmed in primary MM cells from 2 independent data sets. In MM patient cells, decrease or loss of 14-3-3ε, as observed in patients with MM with del17p, correlated with M protein production and response to BTZ-based therapy. Studies have shown association between sensitivity to PI with Ig production and proteasome capacity.32 Recently, Qin et al.49 have reported a significantly longer median progression-free survival and overall survival in patients with MM treated with BTZ-based therapy with secretory disease than those with oligo- or nonsecretory disease (progression-free survival: 33 vs 16 months; overall survival: 58 vs 27 months, respectively; P < .001), suggesting that the protein load is an important feature driving PI sensitivity in patients. Using this cohort of patients, we have evaluated the protein load in patients with del17p MM and observed a significantly lower monoclonal protein level in patients with del17p MM compared with others, which may provide an explanation for the inability of BTZ to overcome high-risk feature associated with del17p.
Together with other recent observations,34 a general role for the 14-3-3 proteins can be considered in modulating the load/capacity balance in MM cells, with different isoforms executing different functions. Our study suggests that molecular determinants of protein load such as 14-3-3ε may have an important effect on clinical outcome and may function as a biomarker of PI sensitivity in MM.
For the original data, please contact nikhil_munshi@dfci.harvard.edu.
The publication costs of this article were defrayed in part by page charge payment. Therefore, and solely to indicate this fact, this article is hereby marked “advertisement” in accordance with 18 USC section 1734.
The online version of this article contains a data supplement.
Acknowledgments
This work was supported by Department of Veterans Affairs Merit Review Award I01BX001584 (N.C.M.), National Institutes of Health, National Cancer Institute grant P01-155258-07 (M.F., K.C.A., M.K.S., and N.C.M.), National Institutes of Health, National Cancer Institute Spore grant 5P50CA100707 (N.C.M., M.K.S., and K.C.A.), the Adelson Foundation (K.C.A. and N.C.M.), and National Science Foundation of China grants 81920108006 and 81630007 (L.Q.).
Authorship
Contribution: Y.X., M.F., L.Q., and N.C.M. designed the study and wrote the manuscript; Y.X., M.H., S.D., L.L., K.W, T.Y., and S.D. performed the in vitro experiments; Y.X., C.C., Y.Y., S.M., and E.M. performed the animal experiments; Y.X. and M.F. analyzed the data; M.K.S. performed gene expression and patient RNA-seq analysis; Z.C., L.Z., E.M., N.L., M.A.L., T.P., G.A., R.A., G.B., and Y.-T.T. provided reagents and helped with data analysis; and M.F., K.C.A., L.Q., and N.C.M. provided critical evaluation of experimental data and manuscript.
Conflict-of-interest disclosure: N.C.M. serves on advisory boards/consultant to Takeda, BMS, Janssen, Amgen, AbbVie, Oncopep, Karyopharm, Adaptive Biotechnology, and Novartis and holds equity ownership in Oncopep. K.C.A. serves on advisory boards to Celgene, Takeda, BMS, and Gilead and holds equity ownership in Oncopep and Acetylon. The remaining authors declare no competing financial interests.
Correspondence: Mariateresa Fulciniti, Dana-Farber Cancer Institute, 440 Brookline Ave, Boston, MA 02115; e-mail: mariateresa_fulciniti@dfci.harvard.edu; Lugui Qiu, Institute of Hematology and Blood Diseases Hospital, Chinese Academy of Medical Sciences and Peking Union Medical College, Tianjin, China 300020; e-mail: qiulg@ihcams.ac.cn; Nikhil C. Munshi, Dana-Farber Cancer Institute, 440 Brookline Ave, Boston, MA 02115; e-mail: nikhil_munshi@dfci.harvard.edu.
