

Key Points
Mutant TP53 MDS and sAML have altered regulation of select checkpoint molecules.
Targeting the proposed mir-34a-MYC-PDL1 circuit in patients with TP53 mutations represents a novel therapeutic strategy.

Abstract
Somatic gene mutations are key determinants of outcome in patients with myelodysplastic syndromes (MDS) and secondary AML (sAML). In particular, patients with TP53 mutations represent a distinct molecular cohort with uniformly poor prognosis. The precise pathogenetic mechanisms underlying these inferior outcomes have not been delineated. In this study, we characterized the immunological features of the malignant clone and alterations in the immune microenvironment in patients with TP53-mutant and wild-type MDS or sAML. Notably, PDL1 expression is significantly increased in hematopoietic stem cells of patients with TP53 mutations, which is associated with MYC upregulation and marked downregulation of MYC’s negative regulator miR-34a, a p53 transcription target. Notably, patients with TP53 mutations display significantly reduced numbers of bone marrow–infiltrating OX40+ cytotoxic T cells and helper T cells, as well as decreased ICOS+ and 4-1BB+ natural killer cells. Further, highly immunosuppressive regulatory T cells (Tregs) (ie, ICOShigh/PD-1−) and myeloid-derived suppressor cells (PD-1low) are expanded in cases with TP53 mutations. Finally, a higher proportion of bone marrow–infiltrating ICOShigh/PD-1− Treg cells is a highly significant independent predictor of overall survival. We conclude that the microenvironment of TP53 mutant MDS and sAML has an immune-privileged, evasive phenotype that may be a primary driver of poor outcomes and submit that immunomodulatory therapeutic strategies may offer a benefit for this molecularly defined subpopulation.
Introduction
Myelodysplastic syndromes (MDSs) represent a spectrum of hematopoietic stem cell malignancies that are characterized by dysplastic and ineffective hematopoiesis, with risk for transformation to secondary acute myeloid leukemia (sAML). Molecular characterization of MDS and sAML via next-generation sequencing (NGS) has significantly advanced our understanding of the pathogenetic alterations in these malignancies. In this regard, TP53 mutant MDS and sAML have emerged as molecular cohorts with profoundly inferior outcomes regardless of treatment, with a median overall survival (OS) of only 6 to 12 months.1,2 Further, TP53 mutations are independent covariates for inferior OS with the only available disease-modifying therapies (ie, treatment with hypomethylating agents [HMAs] and allogeneic hematopoietic stem cell transplantation [allo-HSCT]).3-7 Importantly, the mechanisms by which TP53 mutations drive these inferior outcomes have not been resolved.
The endogenous antitumor immune response involves a complex interplay between activating and inhibitory receptors that control the functions of specific immune cell subsets. The most well-described inhibitory immune checkpoint is the interaction of programmed death 1 (PD-1) receptor with PD-ligand-1 (PDL1), where initial clinical activity was observed across multiple solid tumor types.8-11 Clinical trials of checkpoint inhibitors in myeloid malignancies are under way, yet these trials have shown limited activity, where single-agent responses are largely restricted to post allo-HSCT relapse.12,13 In addition, only a few studies have characterized expression and relevance of immune checkpoints in myeloid malignancies, and none have evaluated checkpoint expression relative to the molecular drivers of these diseases. Aberrant upregulation of several immune checkpoints (including PD-1, PD-L1, and CTLA4) in CD34+ cells has been reported in 34% of patients with MDS,14 and, of therapeutic importance, checkpoint upregulation occurs after treatment with HMA, thereby providing a potential resistance mechanism to the only disease-modifying agent available in higher risk MDS. In addition, PDL1 expression on MDS myeloblasts was shown to be increased in higher risk MDS compared with lower risk patients,15 and increased PD-1/PDL1 expression are also independent covariates for poor OS in AML.16
MDS and sAML that arises from higher risk MDS are genetically heterogeneous and the array of mutations in these diseases likely has differential effects on checkpoint expression or function. Therefore, we comprehensively characterized checkpoint molecules by lineage and stage of maturation in MDS/sAML to discern possible relationships with immune cell subsets in molecularly defined cohorts, and in particular to define those that are associated with TP53 mutant vs wild-type cases. Collectively, these data provide valuable insight to potentially optimize treatment strategies in molecularly defined, poor-risk populations.
Methods
Patients with MDS or sAML
The cohort was obtained from patients at Moffitt Cancer Center (MCC) who had NGS performed at the time of sample acquisition and who had a diagnosis of MDS, sAML, or chronic myelomonocytic leukemia (CMML) according to criteria of the World Health Organization (WHO).17 From September 2012 to October 2017, bone marrow mononuclear cells (BM-MNCs) from 103 patients; 30 and 73 patients had TP53 mutations or the wild-type gene, respectively. Clinical variables, interval treatments, and outcomes were captured at the time of NGS sample procurement and the Revised International Prognostic Scoring System (IPSS-R) score was calculated at the initial NGS assessment.18 Treatments included HMA, intensive chemotherapy, and allo-HSCT, and cohorts were also categorized as treatment-naive and HMA therapy failure. This study was approved by the MCC Scientific Review Committee and Institutional Review Board and was conducted in accordance with the Declaration of Helsinki. In addition, data from The Cancer Genome Atlas for AML (TCGA AML) were downloaded from the TCGA portal (http://tcga-data.nci.nih.gov/).19 Somatic mutations in TP53 were retrieved from the cBioPortal with 14 and 148 patients with TP53 mutations and wild-type gene, respectively (http://www.cbioportal.org/). As an independent validation cohort of checkpoint upregulation in patients with TP53-mutant vs wild-type AML (n = 168; 13% sAML, 75% with intermediate/adverse cytogenetics; 30 and 138 patients in the TP53 mutation and wild-type groups, respectively) were obtained from the Munich Leukemia Laboratory.20
Gene mutation analysis
Targeted amplicon-based NGS of up to 37 myeloid genes was performed (ABL1, ASXL1, BCOR1, CBL, CDKN2A, CEBPA, CSF3R, CUX1, DNMT3A, ETV6, EZH2, FLT3, GATA2, IDH1, IDH2, JAK2, KDM6A, KIT, KMT2A, KRAS, MPL, MYD88, NPM1, NRAS, PHF6, PTPN11, RUNX1, SETBP1, SF3B1, SH2B3, SRSF2, STAG2, TET2, TP53, U2AF1, WT1, and ZRSR2). Genomic DNA was isolated from BM or peripheral blood (PB) mononuclear cells. DNA samples were subjected to targeted genome sequencing on the Illumina HiSeq2000 system. We established filters for our pathogenic vs nonpathogenic call algorithm to determine clinically actionable pathogenic alterations and to exclude benign variants or polymorphisms, as previously described.1
Flow cytometry
Cryopreserved BM-MNCs from MCC patients with MDS/AML were used for all flow cytometry assays. Data were acquired with an LSRII flow cytometer (BD). See supplemental Methods (available on the Blood Web site) for detailed methodology, antibody table, gating strategy, and unsupervised clustering analyses.
RNA and miRNA expression analysis
Total RNA was extracted from cryopreserved BM-MNCs from patients with MDS at MCC and from patients with available RNA who had flow cytometric analysis, by using the Qiagen miRNeasy Mini Kit according to the manufacturer’s protocol. RNA concentration and integrity were verified with ND-1000 spectrophotometer (NanoDrop Technologies) and 2100 Bioanalyzer (Agilent Technologies). As a validation cohort, BM RNA was obtained from 213 WHO-defined patients with MDS at the time of diagnosis, as well as from 20 healthy donors from the National Taiwan University Hospital. The miRNA expression profiles were generated with the NanoString nCounter Human v3 miRNA Expression Assay Kit, which includes probes for 800 commonly expressed microRNAs (NanoString Technologies, Seattle WA). See supplemental Methods for details on processing and analysis.
CRISPR-Cas9 TP53 mutant cell line models
As described previously, CRISPR-Cas9 was used to generate an isogenic human leukemia cell line (ie, MOLM-13 cells) with the most common TP53 missense mutations, as well as with null mutation.21 Cells were treated for 24 hours with 100 nM daunorubicin hydrochloride (Sigma) to induce DNA damage, thereby activating p53. PDL1, MYC, and miR-34a expression were quantified by quantitative polymerase chain reaction.
Statistical analysis
The Mann-Whitney correlation test was applied to measure the strength of the association between TP53 mutation status and PDL1 (CD274), PDL2 (PDCD1LG2), and CTLA4 messenger RNA (mRNA) levels. The Mann-Whitney U test, Student t test, Fisher’s exact test, Wilcoxon signed-rank test, and Kruskal-Wallis test were used for comparative analyses of immune checkpoint protein expression by flow cytometry. Median values of each checkpoint were calculated to compare outcomes of patients with expression values above or below the median. Survival analyses were evaluated by the Kaplan-Meier method, and curves were compared by log-rank test. OS was defined as the time from the NGS evaluation/sample acquisition to the date of death or last follow-up. Multivariate Cox regression models were created to adjust for clinical and treatment characteristics in the total cohort. All tests were 2-sided and were considered statistically significant if P ≤ .05. All analyses were performed with GraphPad Prism (ver.7.03) and SPSS (ver. 25). The Pearson correlation was used to measure the correlation between PD-L1 positivity in HSCs and MYC expression.
Results
The possible relationships between immune checkpoint expression in MDS and AML and the driver mutations of these malignancies have not been explored.14,22 Furthermore, the expression studies that have been performed have focused on mRNA rather than on protein expression, which is a significant caveat, as the expression of checkpoint mRNAs and their cognate proteins is often discordant in solid-tumor models.23 Thus, we addressed whether driver mutations of MDS/sAML, specifically TP53 mutations, are associated with differential checkpoint expression.
PDL1 and CTLA4 expression connotes poor survival in TP53 mutant MDS/sAML
We initially interrogated the AML cancer genome atlas (TCGA) data set and obtained a validation cohort from the Munich Leukemia Laboratory to determine if checkpoint dysregulation (ie, z-score > or <2) manifests in patients with the TP53 mutation in comparison with patients with the wild-type gene, by gene expression profiling. Notably, upregulation of the immune checkpoints PDL1, PDL2, and CTLA4 was found in 20% to 36% of patients with the TP53 mutation in both data sets vs only 5% to 7% of those with wild-type TP53 (supplemental Figure 1). Importantly, patients with checkpoint upregulation (ie, PDL1, PDL2, and CTLA4) had inferior OS in the TCGA data set (median OS, 6 vs 19 months; P = .007). In the TCGA data set, PDL1 and CTLA4, but not PDL2, were significantly increased in patients with TP53 mutations (P < .0001), which was confirmed in the validation cohort for CTLA4 (P = .003) and accompanied by a trend toward validation for PDL1 (P = .07; supplemental Figure 2).
To further address regulation of immune checkpoints relative to TP53 status in MDS and sAML, we evaluated the entire MCC study cohort (n = 103). Patient characteristics are shown in Table 1 and are stratified by TP53 mutation status, with 30 patients in the mutation group and 73 in the wild-type group. The median age of the TP53 mutant cohort was significantly lower than that of the TP53 wild-type cohort (68 vs 76 years of age; P = .008), and there was a trend toward a higher percentage of women in the TP53 mutant cohort (50% vs 37%; P = .27). As mutant TP53 disease was strongly associated with high-grade myeloid neoplasms, patients with TP53 mutations had a significantly higher percentage of sAML (60% vs 24%, P = .008) that was associated with a higher BM blast percentage and more severe thrombocytopenia (Table 1; P < .01). Accordingly, 95% of the TP53 mutation cohort had higher risk disease by IPSS-R criteria (ie, intermediate to very high risk) whereas 60% of the wild-type TP53 cohort was at higher risk. The median number of mutations in the TP53 mutation cohort was significantly less than in the wild-type cohort (P = .04), in accordance with previous findings.2,24 The median TP53 variant allele frequency (VAF) was 52%, with 95% of patients having a high allele burden (ie, ≥ 20%). There were no significant differences in the distribution of treated or treatment-naive cases analyzed by flow cytometry. Specifically, 56% (n = 17) and 51% (n = 37) of patients in the TP53 mutation and wild-type cohorts, respectively, were treatment naive. In addition, there were no significant differences in HMA status (naive vs refractory vs receiving active treatment) or allo-HSCT (Table 1). The median OS of the TP53 mutant cohort was significantly inferior to that of the wild-type cohort, 5.5 vs 19 months (P < .0001).
Baseline characteristics of the study population
| TP53 mutant (n = 30) | TP53 wild type (n = 73) | |
|---|---|---|
| Median age (range), y** | 68 (47-86) | 76 (37-96) |
| Male | 15 (50) | 46 (63) |
| Female | 15 (50) | 27 (37) |
| WHO subtype | ||
| MDS | 12 (40) | 47 (64) |
| sAML** | 18 (60) | 19 (26) |
| CMML | 0 | 7 (10) |
| Median hemoglobin (range), g/dL | 8.6 (6.6-19) | 9 (6.7-15.3) |
| Median platelets (range), × 109/L** | 58 (7-208) | 95 (3-1093) |
| Median ANC (range) | 1.52 (0.2-13.77) | 2 (0.08-20.02) |
| Median BM blast % (range)** | 24.5 (1-70) | 10 (0-80) |
| IPSS-R (< 30% blasts) | ||
| Very low | 1 (5) | 6 (10) |
| Low | 19 (30) | |
| Intermediate | 14 (22) | |
| High | 3 (14) | 14 (22) |
| Very high | 17 (81) | 10 (16) |
| Median TP53 VAF (range), % | 52 (6-94) | N/A |
| Median mutations, n* | 1 (1-3) | 2 (0-7) |
| Time of flow assessment | ||
| Prior to first line treatment | 17 (56) | 37 (51) |
| HMA therapy | ||
| HMA naive | 16 (53) | 45 (62) |
| HMA relapse/refractory | 11 (37) | 20 (27) |
| On HMA | 3 (10) | 8 (11) |
| Allo-HSCT | 8 (27) | 19 (26) |
| Median OS, mo**** | 5.5 | 19.9 |
| Median follow-up, mo | 41.9 mo | 39.4 |
Total population, N = 103. Unless stated otherwise, data are expressed as number of patients in the subgroup (percentage of subgroup).
ANC, absolute neutrophil count; N/A, not applicable.
P < .05; **P < .01; ****P < .0001.
HSCs are increased and overexpress PDL1 in TP53 mutant MDS/sAML
The median percentage of cell populations expressing the immune checkpoints analyzed in both myeloid and T-cell populations stratified by TP53 mutation status are summarized in Table 2. In evaluation of total cell populations between the TP53 mutation and wild-type groups, there were no significant differences in any myeloid, T-cell, or natural killer (NK) cell population, with the exception of an increase in the HSC population in TP53 mutant specimens (P < .01; supplemental Figure 3). Analysis of PDL1 expression in myeloid populations showed significant heterogeneity throughout myeloid cell populations (range, 0.25% to 99.5%; Figure 1A). Notably, in HSCs there was a significant increase in the proportion of PDL1+cells in TP53 mutant specimens compared with wild-type specimens (16.3% vs 10.9%; P < .01; Figure 1A; representative flow plot in Figure 1B). In addition, the proportion of cells expressing PDL1 was increased in hematopoietic progenitor cells (HPCs), although it did not reach statistical significance (20.7% vs 10.2%; P = .34). PDL1 expression was high in erythroid precursors, with no significant difference between TP53 mutant and wild-type (median, 92.6% vs 93.2%; P = .63). As a continuous variable, PDL1 expression did not correlate with TP53 VAF, although the majority of patients with TP53 mutations had high VAFs (Table 1). In contrast, PD-1 expression was markedly reduced across myeloid cell populations in the TP53 mutation vs the wild-type group (P < .0001 for HSC, HPC, and erythroid populations; Figure 1C; supplemental Figure 4). There was no significant difference in TIM-3 expression in myeloid cell populations with PDL2 expression in <2% of all populations analyzed (Table 2).
Immune checkpoint expression in TP53 mutant vs wildtype (WT) patients
| TP53 WT | TP53 mutant | P* | |
|---|---|---|---|
| Stem cells (CD3−, CD11b−, CD14−, CD34+, CD38−) | |||
| PD-1 | 1.33 (0-30.6) | 0.14 (0-5.79) | <.0001 |
| PDL1 | 10.9 (0.63-60.8) | 16.3 (1.92-71.7) | .0092 |
| PDL2 | 0.3 (0-14.6) | 0.094 (0-40.5) | .4005 |
| TIM-3 | 1.3 (0-34.7) | 3.86 (0.24-5.92) | .3902 |
| Progenitor cells (CD3−, CD11b−, CD14−, CD34+, CD38+) | |||
| PD-1 | 1.29 (0.039-13.1) | 0.32 (0-4.21) | <.0001 |
| PDL1 | 10.2 (0.25-56.5) | 20.7 (0.31-64.7) | .3350 |
| PDL2 | 0.91 (0.065-12.3) | 0.45 (0.11-3.06) | .0010 |
| TIM-3 | 3.64 (0.46-46.2) | 6.97 (0.89-7.69) | .6059 |
| G-MDSCs (CD3−, CD33+, CD38−, CD11b+, CD14−) | |||
| PD-1 | 24.75 (0.13-82.5) | 16.9 (0.5-59.9) | .0015 |
| PDL1 | 76.1 (0.35-98.7) | 77.6 (20.3-97.6) | .5100 |
| PDL2 | 0.42 (0-8.9) | 0.74 (0-4.64) | .1908 |
| TIM-3 | 9.8 (1.42-46.6) | 13.65 (5.72-43.5) | .3272 |
| Erythroid cells (CD3−, CD71+) | |||
| PD-1 | 27.9 (3.64-67.8) | 8.66 (0.09-41.4) | <.0001 |
| PDL1 | 92.6 (5.85-99.5) | 93.2 (24.2-99.5) | .6328 |
| PDL2 | 0.96 (0.15-11.5) | 1.02 (0.079-5.23) | .8005 |
| TIM-3 | 8.69 (0.95-44.1) | 8.26 (2.23-24.9) | .7046 |
| Myeloid cells (CD33+) | |||
| PD-1 | 7.78 (0.18-52.5) | 4.8 (0.33-27.2) | .0035 |
| PDL1 | 18.8 (0.6-92.3) | 31.3 (1.53-64.7) | .0874 |
| PDL2 | 2.56 (0.36-15.2) | 1.85 (0.18-8.8) | .0848 |
| TIM-3 | 11.5 (0.99-70.9) | 10.2 (5.28-21.9) | .4344 |
| All T cells (CD3+) | |||
| PD-1 | 5.465 (1.37-43) | 4.485 (0.64-21.1) | .0645 |
| TIM-3 | 1.74 (0.17-15.8) | 1.9 (0.35-9.72) | .6191 |
| LAG-3 | 0.51 (0.037-13.3) | 0.315 (0.025-2.54) | .0093 |
| OX-40 | 7.195 (1.11-28.5) | 3.2 (0.95-30.8) | <.0001 |
| CTLA-4 | 0.235 (0.043-5.22) | 0.13 (0.027-1.74) | .0004 |
| 4-1BB | 12.2 (1.28-39.1) | 13.1 (0.26-63.3) | .99 |
| ICOS | 7.15 (0.29-34.4) | 12.7 (0.77-42.3) | .0097 |
| Cytotoxic T cells (CD3+, CD8+) | |||
| PD-1 | 26.9 (10.1-59.6) | 24.15 (2.14-49) | .0754 |
| TIM-3 | 1.59 (0.091-16.8) | 1.55 (0.12-9.34) | .5061 |
| LAG-3 | 0.485 (0.061-9.39) | 0.245 (0-7.01) | .0045 |
| OX-40 | 6.435 (1.27-30.2) | 2.34 (0.54-14) | <.0001 |
| CTLA-4 | 0.105 (1-6.43) | 0.0445 (0-0.7) | .0157 |
| 4-1BB | 19.65 (2.2-85.8) | 37.85 (0.62-77.5) | .1546 |
| ICOS | 1.43 (0.18-30.9) | 4.93 (0.046-28) | .0008 |
| Helper T cells (CD3+, CD4+) | |||
| PD-1 | 4.33 (0.78-42.1) | 3.725 (0.49-15.9) | .0647 |
| TIM-3 | 2.12 (0.18-22.1) | 2.15 (0.45-10.5) | .5358 |
| LAG-3 | 0.695 (0.036-18.4) | 0.39 (0.029-2.91) | .0167 |
| OX-40 | 7.675 (1.04-35.2) | 3.75 (1.23-35.1) | .0002 |
| CTLA-4 | 0.225 (0.025-5.62) | 0.13 (0.026-1.71) | .0028 |
| 4-1BB | 7.675 (0.73-31) | 5.475 (0.2-67.2) | .1621 |
| ICOS | 11.3 (0.84-45.7) | 18.05 (1.5-57) | .0131 |
| Treg cells (CD3+, CD4+, CD25+, CD127low/−) | |||
| PD-1 | 5.195 (0.89-72.5) | 3.58 (0.4-17.6) | .0178 |
| TIM-3 | 4.72 (0.28-70.9) | 2.85 (1.9-11.6) | .2035 |
| LAG-3 | 2.425 (0.069-62.3) | 1.865 (0.049-16.7) | .0965 |
| OX-40 | 10.4 (1.54-46.2) | 5.82 (2.17-39.6) | .0128 |
| CTLA-4 | 1.3 (0.14-18.2) | 0.75 (0.16-9.35) | .0702 |
| 4-1BB | 10.85 (1.95-70.9) | 6.01 (1.29-29.4) | .0038 |
| ICOS | 14.45 (1.41-68.4) | 16.85 (2.17-48.4) | .0854 |
| NK cells (CD3−, CD56+) | |||
| PD-1 | 3.69 (0.43-36.2) | 1.94 (0.098-22.5) | .0072 |
| TIM-3 | 4.11 (0-38.5) | 4.31 (2.13-18.4) | .6334 |
| LAG-3 | 1.58 (0-27.5) | 0.765 (0-29.8) | .0038 |
| OX-40 | 15.3 (1.23-77.5) | 4.1 (0.28-41.9) | <.0001 |
| CTLA-4 | 0.54 (0.016-18.6) | 0.25 (1-4.08) | .0298 |
| 4-1BB | 9.95 (1.24-47) | 5.005 (0.36-33) | .0023 |
| ICOS | 0.57 (0-8.35) | 0.52 (0.13-3.63) | .5216 |
Data are expressed as the median percentage of positivity and the range of each checkpoint is listed with P values via Mann-Whitney U tests, with significant differential expression set in bold.
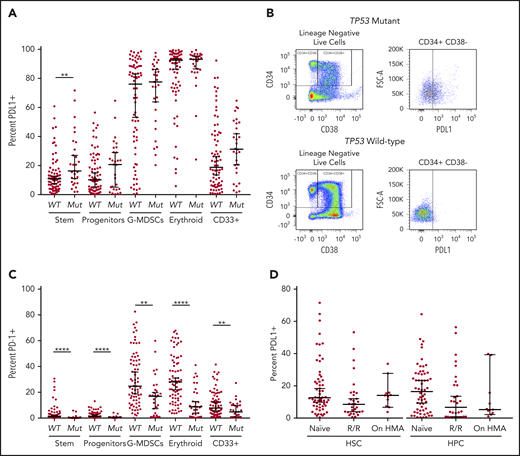
Cell surface immune checkpoint expression. Expression on HSCs (CD3−, CD11b−, CD14−, CD34+, CD38−), HPCs (CD3−CD11b−, CD14−, CD34+, CD38+), G-MDSCs (CD3−, CD33+, CD38−, CD11b+, CD14−), erythroid (CD3-, CD71+), and CD33+ cells was determined by flow cytometry. (A) PDL1 expression in TP53 mutant (Mut) vs wild-type (WT) myeloid populations. (B) Representative dot plot of increased PDL1 expression in TP53 mutant HSCs. (C) PD-1 expression TP53 mutant vs wild-type myeloid populations. (D) PDL1 expression in HSCs and HPCs based on HMA treatment status. g-MDSCs, granulocytic myeloid-derived suppressor cells. **P ≤ .01, ****P < .0001.
Cell surface immune checkpoint expression. Expression on HSCs (CD3−, CD11b−, CD14−, CD34+, CD38−), HPCs (CD3−CD11b−, CD14−, CD34+, CD38+), G-MDSCs (CD3−, CD33+, CD38−, CD11b+, CD14−), erythroid (CD3-, CD71+), and CD33+ cells was determined by flow cytometry. (A) PDL1 expression in TP53 mutant (Mut) vs wild-type (WT) myeloid populations. (B) Representative dot plot of increased PDL1 expression in TP53 mutant HSCs. (C) PD-1 expression TP53 mutant vs wild-type myeloid populations. (D) PDL1 expression in HSCs and HPCs based on HMA treatment status. g-MDSCs, granulocytic myeloid-derived suppressor cells. **P ≤ .01, ****P < .0001.
As TP53 mutations are highly concordant with higher risk MDS, as defined by the IPSS-R, as well as secondary leukemic transformation, we subsequently analyzed whether the immune checkpoint alterations were predominantly related to disease progression, BM blast percentage, or both, as opposed to being a feature specific to the underlying mutation. In the total cohort, there was no difference in PDL1 expression in HSCs based on disease subtype of MDS compared with AML or CMML (supplemental Figure 5A). As all but 1 patient with TP53 mutations had higher risk MDS according to IPSS-R (ie, high or very high), we analyzed differential expression of PDL1 in lower vs higher risk patients in the TP53 wild-type cohort. Similarly, there was no difference in PDL1 expression of HSCs in higher vs lower risk patients with MDS (P = .85; supplemental Figure 5B). We additionally analyzed PDL1 expression on HSCs in relation to BM blast percentage. Importantly, regression analysis showed no correlation between PDL1 expression and increasing BM blast percentage in the total cohort (R2 = 0.0002; P = .89; supplemental Figure 6A). There was also no relationship between PDL1 expression level and percentage of BM blasts in either the TP53 mutation or TP53 wild-type group (supplemental Figure 6B-C). Importantly, the differences in both PDL1 and PD-1 expression were specific for the TP53 mutation subgroup and were consistent in both the MDS and sAML cohorts (supplemental Table 1).
As HMA therapy has been shown to upregulate immune checkpoint ligands such as PDL1 in vitro,14 we analyzed PDL1 expression in HSC and HPC populations according to HMA exposure. There was no difference in PDL1 expression in HSC/HPC in patients who were HMA naive vs relapse/refractory (R/R) to HMA or actively receiving HMA therapy (P = .48 and P = .84 for naive and R/R, respectively; Figure 1D). Notably, HMA treatment status was not associated with any change in checkpoint expression. Additional analyses were performed based on TP53 mutation status. In patients with TP53 mutations, there was no difference in PDL1 expression in HMA-naive vs R/R vs patients receiving HMA therapy (supplemental Figure 7). However, in patients with wild-type TP53, there was a significant decrease in PDL1 expression in R/R compared with that in naive patients in both the HSC and HPC populations (P = .021 and P = .058; supplemental Figure 7).
Increased ICOSHighPD-1− regulatory T (Treg) cells and reduced OX40+ CTLs/TH cells are hallmarks of mutant TP53 MDS/sAML
Analyses of immune checkpoint expression in lymphocyte subsets in BM-MNC of wild-type vs mutant TP53 MDS/sAML revealed that although PD-1 expression was profoundly decreased in all myeloid cell populations in the TP53 mutation cohort, there were no significant differences in PD-1 expression in total T-cell, cytotoxic T-lymphocytes (CTLs) and T-helper (Th) cell populations (Figure 2A). However, PD-1 expression was modestly reduced in both Treg and NK cell populations.
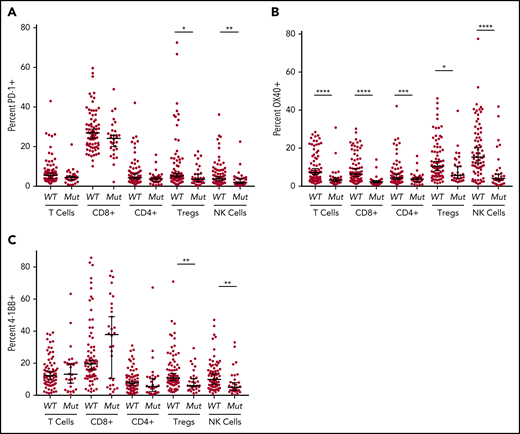
Flow cytometric analysis of immune checkpoint markers. Expression on T cells (CD3+), cytotoxic T cells (CD3+, CD8+), helper T cells (CD3+, CD4+), Tregs (CD3+, CD4+, CD25+, CD127low/−), and NK cells (CD3−, CD56+) was determined by flow cytometry. PD-1 (A), OX-40 (B), and 4-1BB (C) expression in patients with TP53 mutations vs patients with the wild-type gene. *P ≤ .05, **P ≤ .01, ***P ≤ .001, ****P < .0001.
Flow cytometric analysis of immune checkpoint markers. Expression on T cells (CD3+), cytotoxic T cells (CD3+, CD8+), helper T cells (CD3+, CD4+), Tregs (CD3+, CD4+, CD25+, CD127low/−), and NK cells (CD3−, CD56+) was determined by flow cytometry. PD-1 (A), OX-40 (B), and 4-1BB (C) expression in patients with TP53 mutations vs patients with the wild-type gene. *P ≤ .05, **P ≤ .01, ***P ≤ .001, ****P < .0001.
OX40 is a costimulatory receptor that augments adaptive immunity in the setting of antigen exposure via its interaction with OX40 ligand (CD252).25 Notably, OX40 expression was markedly reduced in all lymphocyte populations of patients with TP53 mutations (P < .0001; Figure 2B), although with only minimal reduction in Treg cells (P = .0128). In contrast, there were no significant differences in expression of the costimulatory activating receptor 4-1BB between the TP53 mutant and wild-type cohorts in total T cells, Th cells, or CTLs. However, there was significantly reduced expression of 4-1BB in TP53 mutant Treg and NK cells (P < .01; Figure 2C).
ICOS is a costimulatory T-cell receptor that directs tumor immunity by stimulating T cells including CTLs and Th cells, while having the capacity to promote immune evasion by stimulating Treg cells.26 ICOS expression was significantly increased in CTL and Th populations in patients with TP53 mutations vs wild-type (P < .01 and P < .001, respectively; Figure 3A) and there were no differences in ICOS expression in Treg or NK cell populations. Notably, patients with TP53 mutations had significantly elevated levels of highly immunosuppressive ICOSHigh/PD-1− Treg cells27,28 compared with the wild-type group, although this population represented only 1% of all T cells in the BM (P < .001; Figure 3B; supplemental Figure 8). Although our analyses evaluated the differential percentage positivity of immune checkpoints in patients with TP53 mutations vs wild-type TP53, we performed unsupervised clustering analyses via phenograph to identify unique patterns of immune checkpoint expression in T-cell subsets of patients with TP53 mutations. Overall, CTLs in the TP53 mutation group were characterized as ICOS+/4-1BB+/PD-1+ whereas the Th cells were ICOS+ and the Treg cells were ICOS+/PD-1low (supplemental Figure 9).
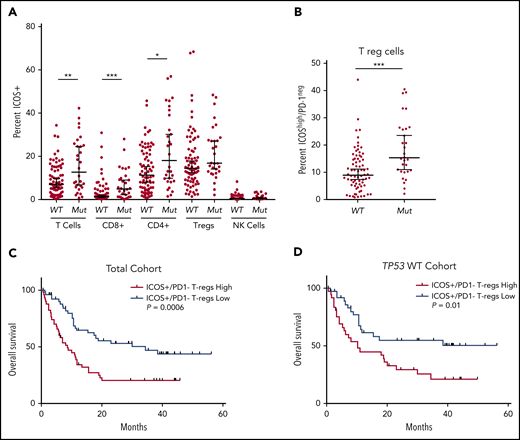
Differential expression of ICOS in patients with TP53 mutations vs the wild-type gene and impact on overall survival. (A) Flow cytometric analysis of ICOS expression on T-cell subsets and NK cells. (B) ICOShigh/PD-1− expression in Tregs of patients based on TP53 mutation status. (C-D) OS in patients based on percentage of ICOShigh/PD-1− Tregs in the total cohort (C) and the TP53 wild-type cohort (D). *P ≤ .05, **P ≤ .01, ***P ≤ .001.
Differential expression of ICOS in patients with TP53 mutations vs the wild-type gene and impact on overall survival. (A) Flow cytometric analysis of ICOS expression on T-cell subsets and NK cells. (B) ICOShigh/PD-1− expression in Tregs of patients based on TP53 mutation status. (C-D) OS in patients based on percentage of ICOShigh/PD-1− Tregs in the total cohort (C) and the TP53 wild-type cohort (D). *P ≤ .05, **P ≤ .01, ***P ≤ .001.
Increased tumor infiltrating ICOSHigh/PD-1− Treg cells are linked to inferior OS in hepatocellular carcinoma.29 Thus, we assessed the prognostic impact of ICOSHigh/PD-1− distribution (ie, ≥ vs < median) in MDS and sAML. In the total cohort, patients with increased BM ICOSHigh/PD-1− populations had significantly reduced OS (median OS, 8.6 months vs 34.3 months; hazard ratio [HR], 2.34; P = .0006; Figure 3C). In the TP53 wild-type cohort, patients with increased ICOSHigh/PD-1− populations also had inferior OS (median OS, 10.2 months vs not reached; HR, 2.19; P = .01; Figure 3D). Finally, in a multivariate analysis that included age, HSCT status, failed HMA therapy, and IPSS-R category, increased ICOS+/PD-1− Tregs remained an independent covariate for inferior OS in the total cohort (HR, 1.81; 95% confidence interval [CI], 1.08-3.04; P = .03), although it was no longer significant in patients with the wild-type TP53 gene (HR, 1.41; 95% CI, 0.74-2.69; P = .3).
The miR-34a/MYC/PDL1 circuit is upregulated in mutant TP53 MDS/sAML
The MYC oncogenic transcription factor promotes immune evasion by inducing PDL1 expression.30 As PDL1 was the only immune checkpoint upregulated in TP53 mutant HSCs, we investigated whether this change was associated with elevated MYC. Notably, MYC was significantly upregulated in the TP53 mutation vs the wild-type group (P = .03; Figure 4A), which was confirmed in the validation cohort (P < .0001; Figure 4B). Furthermore, the percentage positivity of PDL1 on MDS HSC positively correlated with MYC expression (P = .004; r = 0.615; Figure 4C).
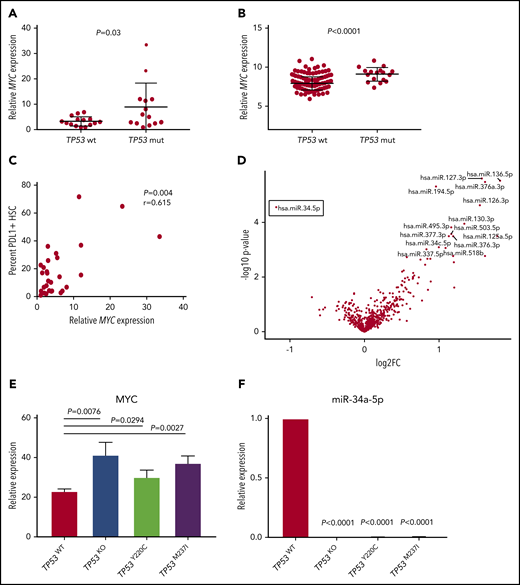
Differential miR34a-MYC-PDL1 expression in TP53 mutant vs wild-type MDS/sAML. Relative MYC expression as measured by quantitative polymerase chain reaction (qPCR) in the MCC cohort (A) and validation cohort (B). (C) Correlation of MYC expression with the percent of HSCs expressing cell surface PDL1 in the MCC cohort. (D) Volcano plot highlighting differential miRNA (false discovery rate <1) expression in patients with TP53 mutations vs the wild-type gene. Relative MYC (E) and miR-34a-5p (F) expression in isogenic TP53 knockout (KO) and missense mutant cell lines. Error bars represent standard error of 3 replicates.
Differential miR34a-MYC-PDL1 expression in TP53 mutant vs wild-type MDS/sAML. Relative MYC expression as measured by quantitative polymerase chain reaction (qPCR) in the MCC cohort (A) and validation cohort (B). (C) Correlation of MYC expression with the percent of HSCs expressing cell surface PDL1 in the MCC cohort. (D) Volcano plot highlighting differential miRNA (false discovery rate <1) expression in patients with TP53 mutations vs the wild-type gene. Relative MYC (E) and miR-34a-5p (F) expression in isogenic TP53 knockout (KO) and missense mutant cell lines. Error bars represent standard error of 3 replicates.
MYC expression is negatively regulated by miR-34a, which targets MYC mRNA for degradation, and is a bona fide transcriptional target induced by wild-type p53.31-33 Thus, we assessed differential microRNA (miRNA) expression in BM-MNCs in our cohorts. Strikingly, miR-34a was the only miRNA that displayed significantly reduced expression in the TP53 mutant vs the wild-type group (false discovery rate = 0.02; P = .00003; Figure 4D), whereas there were multiple miRNAs that were upregulated (supplemental Table 2; Figure 4D).
To further elucidate that TP53 mutation leads to MYC overexpression and reduced miR-34a expression, we evaluated the respective expression of these genes in an isogenic human leukemia cell line with the introduction of common missense TP53 mutations, as recently described.21 Notably, the introduction of TP53 missense mutations and/or null allele (TP53 knockout) in MOLM-13 cells led to robust induction of MYC as well as complete elimination of miR-34a expression (Figure 4E-F), ultimately leading to induction of PDL1 (supplemental Figure 10).
Discussion
TP53 is the most frequently mutated gene among all malignancies; however, immune therapies targeting p53 neoantigens have shown minimal clinical efficacy. The investigations herein provide compelling evidence that TP53 mutant MDS and sAML are a subset of immunologically privileged diseases that is characterized by immune checkpoint dysregulation (Figure supplemental 11). Importantly, our analyses were performed on BM specimens, which provide in situ insight into the tumor immune microenvironment. This is important, as analyses of T-cell subsets in PB are not indicative of immune responses in either solid cancer or hematological tumor microenvirnoments.34,35 Notably, we identified the TP53 mutant molecular cohort as a subset that has significant differential immune checkpoint expression and notably lacks mutations in DNA methylation or spliceosome pathways that are common in MDS/sAML. Specifically, we identified significant upregulation of PDL1 in TP53 mutant MDS/sAML specimens. Importantly, the differential expression of PDL1 on HSCs was concordant with the presence of TP53 mutation and not disease subtype, IPSS-R classification, or BM blast percentage. In agreement with our data, recent studies have shown increased PDL1 expression on myeloblasts of patients with TP53 mutant vs wild-type AML, as well as increased PDL1 expression in patients with adverse cytogenetics, findings consistent with the ability of p53 mutations to transactivate MYC, a key regulator of PDL1 expression.34,36,37 Of importance, our findings expand on these data, by demonstrating that differences in PDL1 expression are largely restricted to HSCs, with no discernable difference in HPC or erythroid populations. Further, our results showed profound reductions in PD-1 expression in all myeloid subsets of patients with TP53 mutations. Although the role of PD-1 in hematopoietic stem/progenitor cells (HSPCs) is poorly understood, we recently reported that PDL1 can induce apoptosis in both HSPCs and erythroid PD-1+ populations, leading to ineffective hematopoiesis.38 Accordingly, it is possible that the PDL1High HSCs of TP53 mutant MDS/sAML trigger apoptosis of PD1+ HSPCs thereby depleting PD-1+ myeloid subsets in this disease subset.
PDL1 was the only immune checkpoint protein significantly upregulated in TP53 mutant HSCs. Notably, a recent lung cancer study found that TP53 mutation is associated with PDL1 upregulation and that the change is associated with repression of miR-34a.31 In particular, miR-34a directly binds the 3′ untranslated region of PDL1 mRNA, and delivery of miR-34a can suppress PDL1 expression and reverse T-cell exhaustion. Moreover, miR-34a negatively regulates the complex that induces or elongates MYC transcription, which directly induces PDL1 transcription.32,39 Thus, we propose that dysregulation of the miR-34a/MYC circuit promotes PDL1 expression in HSCs of mutant TP53 MDS/sAML. This model is in accord with recent findings in patients with AML, showing that miR-34a and PDL1 expression is negatively correlated and that miR-34a suppresses PDL1 mRNA levels.40 We note, however, that multiple miRNAs are significantly upregulated in patients with TP53 mutations vs patients with wild-type MDS/sAML, and future studies of their relevance are certainly warranted. MYC overexpression is sufficient to provoke tumorigenesis and inhibits antitumor immune responses via upregulation of PDL1 and the innate immune regulator CD47.30 Notably, recent data targeting CD47 with magrolimab in combination with azacitidine has shown high response rates in MDS and AML, with particularly high activity in TP53 mutant AML.41 How TP53 mutations alter CD47 expression and/or pro–eat me signals requires further investigation. As we have shown in 2 independent cohorts, the MYC-PDL1 circuit manifests in mutant TP53 MDS/sAML HSCs. In a critical finding, we have shown with CRISPR-Cas9 knock-in TP53 missense mutant cell lines that TP53 directly leads to both MYC overexpression and miR-34a downregulation, ultimately leading to PDL1 upregulation. These data are consistent with our recent findings that MYC is critical for S100A9-mediated PDL1 upregulation in MDS.38 As nearly all patients with TP53 mutations have molecularly detectable disease at the time of allo-HSCT,42 it is likely that PDL1 overexpression on HSCs of patients with TP53 mutations contributes to the inferior graft-versus-leukemia (GVL) response by donor T cells in this molecularly defined cohort,3-5,7 and therefore GVL response may be improved by targeting PDL1. As proof-of-principle activity of immunomodulatory therapy in TP53 mutant AML, recent data with the CD3xCD123 DART flotetuzumab showed antileukemic activity in 5 of 11 patients.43 We have provided evidence that the mir34a-MYC-PD-L1 signaling cascade is involved in enhanced PD-L1 expression in patients with TP53 mutations, but we acknowledge that there are other pathways involved in the upregulation of PD-L1, including other transcription factors that can bind and transactivate PD-L1, such as HIF1-α, NF-kB, AP-1, STAT 1/3, and that further exploration of these factors in MDS/AML is warrented.44
Objective responses to immune checkpoint therapy have been observed in only a small subset of patients with MDS/sAML, and insight into which subgroups may best benefit from immunotherapy is lacking. To date, the best predictive biomarker for response to PD1/PD-L1 targeted therapy in solid tumors is tumor cell PDL1 protein expression, which is poorly characterized in myeloid neoplasms,45 and notably, single agent PD-1 therapy with nivolumab in MDS for which HMA therapy failed yielded no objective responses.46 In contrast, single-agent ipilimumab has been reported to have a 30% overall response rate.46 Double-checkpoint therapy with nivolumab plus ipilimumab has been shown to be tolerable in the setting of HMA failure, with responses in 2 of 7 patients achieving complete reponse.47 In addition, although HMA therapy has been associated with upregulation of immune checkpoints, both ex vivo and in vivo, we did not detect upregulation in checkpoint expression in patients in whom HMA therapy failed or in patients in active HMA therapy, which may account for the lack of clinical efficacy in this patient group. However, given the small subsets of patients in our study comparing immune checkpoint expression based on treatment status, future larger studies are necessary to validate whether there is indeed no differential effect. Improved biomarkers are urgently needed in order to guide a personalized therapeutic approach for patients. In that regard, Daver and colleagues recently reported profound T-cell defects in patients with TP53 mutant AML as defined by polyfunctional strength index by single-cell cytokine profiling.48 Based on our data, patients with TP53 mutations may preferentially benefit from immune checkpoint therapy with PD-1/PDL1–based strategies.
The ICOS/ICOS ligand axis can promote or inhibit antitumor immunity via costimulatory activation of CTLs and Treg cells, respectively.26 Intratumoral ICOS+ Treg cells have a stronger suppressive ability than their negative counterparts in solid tumors.49 Although we did not identify any difference in total tumor-infiltrating Treg populations in patients with TP53 mutations vs those with the wild-type gene, there was a significant increase in ICOSHigh/PD-1− Treg cells which potentially represents the most immunosuppressive Treg populations.27-29 More importantly, the increased proportion of ICOSHigh/PD-1− Treg cells was an independent covariate for inferior OS in multivariate analysis of the total patient cohort. These data are in agreement with previous reports that identified the association of Treg expansion in the PB of patients with AML with a greater risk of relapse.50,51 However, an increased proportion of ICOSHigh/PD-1− Treg cells was not identified as an independent covariate for inferior OS in the wild-type cohort, and thus the prognostic implications of this subset may be predominantly associated with the presence of TP53 mutation; larger cohorts are needed to further evaluate the prognostic relevance of this immunosuppressive Treg population. Given the dual functions of ICOS, understanding the relative pro-/antitumor activity is of critical importance and is likely to be contingent upon the specific immune microenvironment of the patient.
In patients with MDS and sAML, immune checkpoint expression is heterogeneous in HSPCs and immune cell subsets. TP53 mutations are enriched for an immune suppressive or anergic profile that may be a primary driver of the poor prognosis in this molecularly defined subset. Moreover, an expanded population of tumor-infiltrating ICOSHigh/PD-1− Treg cells is highly predictive of outcome. We conclude that comprehensive immune checkpoint profiling may offer rationale for targeted immunomodulatory therapeutic strategies.
Original data are available by e-mail request to the corresponding author.
The online version of this article contains a data supplement.
The publication costs of this article were defrayed in part by page charge payment. Therefore, and solely to indicate this fact, this article is hereby marked “advertisement” in accordance with 18 USC section 1734.
Acknowledgments
This work was supported by the MDS Foundation Young Investigator Grant and the Early Career Award of the Dresner Foundation (D.A.S.); by an Lymphoma and Leukemia Society Specialized Center of Research (LLS-SCOR) grant (J.L.C., S.W., and A.F.L.); and by the Flow Cytometry and Molecular Genomics Core Facilities at the H. Lee Moffitt Cancer Center & Research Institute, a National Institutes of Health, National Cancer Institute–designated Comprehensive Cancer Center (P30-CA076292).
Authorship
Contribution: D.A.S. and A.F.M. designed and conducted the research, analyzed and interpreted the data, and wrote the manuscript; E.A.E., H.-A.H., S.G., K.L.M., A.L.A., S.B., B.L.E., A.D., S.W., and A.S. conducted the research; R.S.K., A.F.L. T.H., M.M., N.H.A.A., E.P., and J.E.L. provided samples from patients with MDS and sAML; and J.L.C., K.J.M., S.B., A.D., and A.F.L. critically reviewed and revised the manuscript.
Conflict-of-interest disclosure: D.A.S. and A.F.L. received research funding from Celgene that helped support this study. K.J.M. was an employee of Celgene. B.L.E. has received research funding from Celgene and Deerfield, received consulting fees from GRAIL, and serves on the scientific advisory boards for Skyhawk Therapeutics and Exo Therapeutics, none of which are related to this manuscript. The remaining authors declare no competing financial interests.
Correspondence: David A. Sallman, Department of Malignant Hematology, H. Lee Moffitt Cancer Center & Research Institute, 12902 Magnolia Dr, Tampa, FL, 33612; e-mail: david.sallman@moffitt.org.

This feature is available to Subscribers Only
Sign In or Create an Account Close Modal