

Key Points
EVI1 overexpression, superenhancer hijacking, lack of MDS1-EVI1, and frequent GATA2 deficiency define 3q26/MECOM-rearranged AML.
3q26/MECOM-rearranged AML is a single entity, including (but not limited to) inv(3)/t(3;3), and requires specialized diagnostic assays.

Abstract
Acute myeloid leukemia (AML) with inv(3)/t(3;3)(q21q26) is a distinct World Health Organization recognized entity, characterized by its aggressive course and poor prognosis. In this subtype of AML, the translocation of a GATA2 enhancer (3q21) to MECOM (3q26) results in overexpression of the MECOM isoform EVI1 and monoallelic expression of GATA2 from the unaffected allele. The full-length MECOM transcript, MDS1-EVI1, is not expressed as the result of the 3q26 rearrangement. Besides the classical inv(3)/t(3;3), a number of other 3q26/MECOM rearrangements with poor treatment response have been reported in AML. Here, we demonstrate, in a group of 33 AML patients with atypical 3q26 rearrangements, MECOM involvement with EVI1 overexpression but no or low MDS1-EVI1 levels. Moreover, the 3q26 translocations in these AML patients often involve superenhancers of genes active in myeloid development (eg, CD164, PROM1, CDK6, or MYC). In >50% of these cases, allele-specific GATA2 expression was observed, either by copy-number loss or by an unexplained allelic imbalance. Altogether, atypical 3q26 recapitulate the main leukemic mechanism of inv(3)/t(3;3) AML, namely EVI1 overexpression driven by enhancer hijacking, absent MDS1-EVI1 expression and potential GATA2 involvement. Therefore, we conclude that both atypical 3q26/MECOM and inv(3)/t(3;3) can be classified as a single entity of 3q26-rearranged AMLs. Routine analyses determining MECOM rearrangements and EVI1 and MDS1-EVI1 expression are required to recognize 3q-rearranged AML cases.
Introduction
Risk classification of patients with acute myeloid leukemia (AML) is based on the various genetic and epigenetic abnormalities previously identified and determines choice of treatment.1-5 Understanding the biological consequences of these abnormalities is essential to develop new treatments for AML, especially for chemotherapy resistant subtypes. AML with inv(3)(q21q26) or t(3;3)(q21;q26),6-9 henceforth referred to as inv(3)/t(3;3), is one of such subgroups with very poor response to therapy and a very aggressive course.
Recurrent translocations and inversions in AML most frequently generate oncogenic fusion genes.10-12 However, in the case of an inv(3) or t(3;3), both rearrangements cause the translocation of an enhancer of the GATA2 gene, located at 3q21, to the MECOM locus at chromosome 3q26.13,14 MECOM encodes the transcript isoforms MDS1-EVI1 and EVI1, which can be transcribed from 2 distinct promoters. In inv(3)/t(3;3) AML, the translocated GATA2 enhancer causes overexpression of EVI1, but not MDS1-EVI1. Translocation of the GATA2 oncogenic enhancer in AML with an inv(3)/t(3;3) leads to EVI1 upregulation and simultaneously abolishes GATA2 expression from the rearranged allele.13,14 Notably, germline haploinsufficiency or loss-of-function mutations in GATA2 are the underlying causes of a wide spectrum of disorders, including monocytopenia and mycobacterial infection and Emberger syndrome.15-18 Those patients have a severely increased chance of developing AML compared with healthy individuals. Together with the fact that GATA2 encodes a transcription factor essential for normal hematopoietic development,19 this suggests that loss of 1 GATA2 allele increases the transforming ability of EVI1 in chromosome 3q26–rearranged AMLs.
In a previous study of 6515 newly diagnosed AML patients, a group of leukemias with undefined 3q abnormalities was reported.9 Although these patients did not present with a classical inv(3)/t(3;3), they also exhibited frequent EVI1 overexpression and a very poor survival.9 Here, we addressed the question whether patients within this group harboring rearrangements at 3q26 resemble inv(3)/t(3;3) AML. Our study identifies critical similarities in the pathophysiology of both atypical 3q26 and inv(3)/t(3;3) AMLs, namely myeloid enhancer-driven EVI1 overexpression accompanied by low or no MDS1-EVI1 transcription and, in ∼50% of cases, GATA2 deficiency. Given their clinical and biological similarities, we conclude that atypical 3q26-rearranged AML and inv(3)/t(3;3) constitute a single entity.
Methods
Patient material
Samples of the selected patients presenting with MDS or AML were collected either from the Erasmus MC Hematology Department biobank (Rotterdam, The Netherlands) or from the Munich Leukemia Laboratory (MLL) biobank (Munich, Germany). Leukemic blast cells were purified from bone marrow or blood by standard diagnostic procedures. All patients provided written informed consent in accordance with the Declaration of Helsinki. The Medical Ethical Committee of the Erasmus MC has approved usage of the patient rest material for this study.
Cytogenetics: karyotype and FISH
Diagnostic cytogenetics for all samples was performed by each of the institutes mentioned above. For this study, samples were selected based on 3q26 rearrangements (other than recurrent or classic 3q26 rearrangements) detected by karyotyping or MECOM interphase fluorescence in situ hybridization (FISH). FISH and classic metaphase karyotyping were performed and reported according to standard protocols based on the International System of Human Cytogenetics Nomenclature (2016).20 MECOM FISH was performed according to the manufacturer’s protocol using the MECOM t(3;3); inv(3)(3q26) triple-color probe (Cytocell, LPH-036).
RNA isolation and quantitative PCR
RNA was isolated using either phenol-chloroform extraction followed by DNase digestion or the Allprep DNA/RNA mini kit and protocol (Qiagen, #80204). Complementary DNA synthesis was done using the SuperScript II Reverse Transcriptase kit (Invitrogen). Quantitative real-time PCR was performed by using primers as described previously13,21 on the 7500 Fast Real-time PCR System (Applied Biosystems). Relative levels of gene expression were calculated using the ΔΔCt method.7,8,22
SNP array
Patient blasts were stored at −80°C in RLT+ buffer (Qiagen), and DNA was isolated using the AllPrep DNA/RNA mini kit. All single-nucleotide polymorphism (SNP) arrays were performed at the Erasmus MC Department of Clinical Genetics (Rotterdam, The Netherlands) as previously described.23,24 In summary, per sample, 50 to 200 ng DNA was used for a single Illumina Global Screening Array (GSAMD, San Diego, CA). The array profiles were analyzed with a 0.15-Mb resolution in UCSC (human March 2006 [NCBI36/hg18] assembly) using Genome Studio (Illumina) and different versions of Nexus Copy Number Software (versions 5.0 and higher; BioDiscovery, Hawthorne, CA).
Targeted chromosomal region 3q21.1-3q26.2 DNA sequencing (3q-capture)
DNA was isolated as mentioned above. 3q-capture DNA sequencing was performed as we described previously.13 In summary, genomic DNA was fragmented using the Covaris shearing device, and sample libraries were assembled following the TruSeq DNA Sample Preparation Guide (Illumina). After ligation of adapters and an amplification step, target sequences of chromosomal regions 3q21.1-q26.2 were captured using custom in-solution oligonucleotide baits (Nimblegen SeqCap EZ Choice XL). The design of target sequences was based on the human genome assembly hg19:chr3q21.1:126036241-130672290-chr3q26.2:157712147-175694147. Amplified captured sample libraries were paired-end sequenced (2 × 100 bp) on the HiSeq 2500 platform (Illumina) and aligned against the hg19 reference genome using Burrows-Wheeler Aligner (BWA).25 Chromosomal breakpoints were determined using Breakdancer.26 All chromosomal aberrations found using this program were visually confirmed in the Integrated Genome Viewer.27
RNA sequencing (RNA-seq)
Sample libraries were prepped using 500 ng of input RNA according to the KAPA RNA HyperPrep Kit with RiboErase (HMR) (Roche) using Unique Dual Index adapters (Integrated DNA Technologies). Amplified sample libraries were paired-end sequenced (2 × 100 bp) on the Novaseq 6000 platform (Illumina) and aligned against the human genome (hg19) using STAR version 2.5.4b. A description of the quantification and differential expression analysis is provided in the supplemental Methods (available on the Blood Web site).
Exome sequencing
DNA was isolated as described above. The Genomic DNA Clean & Concentrator kit (ZYMO Research) was used to remove EDTA from the DNA samples. Sample libraries were prepared using 100 ng of input according to the KAPA HyperPlus Kit (Roche) using Unique Dual Index adapters (Integrated DNA Technologies, Inc.). Exomes were captured using the SeqCap EZ MedExome (Roche Nimblegen) according to SeqCap EZ HyperCap Library v1.0 Guide (Roche) with the xGen Universal blockers – TS Mix (Integrated DNA Technologies, Inc.). The amplified captured sample libraries were paired-end sequenced (2 × 100 bp) on the Novaseq 6000 platform (Illumina) and aligned to the hg19 reference genome using BWA.25 A description of the variant calling and allele expression analysis is provided in the supplemental Methods.
Whole-genome sequencing
DNA isolation and whole-genome library preparation and sequencing were performed at the MLL (Munich, Germany). Sequencing was performed on the Novaseq 6000 platform (Illumina). The experimental procedures are detailed in a previous report by the MLL laboratory.28 Whole-genome sequencing data were aligned to the hg19 reference genome using BWA.25
Results
Frequent MECOM rearrangements in atypical 3q26 AML
To study MECOM involvement, we performed FISH (MECOM-FISH; supplemental Figure 1A) in 33 AML patient samples whose karyotypes do not harbor a classical inv(3)/t(3;3) but had rearrangements at 3q26. These cases were classified as atypical 3q26-rearranged AML (Table 1; supplemental Table 1). A rearranged FISH pattern was found in 25 cases; ie, a part of the MECOM signal was found translocated from chromosome band 3q26 to another locus in the genome (Table 1; supplemental Figure 1B). SNP-array hybridizations revealed losses or gains on 3q26 or and/or partner loci in 7 of these 25 cases (Table 1; supplemental Table 1). In 12 of these 25 MECOM-rearranged cases, no CNGs or CNLs were found, which is in agreement with the existence of balanced translocations (Table 1). In the remaining 6 it was unclear whether rearrangements were balanced or not. In 4 of the total cohort of 33 cases (#HF-13-#HF-16), FISH analysis suggested amplification of the 3q26/MECOM locus (Table 1), which was confirmed by SNP array (Table 1). In 2 out of 33 atypical 3q26 samples (#TG-04 and #TG-06), no clear MECOM rearrangements could be detected. Together, these results point to common MECOM involvement in AML with atypical 3q26 rearrangements.
Cytogenetic and MECOM-associated alterations in atypical 3q26 AML
| PT # | Karyotype Chr.3*† | FISH EVI1‡ | SNP Chr.3‡ | EVI1§ | MDS1-EVI1§ | Breakpoint | Gene partner|| |
|---|---|---|---|---|---|---|---|
| SO-03 | add(3)(q2?6) | Rearranged | Chr.3q26 balanced | + | − | Breakpoint not found | |
| SO-06 | ?der(3)(q2?) | Rearranged | Chr.3q26 CNL 5′ MECOM | + | − | inv(3;3)(p23q26), complex | TGFBR2 |
| SO-11 | der(3)add(3)(p1?2)add(3)(q2?6) | Rearranged | Chr.3q26 CNL 3′ and 5′ MECOM | + | − | t(3;7)(q26;q11.23/q21.12), complex | DMTF1 |
| SO-20 | add(3)(q26) | Rearranged | Chr.3q26 balanced | + | − | t(3;7)(q26;p22.2), complex | TNRC18/FBXL18 |
| SO-23 | add(3)(q2?5) | Rearranged | Chr.3q26 balanced | + | + | t(3;6)(q26;q25) | ARID1B |
| SO-45 | del(3)(q2?3q2?6) | Rearranged | Chr.3q26 balanced | + | − | t(3;3)(q21;q26)+t(3;16)(q26;q22.1), complex | GATA2 |
| SO-47 | add(3)(q2?6) | Rearranged | Chr.3q26 balanced | + | − | t(2;3)(p21;q26) | THADA |
| BB-01 | no 3q aberrations | Rearranged | Chr.3q26 CNL MDS1 | + | − | Breakpoint not found | |
| TG-01 | t(3;11)(q26;q2?4) | Rearranged | Not done | + | + | t(3;11)(q26;q24) | HSPA8-MECOM¶ |
| TG-02 | t(3;18)(q26;q1?) | Rearranged | Not done | + | − | t(3;18)(q26;q21) | MECOM-TCF4¶ |
| TG-03 | no 3q aberrations | Rearranged | Chr.3q26 balanced | + | − | inv(3)(q21q26) | GATA2 |
| TG-04 | ins(3;3)(q26;q21q26) | Unclear | Chr.3q26 balanced | + | + | Breakpoint not found | |
| TG-05 | ?add(3)(q25) | Loss | Chr.3q26 CNL MDS1, CNG EVI1 | + | − | del(3)(q25.3-q26.2) | IL12A-AS1 |
| TG-06 | add(3)(q26) | Normal | Chr.3q26 balanced | + | − | Breakpoint not found | |
| TG-08 | −3[3],del(3)(q2?4)[7] | Loss | Chr.3q21 CNL GATA2 | + | + | Breakpoint not found | |
| TG-10 | −3 | Rearranged | Chr.3q21 CNL GATA2 | + | − | t(3;6)(q26;p22) | TDP2/JARID2 |
| HF-01 | der(7)t(3;7)(q26;q11.2) | Rearranged | Not done | + | − | t(3;7)(q26;q21) | CDK6 |
| HF-02 | der(7)t(3;7)(q26;q22) | Rearranged | Not done | + | − | Breakpoint not found | |
| HF-03 | der(7)t(3;7)(q26;q21) | Rearranged | Not done | + | − | t(3;7)(q26;q21) | CDK6 |
| HF-04 | der(7)t(3;7)(q26;p11)t(3;7)(q26;q21), −3 | Rearranged | Not done | + | − | Breakpoint not found | |
| HF-13 | der(3)t(3;14)(q21;q?) | Amplified | Chr.3q26 CNG, MECOM balanced | + | − | Breakpoint not found | |
| HF-14 | der(3)(::3p12->3q13::3q26->3q26::) | Amplified | Chr.3q26 CNG MECOM | + | − | Breakpoint not found | TRA2B-MECOM¶ |
| HF-15 | r(3)(p11q26)del(3)(q14q26) | Amplified | Chr.3q26 CNG EVI1/CNL MDS1, Chr.3q21 CNL GATA2 | + | − | inv(3)(q13.33q26.2) | GTF2E1/STXBP5L |
| HF-16 | der(2)ins(2;3)(q31;q22q26) | Amplified | Chr.q26 CNG 5′ and 3′ EVI1/CNL MDS1, Chr.3q21 CNL GATA2 | + | − | Breakpoint not found | |
| HF-17 | t(5;8)(p13;p21) | Rearranged | Chr.3q26 balanced | + | − | t(3;8)(q26;q24.1) | MYC |
| HF-18 | t(2;3;6)(p15;q26;q26) | Rearranged | Chr.3q26 balanced | + | − | t(2;3)(p21;q26) +t(3;5)(q26;q34) + t(3;6)(q26;q27) | THADA |
| HF-19 | t(3;4)(q26;p15) | Rearranged | Chr.3q26 balanced | + | − | t(3;4)(q26;p15) | PROM1, CD38 |
| HF-20 | t(3;8)(q26;p23) | Rearranged | Chr.3q26 CNL MDS1 | + | − | t(3;8)(q26;p23) | TNKS/MSRA |
| HF-21 | der(8)t(3;8)(q26;p23) | Rearranged | Chr.3q26 CNL MDS1, Chr.3q21 CNL GATA2 | − | − | t(3;8)(q26;p24), complex | FAM135B |
| HF-22 | der(3)t(2;3)(p14;q26) | Rearranged | Chr.3q26 balanced | + | − | t(2;3)(p21;q26) | THADA |
| HF-23 | ins(6;3)(q21;q21q26) | Rearranged | Chr.3q26 balanced | + | − | ins(6;3)(q21;q21q26) | CD164 |
| HF-24 | der(3)del(3)(p12p26)inv(3)(p26q26) | Rearranged | Chr.3q26 balanced | − | − | Breakpoint not found | |
| HF-25 | t(3;10)(q26;q21) | Rearranged | Chr.3q26 balanced | − | − | t(3;10)(q26;q21) | ARID5B |
Chr., chromosome; CNG, copy-number gain; CNL, copy-number loss; PT, patient.
Cytogenetic aberrations with a specific focus on 3q26. Complete karyotype is provided in supplemental Table 1.
Patients #BB-01, #TG-03, #TG-10 and #HF-17 did not show a 3q26 rearrangement by karyotyping but were identified as rearranged by routine MECOM FISH.
FISH was carried out as outlined in “Methods” and scored as normal, loss, amplified, or rearranged. In sample TG-04, the FISH results were unclear.
EVI1+ and MDS1-EVI1+ were determined as previously reported.2-4
Partner gene. The genes, expressed in CD34+ cells, located in closest vicinity to the breakpoint are indicated.
Fusion transcript.
High EVI1 mRNA levels transcribed from 1 allele in atypical 3q26 AML
Routine diagnostic RT-PCR8 (Table 1) showed EVI1 overexpression in 30 out of 33 atypical 3q26 cases. RNA-seq (n = 26) revealed that on average, EVI1 transcript levels were over ninefold higher (P = 3.00e09) in atypical 3q26 AML than in control non-3q26 AML (Figure 1A). To discriminate between the 2 MECOM alleles, we assessed single-nucleotide variants in RNA-seq and 3q-capture data. We could identify informative heterozygous SNPs in the DNA of 15 out of 33 patients and demonstrated equal distribution of the 2 EVI1 alleles (Figure 1B, left bar in red and blue). RNA-seq data demonstrated monoallelic EVI1 messenger RNA (mRNA) expression in those 15 leukemia samples (Figure 1B, right bar in red), strongly suggesting that EVI1 is only transcribed from the rearranged MECOM allele in atypical 3q26 AML.
![MECOM rearrangements, EVI1 overexpression, and absence of MDS1-EVI1 expression in atypical 3q26-rearranged AML. (A) Normalized EVI1 expression (counts per million [CPM] from RNA-seq data) determined in inv(3)/t(3;3) (n = 11), atypical 3q26 (n = 26) compared with non-3q26 AML (n = 111). (B) Allele-specific expression analysis using DNA-seq and RNA-seq data. The major allele is the allele of which the most SNPs were measured; the minor allele represents the allele that was underrepresented in the measurements. In order to perform this analysis, SNPs needed to be present in the sample. In 15 out of 33 cases, this analysis could be carried out. Asterisk (*) indicates significant differential expression between alleles (P < .05, χ2 test). VAF, variant allele frequency. (C) Relative EVI1 and MDS1-EVI1 expression (CPM, RNA-seq) in atypical 3q26 AMLs (n = 26). The red crossbar represents the mean and the red box the standard deviation. (D) Schematic depiction of the breakpoints within the MECOM locus (3q26) determined by 3q-capture. The breakpoints could be determined in 23 AML cases. In 6 cases, the breakpoint was 3′ of EVI1 and in 15 cases 5′ of the EVI1 promoter but 3′ of the MDS1-EVI1 promoter and in 2 AMLs 5′ of the MDS1-EVI1 promoter.](https://ash.silverchair-cdn.com/ash/content_public/journal/blood/136/2/10.1182_blood.2019003701/2/m_bloodbld2019003701f1.png?Expires=1769087934&Signature=P2wFgjrqpLyIluD49LgNblKcMajZjxmDIW8~AHaQmRYCWknXa7ZTj3GSpu-Cy77a1u~Ro1fsKFKxYNYm3Itm8f1H7gEYUpNehlnk-Uu1KdU60n3moyRI88d5eB1o70RlBShYiMbRKzP~1Cy-p~EuxUTNnaCSZRp4vrnqI2FL1TVRE0sOSdRe3Sm7b46TxkHHIJTwbhCrO1BcZuYz9DdncBI0ZPGamMly6YlhLpIGbqwd83QqUgY1nlKzvIWdk2SOSix4c9Lq64fPAREF718CsCYhhQmyimIt8~z~haOCv1wcnSrgiZsMQet873omR6c7vS6UaxAbP3RTG~PQnbwwHw__&Key-Pair-Id=APKAIE5G5CRDK6RD3PGA)
MECOM rearrangements, EVI1 overexpression, and absence of MDS1-EVI1 expression in atypical 3q26-rearranged AML. (A) Normalized EVI1 expression (counts per million [CPM] from RNA-seq data) determined in inv(3)/t(3;3) (n = 11), atypical 3q26 (n = 26) compared with non-3q26 AML (n = 111). (B) Allele-specific expression analysis using DNA-seq and RNA-seq data. The major allele is the allele of which the most SNPs were measured; the minor allele represents the allele that was underrepresented in the measurements. In order to perform this analysis, SNPs needed to be present in the sample. In 15 out of 33 cases, this analysis could be carried out. Asterisk (*) indicates significant differential expression between alleles (P < .05, χ2 test). VAF, variant allele frequency. (C) Relative EVI1 and MDS1-EVI1 expression (CPM, RNA-seq) in atypical 3q26 AMLs (n = 26). The red crossbar represents the mean and the red box the standard deviation. (D) Schematic depiction of the breakpoints within the MECOM locus (3q26) determined by 3q-capture. The breakpoints could be determined in 23 AML cases. In 6 cases, the breakpoint was 3′ of EVI1 and in 15 cases 5′ of the EVI1 promoter but 3′ of the MDS1-EVI1 promoter and in 2 AMLs 5′ of the MDS1-EVI1 promoter.
MECOM rearrangements, EVI1 overexpression, and absence of MDS1-EVI1 expression in atypical 3q26-rearranged AML. (A) Normalized EVI1 expression (counts per million [CPM] from RNA-seq data) determined in inv(3)/t(3;3) (n = 11), atypical 3q26 (n = 26) compared with non-3q26 AML (n = 111). (B) Allele-specific expression analysis using DNA-seq and RNA-seq data. The major allele is the allele of which the most SNPs were measured; the minor allele represents the allele that was underrepresented in the measurements. In order to perform this analysis, SNPs needed to be present in the sample. In 15 out of 33 cases, this analysis could be carried out. Asterisk (*) indicates significant differential expression between alleles (P < .05, χ2 test). VAF, variant allele frequency. (C) Relative EVI1 and MDS1-EVI1 expression (CPM, RNA-seq) in atypical 3q26 AMLs (n = 26). The red crossbar represents the mean and the red box the standard deviation. (D) Schematic depiction of the breakpoints within the MECOM locus (3q26) determined by 3q-capture. The breakpoints could be determined in 23 AML cases. In 6 cases, the breakpoint was 3′ of EVI1 and in 15 cases 5′ of the EVI1 promoter but 3′ of the MDS1-EVI1 promoter and in 2 AMLs 5′ of the MDS1-EVI1 promoter.
Low MDS1-EVI1 expression is a common feature of atypical 3q26 AML
Although 2 mRNAs can be transcribed from the MECOM locus (ie, MDS1-EVI1 [ME] and EVI1; supplemental Figure 1D),29,30 inv(3)/t(3;3) AMLs are EVI1+/ME−. Similarly, in 29 out of 33 atypical 3q26 AML samples, MDS1-EVI1 transcripts were absent or expressed at very low levels, as reported for inv(3)/t(3;3) leukemias (Table 1 and Figure 1C).
Frequent disruption of MDS1 in atypical 3q26 AML underlies its low expression
In 23 out of 33 cases, we were able to exactly define the breakpoints within the MECOM locus (Figure 1D). Breakpoints occurred either upstream (n = 17) or downstream (n = 6) of the EVI1 gene. In 15 out of the 17 cases with an upstream EVI1 rearrangements, the breakpoints occurred between the MDS1 and EVI1 promoter (Figure 1D), as was reported in AML with a translocation t(3;3)(q21;q26).15 In those AMLs, the MDS1 promoter has been dislocated due to the translocation, which avoids transcription of the long-form MDS1-EVI1 (supplemental Figure 1D; Figure 1C). In the 2 other AMLs (#-SO-23 and #HF-21) with a 5′-EVI1 breakpoint, the rearrangements occurred upstream of the MDS1 promoter. Accordingly, one of those patients (#SO-23) showed EVI1+/ME+ expression. In the other case (#HF-21), neither EVI1 nor MDS1-EVI1 was detectable. The 6 cases with breakpoints 3′ of EVI1 showed an EVI1+/ME− expression pattern. Why 3q26 rearrangements with downstream breakpoints, as in AML with inv(3), show no or low MDS1-EVI1 levels remains unresolved. CNV analysis of the 3q-capture DNA sequencing (DNA-seq) and the SNP-array hybridizations revealed deletions within the MDS1 region in 6 atypical 3q26 AML patients: #HF-15, #HF-16, #HF-20, #HF21, #TG-05, and #SO-11 (Figure 2 and Table 1; supplemental Figure 3A and supplemental Table 1). Notably, these deletions underlie the loss of MDS1 expression in #HF-16 and #HF-21, where this cannot be explained by a translocation. EVI1 exons were never deleted in those samples and in fact were amplified in 3 of them (#HF-15, #HF-16, and #TG-05). Altogether, the data strongly support the hypothesis that EVI1 and not MDS1-EVI1 expression is essential in transformation of 3q26-rearranged AMLs.
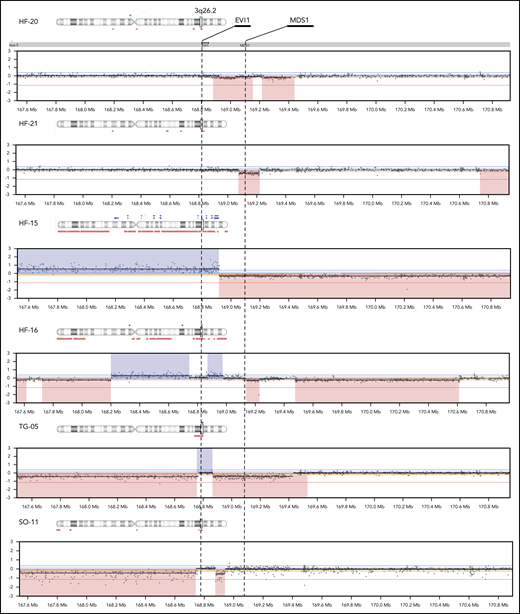
Copy-number changes in the MECOM locus in atypical 3q26 AML. SNP array showing CNLs in red and CNGs in blue at chromosome band 3q26. EVI1 and MDS1-EVI1 are marked. Only the samples for which copy-number changes were found in this locus are illustrated (n = 6).
Copy-number changes in the MECOM locus in atypical 3q26 AML. SNP array showing CNLs in red and CNGs in blue at chromosome band 3q26. EVI1 and MDS1-EVI1 are marked. Only the samples for which copy-number changes were found in this locus are illustrated (n = 6).
Unique rearrangements between MECOM and myeloid genes in atypical 3q26 AMLs
In 20 out of 33 atypical 3q26 cases, the translocated partner locus of MECOM/3q26 could be identified by 3q-capture DNA-seq (Table 1). In 2 cases (#TG-03 and #SO-45), a cryptic inv(3)/t(3;3) GATA2/MECOM rearrangement was found. In 7 other cases, previously reported recurrent 3q26 translocations were identified, namely t(2;3)(p21;q26) (n = 3), t(3;7)(q26;q21) (n = 2), t(3;8)(q26;q24) (n = 1), and t(3;6)(q26;q25) (n = 1). The genes thought to be involved in those translocations are THADA, CDK6, MYC, and ARID1B, respectively31-36 (Table 1). These abnormalities were most probably missed at diagnosis due to the complex genetic nature of these cases. In the other 11 atypical 3q26 AMLs, novel and unique MECOM/3q26-rearranged partner loci were found (Table 1). We hypothesize that regulatory elements of these genes were hijacked by EVI1, resulting in loss of expression of the gene at the rearranged allele. Combined DNA-seq/RNA-seq SNP analysis applied to these AMLs revealed monoallelic or skewed expression of some of these genes in the translocated locus. As an example, in AML with ins(6;3)(q21;q21q26) (#HF-23, Figure 3A), t(3;4)(q26;p15) (#HF-19, Figure 3B), or t(3;7)(q26;p22) (#SO-20, Figure 3C), skewed expression of CD164, PROM1 (CD133), or FSCN1/EIF2AK1 was found, respectively (Figure 3D). Whether the repressed allele was rearranged could not be assessed due to lack of patient material. These genes are all expressed in CD34+ cells and myeloid progenitor cells,37 and both CD16438-40 and PROM141 are known to play a prominent role in hematopoiesis.
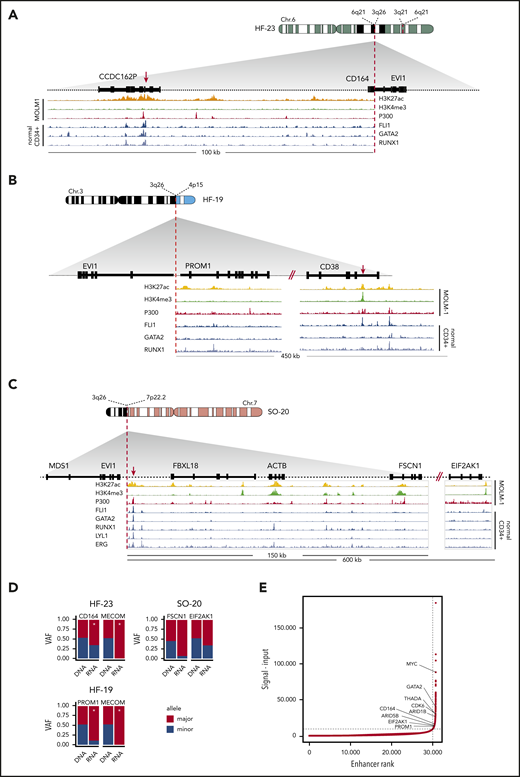
Rearrangements involving 3q26/EVI1 and newly identified partner loci. (A-C) Schematic depictions of chromosomal rearrangements of 3 unique atypical 3q26 patient samples: ins(6;3)(q26;q21q26) in patient #HF-23, t(3;4)(q26;p15) in patient #HF-19, and t(3;7)(q26;p22) in patient #SO-20. Figures show the loci and genes that have been rearranged and brought into the vicinity of MECOM: loci with CD164 and CCDC162P (6q21) in panel A, PROM1 and CD38 (4p15) in panel B, and FBXL18, ACTB, FSCN1 and EIF2AK1 (7p22) in panel C, respectively. ChIP-seq tracks indicative for active enhancer elements, ie, H3K27ac (yellow), H3K4me3 absence (green) and P300 (red), have been obtained from the MOLM-1 myeloid cell line.13 Previously published ChIP-seq tracks of myeloid transcription factors FLI1, GATA2, RUNX1, LYL1, and ERG using normal CD34+ cells are shown37 (blue). Enhancers possibly involved in EVI1 activation are indicated with a red arrow. (D) Bar plots showing skewed expression of genes that putatively donated their enhancer. The bar plots show the genes with skewed expression: CD164 (#HF-23), PROM1 (#HF-19), and FSCN1 and EIF2AK1 (#SO-20). In 2 out of 3 samples, monoallelic EVI1 expression was found (#HF-23 and #HF-19). Allele-specific EVI1 expression could not be determined in for #SO-20, since no SNPs could be detected. Asterisk (*) indicates significant differential expression between alleles (P < .05, χ2 test). (E) Hockey-stick plot showing the classification of these long stretches of H3K27ac (A-C) found in the partner loci as superenhancers (based on MOLM-1 H3K27ac ChIP-seq data using the ROSE algorithm).45
Rearrangements involving 3q26/EVI1 and newly identified partner loci. (A-C) Schematic depictions of chromosomal rearrangements of 3 unique atypical 3q26 patient samples: ins(6;3)(q26;q21q26) in patient #HF-23, t(3;4)(q26;p15) in patient #HF-19, and t(3;7)(q26;p22) in patient #SO-20. Figures show the loci and genes that have been rearranged and brought into the vicinity of MECOM: loci with CD164 and CCDC162P (6q21) in panel A, PROM1 and CD38 (4p15) in panel B, and FBXL18, ACTB, FSCN1 and EIF2AK1 (7p22) in panel C, respectively. ChIP-seq tracks indicative for active enhancer elements, ie, H3K27ac (yellow), H3K4me3 absence (green) and P300 (red), have been obtained from the MOLM-1 myeloid cell line.13 Previously published ChIP-seq tracks of myeloid transcription factors FLI1, GATA2, RUNX1, LYL1, and ERG using normal CD34+ cells are shown37 (blue). Enhancers possibly involved in EVI1 activation are indicated with a red arrow. (D) Bar plots showing skewed expression of genes that putatively donated their enhancer. The bar plots show the genes with skewed expression: CD164 (#HF-23), PROM1 (#HF-19), and FSCN1 and EIF2AK1 (#SO-20). In 2 out of 3 samples, monoallelic EVI1 expression was found (#HF-23 and #HF-19). Allele-specific EVI1 expression could not be determined in for #SO-20, since no SNPs could be detected. Asterisk (*) indicates significant differential expression between alleles (P < .05, χ2 test). (E) Hockey-stick plot showing the classification of these long stretches of H3K27ac (A-C) found in the partner loci as superenhancers (based on MOLM-1 H3K27ac ChIP-seq data using the ROSE algorithm).45
MECOM hijacks myeloid-specific enhancers that may activate EVI1 transcription
As chromatin of patient cells were not available, we studied the chromatin state at CD164, PROM1 (CD133), and FSCN1/EIF2AK1 in normal bone marrow CD34+ cells as well as in the inv(3) myeloid cell line MOLM-1.37,42 As depicted in Figure 3A-C, binding of p300, presence of H3K27ac, and lack of H3K4me3 were indicative of active enhancers within the regions that were translocated to MECOM in cases #HF-19, #HF-23, and #SO-20, respectively. In fact, the size of the H3K27 acetylated regions (>10 kb) suggested the presence of “superenhancers”43 in those loci (Figure 3E). Strong binding of key myeloid transcription factors like FLI1, GATA2, and RUNX1 (Figure 3A-C) in CD34+ bone marrow cells37 further supports the notion that active myeloid superenhancers translocate to MECOM in atypical 3q26 rearrangements to activate EVI1 expression. Chromatin immunoprecipitation sequencing (ChIP-seq) analysis of normal CD34+ and MOLM1 cells also showed the presence of superenhancers in the regions near THADA, MYC, and CDK6, which translocate to MECOM in AMLs with translocations t(2;3), t(3;8), and (t3;7), respectively (Table 1 and Figure 3E; supplemental Figure 2A-E). The loss of these enhancers in one allele should lead to a reduction in total gene expression, but given that most of these translocations are unique to one patient, it is not possible to conduct a statistical analysis. Instead, for every gene that putatively loses its enhancer, we compared its average expression in the whole cohort to the expression in the individuals with the translocation. In line with our hypothesis, all genes except MYC exhibited reduced expression (supplemental Figure 3C). Together, the data point to a mechanism of EVI1 overexpression driven by hijacked myeloid superenhancers in atypical 3q26-rearranged AML.
Atypical 3q26 AMLs exhibit GATA2 deficiency in half of the cases
In inv(3)/t(3;3) AML, the dislocation of the GATA2 enhancer causes loss of expression of GATA2 from the rearranged allele.13,14 We addressed the question whether GATA2 expression was reduced in atypical 3q26 AML without 3q21/GATA2 rearrangements. RNA-seq data demonstrated comparable GATA2 expression levels for the atypical 3q26 AMLs as for the inv(3)/t(3;3) AMLs (Figure 4A), which was slightly lower than in non-3q26 rearranged AMLs, although not statistically significant. Analysis of SNP-array data (performed for 27 atypical 3q26 AMLs) revealed CNL of parts of chromosome 3, including GATA2 and/or its enhancer in 5 atypical 3q26 AML patients (#TG-08, #TG-10, #HF-15, #HF-16, and #HF-21; Figure 4C). In 2 of these cases, loss of 1 chromosome 3 was also noted cytogenetically (Table 1). CNV analysis of the 3q-captured data of all 33 cases was used to verify copy-number changes detected by SNP array; 5 cases with GATA2 or GATA2-enhancer loss were identified (supplemental Table 1), of which 2 are shown in supplemental Figure 3B. In 16 AMLs of our cohort, we could discriminate between 2 GATA2 alleles based on SNP differences, identified by combined RNA- and DNA-seq data analysis. In 4 of those 16 cases, GATA2 expression was monoallelic or significantly skewed to 1 allele (P < .05, marked by "*" in Figure 4B). As methylation of the GATA2 promoters could explain allele specific expression, bisulfite-sequencing experiments were performed. However, we did not obtain any evidence for GATA2 promoter methylation in these patients. Thus, the mechanism by which these cases showed unbalanced allelic GATA2 expression remains unclear. Overall, we observed GATA2 loss or skewed expression in 12 of the 22 cases (>50%) that we could analyze in full. No mutations in GATA2 were found in any of the 33 atypical 3q26 AMLs. We conclude that in a subset of atypical 3q26-rearranged AML, EVI1 overexpression was accompanied by loss or diminished GATA2 transcription from 1 allele, which resembles inv(3)/t(3;3) AML.13
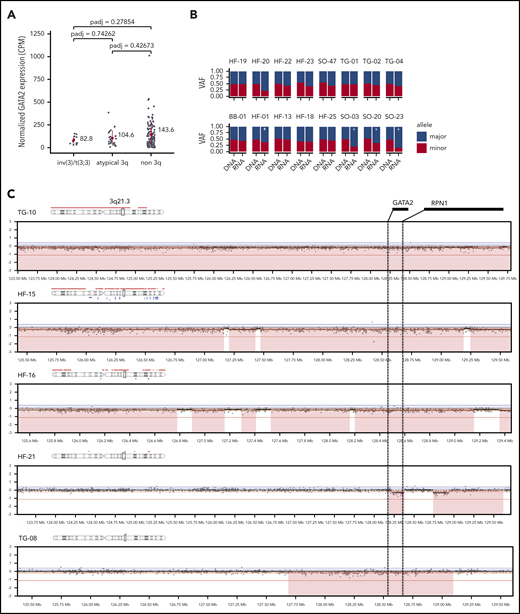
CNL of GATA2 or imbalanced GATA2 expression in atypical 3q26 AML. (A) GATA2 expression (CPM, RNA-seq) determined in inv(3)/t(3;3) (n = 11), in atypical 3q26 (n = 26) and non-3q26-rearranged AML (n = 111). Differences were not statistically significant (adjusted P < .05). Red dot represents the mean and the red bar the standard deviation. (B) Allele-specific analysis using DNA-seq and RNA-seq data showed significant skewed expression of GATA2 to 1 allele in 5 cases. In #HF-20, read depth was too low for a significance call. Asterisk (*) indicates significant differential expression between alleles (P < .05, χ2 test). (C) SNP-array data presented at chromosomal locus 3q21.3, showing CNLs in the GATA2 locus, resulting in loss (red) of the GATA2 gene or its enhancer (located between GATA2 and RPN1).
CNL of GATA2 or imbalanced GATA2 expression in atypical 3q26 AML. (A) GATA2 expression (CPM, RNA-seq) determined in inv(3)/t(3;3) (n = 11), in atypical 3q26 (n = 26) and non-3q26-rearranged AML (n = 111). Differences were not statistically significant (adjusted P < .05). Red dot represents the mean and the red bar the standard deviation. (B) Allele-specific analysis using DNA-seq and RNA-seq data showed significant skewed expression of GATA2 to 1 allele in 5 cases. In #HF-20, read depth was too low for a significance call. Asterisk (*) indicates significant differential expression between alleles (P < .05, χ2 test). (C) SNP-array data presented at chromosomal locus 3q21.3, showing CNLs in the GATA2 locus, resulting in loss (red) of the GATA2 gene or its enhancer (located between GATA2 and RPN1).
Discussion
Atypical 3q26-rearranged AML represents a group of very poor-risk leukemias with various undefined 3q26 rearrangements whose role in leukemogenesis is unclear.9 Using a multipronged approach, we here demonstrate that in atypical 3q26-rearranged AML, MECOM is relocated, leading to EVI1 overexpression in the absence of MDS1-EVI1 transcription. We found potential myeloid superenhancers to be translocated to MECOM. In ∼50% of the study cohort, GATA2 skewed expression or CNL was found, despite lack of GATA2 involvement in the rearrangement. We conclude that atypical 3q26 AML genocopy inv(3)/t(3;3) leukemias13,14 and these 2 groups should be classified and treated as single entity.
In atypical 3q26 AMLs, chromosomal rearrangements bring MECOM into the vicinity of regulatory elements of genes active in myeloid cells, such as THADA, CDK6, MYC, ARID1B, CD164, PROM1 (CD133), or FSCN1/EIF2AK1.31-36 We hypothesize that a mechanism of superenhancer hijacking causes EVI1 overexpression in variant 3q26-AMLs, as has been reported for the −77-kb GATA2 enhancer in inv(3)/t(3;3) leukemias. ChIP-seq data from normal CD34+ bone marrow cells and myeloid cell lines revealed that transcription factors that bind to the GATA2 distal enhancer, including RUNX1, LYL1, SCL, FLI1, ERG, LMO2, and GATA2 itself,37 also interact with the loci translocated in atypical 3q26 AMLs. It will be challenging to model these translocations and study EVI1 promoter interaction and regulation by these distinct superenhancers. As superenhancers have been reported to be hypersensitive to bromodomain inhibitors,44,45 it will be interesting to study responses of the distinct 3q26-rearranged AMLs to those compounds.
It is well established that EVI1 is an oncogenic driver of AML, but the role of MDS1-EVI1 in leukemic transformation has not been thoroughly studied. Evi1 was first identified as the ecotropic viral insertion site 1 in mouse leukemias, in which Evi1, but not Mds1-Evi1, was overexpressed due to retroviral insertions.46 Patients with X-linked chronic granulomatous disease who received gene therapy to correct GP91 (PHOX) mutations in hematopoietic progenitor cells similarly developed AML due to retroviral insertions driving EVI1 and not MDS1-EVI1 overexpression.47 Here, we demonstrate that in atypical 3q26 AML, as reported in AML with inv(3)/t(3;3), overexpression of EVI1 was accompanied by absence or low expression of MDS1-EVI1. We hypothesize that the translocated enhancers in 3q26-rearranged AMLs are able to contact and coactivate the promoter of EVI1, but not the promoter of MDS1-EVI1.
Monoallelic expression of GATA2 is another hallmark of inv(3)/t(3;3), caused by loss of the GATA2 enhancer at the rearranged allele. Does monoallelic GATA2 play a role in leukemic transformation in inv(3)/t(3;3)? In >50% of the atypical 3q26 AMLs analyzed, skewed or monoallelic expression of GATA2 was evident due to cryptic GATA2/MECOM translocation, deletion of GATA2 or a regulatory element, or currently unknown mechanisms. EVI1 overexpressing mice develop myeloid leukemias with a shorter latency when they are GATA2 heterozygous.48 Moreover, individuals with inherited GATA2 mutations or loss of expression of 1 allele have a high chance of developing AML.15-19 Altogether, loss of 1 GATA2 allele appears to have an effect on leukemia development. A larger patient cohort is required to investigate whether GATA2 monoallelic expression has an impact on prognosis of 3q26-rearranged AML.
Atypical 3q26 AMLs are difficult to define, as they are cytogenetically complex and heterogeneous. This underscores the importance of routine molecular diagnostic assays to recognize this subgroup of AML patients. We propose to identify 3q26/MECOM rearrangements using MECOM FISH (supplemental Figure 1), which is applied routinely in AML diagnostics. Quantitative EVI1 and MDS1-EVI1 mRNA expression analysis can be indicative of EVI1 deregulation by enhancer hijacking. Together, this combined analysis can be used to classify this subgroup of AML patients.
Sequence data have been deposited at the European Genome-phenome Archive (http://www.ebi.ac.uk/ega/), which is hosted by the European Bioinformatics Institute (accession number EGAS00001004325).
The online version of this article contains a data supplement.
The publication costs of this article were defrayed in part by page charge payment. Therefore, and solely to indicate this fact, this article is hereby marked “advertisement” in accordance with 18 USC section 1734.
Acknowledgments
The authors are indebted to their colleagues from the bone marrow transplantation group and the molecular diagnostics laboratory of the Department of Hematology at Erasmus University Medical Center for storage of samples and molecular analysis of the leukemia cells (H.B.B., K. Joode, M. Wattel, R.v.d.H., and P.J.M.V.). For a part of the patient material and sequencing data, the authors are thankful to the MLL Münchner Leukämielabor GmbH in Germany (C.H. and T.H.). They also thank Pieter Sonneveld and their colleagues of the Hematology Department for their input, especially Bas Wouters for critically reading the manuscript.
This work was funded by grants and fellowships from the Dutch Cancer Society, “Koningin Wilhelmina Fonds” (R.D., R.M.-L., S.O., and T.G.), Skyline DX (S.O.), and the Daniel den Hoed Foundation (L.S.).
Authorship
Contribution: S.O., R.M.-L., and R.D. designed the study; S.O., C.E., S.v.H., R.v.d.H., M.H., T.G., E.B., and L.S. carried out experiments; R.M.-L., S.O., H.B.B., L.S., C.H., T.H., and P.J.M.V. analyzed data; H.B.B., P.J.M.V., T.H., and C.H. provided samples and/or data; and R.D., R.M., and S.O. wrote the manuscript.
Conflict-of-interest disclosure: T.H. and C.H. are employees of and have equity ownership in MLL Munich Leukemia Laboratory. The remaining authors declare no competing financial interests.
Correspondence: Ruud Delwel, Department of Hematology, Oncode Institute, Erasmus University Medical Center, Wijtemaweg 80, 3015CN Rotterdam, The Netherlands; e-mail: h.delwel@erasmusmc.nl.
