

TO THE EDITOR:
Chromosomal rearrangements involving the mixed lineage leukemia gene (MLL1, KMT2A) define a genetically distinct subset of acute myelogenous leukemias (AMLs) and acute lymphoblastic leukemias.1-4 MLL rearrangements encode an MLL fusion protein that drives leukemia development. Direct targeting of the MLL fusions is not yet feasible, but targeting members of the oncogenic MLL fusion complex is showing promise. This is exemplified by the development of Menin-MLL1 interaction inhibitors that disrupt the integrity of the oncogenic MLL fusion protein complex5-8 as well as enzymatic inhibitors of the histone methyltransferase DOT1L.9,10 Both Menin and DOT1L have been shown to be essential for maintenance of MLL fusion–driven oncogenic gene expression in human and murine model systems.5,6,11-15 Menin inhibitors are orally bioavailable, exhibit favorable pharmacokinetics, and show potent antileukemic properties in vivo.5,8 Therefore, 2 different Menin inhibitor compounds recently entered phase 1 clinical trials (SNDX-5613 [registered at www.clinicaltrials.gov as #NCT04065399] and KO-539 [#NCT04067336]). A specific enzymatic inhibitor of DOT1l (EPZ5676) was developed but only showed modest activity in an early-phase clinical trial.10 Biochemical selectivity and subnanomolar affinity for DOT1L have not translated into success in mice or humans, in part because of unfavorable pharmacokinetic properties. Moreover, there is a significant need to develop potent combination treatment regimens, and progress has been hampered by the lack of DOT1L inhibitors that are effective in vivo. Recent efforts in drug discovery and structure-guided optimization have led to the development of a novel set of SAM-competitive DOT1L-targeting compounds that are potent and selective and can be used for in vivo studies in mice.16 Herein, we report on the preclinical evaluation of 2 of these compounds, which show favorable pharmacokinetics and potent antileukemic activity in vitro and in vivo in patient-derived xenograft models of MLL-rearranged leukemia.
We treated 14 human leukemia cell lines with EPZ5676 and novel DOT1L inhibitors compound 10 and compound 11 to determine 50% inhibitory concentration values (Figure 1A; supplemental Figure 1A, available on the Blood Web site). As expected, cell lines harboring MLL fusion oncogenes were more responsive to DOT1L inhibitor treatment than other cell lines. Comparative analysis of the dose-response curves revealed a sensitivity profile of cell lines to compounds 10 and 11 that was very similar to that of EPZ5676 (Figure 1B; supplemental Figure 1B). Furthermore, EPZ5676 as well as the novel compounds induced immunophenotypic and morphologic signs of differentiation in murine MLL-AF9 leukemia cells, the in vitro model system most sensitive to DOT1L inhibitors (Figure 1C-D; supplemental Figure 1C). Of note, treatment with DOT1L inhibitors did not lead to induction of apoptosis (supplemental Figure 1D). Both compounds 10 and 11 potently inhibited global H3K79me2 (Figure 1E). Concomitantly, chromatin immunoprecipitation sequencing revealed a time-dependent loss of H3K79me2 from protein coding genes as well as from MLL fusion target genes15 in MOLM13 and RS4;11 cells (Figure 1F-G; supplemental Figures 2A and 1C). We next characterized global transcriptomic changes upon DOT1L inhibition at days 3, 6, and 9 under treatment with compound 10 (supplemental Figure 1D). The number and magnitude of differentially expressed genes increased over time, and core MLL-AF9 target genes were found among the top downregulated candidates (Figure 1H). Furthermore, genes that are associated with myeloid differentiation became upregulated at the later time points. In gene set enrichment analysis, known MLL-AF9 target genes were significantly enriched among the downregulated genes after treatment with compound 10, similar to EPZ5676 (Figure 1I). We compared the magnitude of changes in differentially expressed genes after compound 10 and EPZ5676 treatment and found a striking correlation (Figure 1J), indicating highly specific on-target activity of both drugs, despite markedly different chemical structures and DOT1L binding modes. We next assessed whether DOT1L inhibition influenced chromatin occupancy of either DOT1L or Menin, as previously described for the Menin inhibitor VTP50469.5 Of note, inhibition of DOT1L by compound 10, compound 11, or EPZ5676 only inhibited H3K79me2 (supplemental Figure 2C), whereas chromatin binding of DOT1L and Menin remained unaffected (Figure 1L). Therefore, all the DOT1L inhibitors used in this study seem to inhibit the methyltransferase function of DOT1L without perturbing MLL fusion complex integrity.
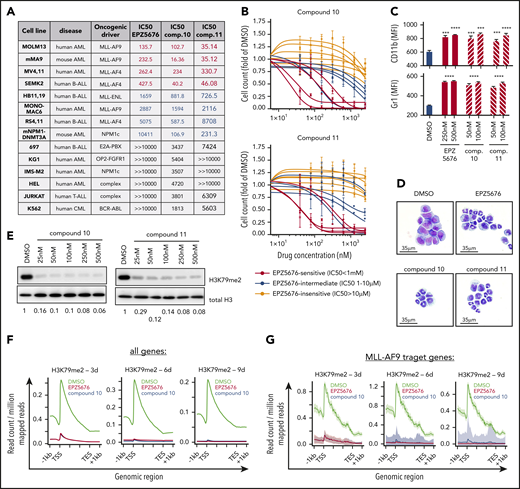
Activity of novel DOT1L inhibitors in leukemia cell lines in vitro. (A) Table of 14 leukemia cell lines used in this study indicating the type of leukemia, oncogenic driver, and 50% inhibitory concentration (IC50) values for EPZ5676, compound 10, and compound 11. IC50 was determined at day 10 after initiation of treatment by counting of viable cells using flow cytometry (dead cell exclusion by 4′,6-diamidino-2-phenylindole staining). Cell lines are sorted by sensitivity to EPZ5676. (B) Dose-response curves of cell lines toward compound 10 (top) and compound 11 (bottom) grouped by EPZ5676-sensitive (red), -intermediate (blue), and -insensitive (gray) cell lines. (C) Cell-surface expression of the myeloid differentiation markers CD11b (top) and Gr-1 (bottom) on murine MLL-AF9 leukemia cells at 3 days of DOT1L inhibitor treatment at the indicated doses. Statistical analysis was performed using unpaired t test. (D) Representative cytospin pictures of murine MLL-AF9 leukemia cells at 6 days of treatment with EPZ5676 (500 nM), compound 10 (100 nM), and compound 11 (100 nM). Fixation and staining was performed using the "Dip Quick Stain Kit" (Jorgensen Labs). (E) Western blot for H3K79me2 and histone H3 (control) in whole cellular lysates of MOLM13 cells treated with 5 different doses of compound 10 or 11 for 3 days. (F-G) Meta-plots of H3K79me2 chromatin immunoprecipitation sequencing (ChIPseq) in MOLM13 cells after treatment with EPZ5676 (1 μM), compound 10 (100 nM), or dimethyl sulfoxide (DMSO) over the gene body of all protein coding genes (F) and MLL-AF9 target genes (G). ChIPseq data were normalized using drosophila spike-in chromatin. (H) Volcano plots of differentially expressed genes (DEGs; red) in MOLM13 cells treated with 100 nM of compound 10 for 3, 6, and 9 days after initiation of drug treatment. Shown in the graph are protein coding genes only. DEGs were called using the DeSeq2 algorithm after alignment of reads using STAR. A gene was considered a DEG if the adjusted P value was <.05. (I) Gene set enrichment analysis (GSEA) of MLL-AF9 target genes after treatment of MOLM13 cells with compound 10 (100 nM; top) or EPZ5676 (1 μM; bottom) for 3, 6, and 9 days. (J) Correlation between the magnitude of changes (displayed as log2-fold change) in DEGs after compound 10 vs EPZ5676 treatment. Pearson correlation was used for statistical analysis. (K) Western blot of H3K79me2 and histone H3 (control) in whole cellular lysates of MOLM13 cells treated with VTP50469, compound 10, compound 11, or EPZ5676 at the indicated doses for 4 days. (L) Representative ChIPseq tracks of DOT1L (left) and Menin (right) at core MLL-AF9 target genes derived from the same experimental setting as shown in panel H. ChIPseq was performed as previously described.5 ***P < .001, ****P < .0001. AML, acute lymphoblastic leukemia; CML, chronic myeloid leukemia; FDR, false discovery rate; MFI, mean fluorescence intensity; NES, normalized enrichment score.
Activity of novel DOT1L inhibitors in leukemia cell lines in vitro. (A) Table of 14 leukemia cell lines used in this study indicating the type of leukemia, oncogenic driver, and 50% inhibitory concentration (IC50) values for EPZ5676, compound 10, and compound 11. IC50 was determined at day 10 after initiation of treatment by counting of viable cells using flow cytometry (dead cell exclusion by 4′,6-diamidino-2-phenylindole staining). Cell lines are sorted by sensitivity to EPZ5676. (B) Dose-response curves of cell lines toward compound 10 (top) and compound 11 (bottom) grouped by EPZ5676-sensitive (red), -intermediate (blue), and -insensitive (gray) cell lines. (C) Cell-surface expression of the myeloid differentiation markers CD11b (top) and Gr-1 (bottom) on murine MLL-AF9 leukemia cells at 3 days of DOT1L inhibitor treatment at the indicated doses. Statistical analysis was performed using unpaired t test. (D) Representative cytospin pictures of murine MLL-AF9 leukemia cells at 6 days of treatment with EPZ5676 (500 nM), compound 10 (100 nM), and compound 11 (100 nM). Fixation and staining was performed using the "Dip Quick Stain Kit" (Jorgensen Labs). (E) Western blot for H3K79me2 and histone H3 (control) in whole cellular lysates of MOLM13 cells treated with 5 different doses of compound 10 or 11 for 3 days. (F-G) Meta-plots of H3K79me2 chromatin immunoprecipitation sequencing (ChIPseq) in MOLM13 cells after treatment with EPZ5676 (1 μM), compound 10 (100 nM), or dimethyl sulfoxide (DMSO) over the gene body of all protein coding genes (F) and MLL-AF9 target genes (G). ChIPseq data were normalized using drosophila spike-in chromatin. (H) Volcano plots of differentially expressed genes (DEGs; red) in MOLM13 cells treated with 100 nM of compound 10 for 3, 6, and 9 days after initiation of drug treatment. Shown in the graph are protein coding genes only. DEGs were called using the DeSeq2 algorithm after alignment of reads using STAR. A gene was considered a DEG if the adjusted P value was <.05. (I) Gene set enrichment analysis (GSEA) of MLL-AF9 target genes after treatment of MOLM13 cells with compound 10 (100 nM; top) or EPZ5676 (1 μM; bottom) for 3, 6, and 9 days. (J) Correlation between the magnitude of changes (displayed as log2-fold change) in DEGs after compound 10 vs EPZ5676 treatment. Pearson correlation was used for statistical analysis. (K) Western blot of H3K79me2 and histone H3 (control) in whole cellular lysates of MOLM13 cells treated with VTP50469, compound 10, compound 11, or EPZ5676 at the indicated doses for 4 days. (L) Representative ChIPseq tracks of DOT1L (left) and Menin (right) at core MLL-AF9 target genes derived from the same experimental setting as shown in panel H. ChIPseq was performed as previously described.5 ***P < .001, ****P < .0001. AML, acute lymphoblastic leukemia; CML, chronic myeloid leukemia; FDR, false discovery rate; MFI, mean fluorescence intensity; NES, normalized enrichment score.
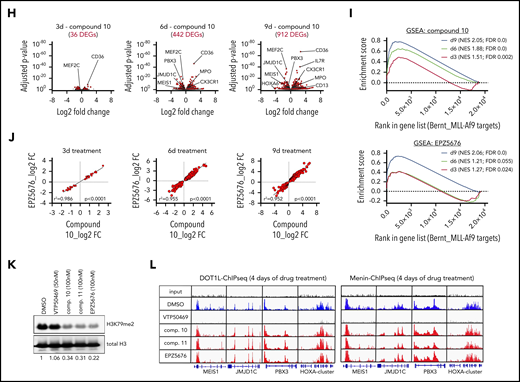
Because compounds 10 and 11 have been demonstrated to be active in vivo, we aimed to evaluate these compounds in clinically relevant patient-derived xenograft (PDX) models of MLL-rearranged leukemia. We first assessed the preclinical activity of compound 10 administrated in an MLL-AF6 PDX via drug-containing chow (Figure 2A). Compound 10 treatment was well tolerated (supplemental Figure 3A) but did not delay progression of AML over the course of 4 weeks (Figure 2B). Although disease burden in the bone marrow was reduced, spleen infiltration was only modestly affected (supplemental Figure 3B-C), potentially as a result of daytime-dependent alterations in plasma drug levels (Figure 2C). Therefore, we went on to establish a dose regimen via oral gavage. We found a dose of 100 mg/kg twice daily to exhibit toxicity (Figure 2D), whereas 75 mg/kg twice daily of both compounds 10 and 11 was tolerated (supplemental Figure 3D-E). Pharmacokinetic analysis under these treatment conditions showed stable plasma drug levels in the micromolar range for both drugs (Figure 2E).
Efficacy of compounds 10 and 11 in PDXs. (A) Schematic of mouse trial using compound 10–supplemented chow (0.05%). (B) Kinetics of peripheral blood (PB) human CD45+ cells measured by flow cytometry during treatment with compound 10 by chow (0.05%). (C) Compound 10 plasma concentrations during oral administration via chow (0.05%) in the morning compared with the afternoon, indicating variant drug levels based on feeding activity of the animals. (D) Assessment of compound 10 toxicity measured by mouse body weight during administration via oral gavage (twice daily) at 50 and 100 mg/kg. Treatment was discontinued between days 3 and 5 because of toxicity observed with the 100 mg/kg dosing. (E) Plasma concentrations of compound 10 (left) and compound 11 (right) after oral and intraperitoneal (IP) administration, respectively. This pharmacokinetic study was performed at 14 days of twice-daily treatment to reflect the drug levels in PB during ongoing administration. Both drugs were solubilized in Kolliphor HS 15 before administration. (F) Schematic of PDX mouse trial using 2 different patient-derived samples and 2 novel DOT1L inhibitors as indicated. Both PDX grafts have been used and published by our laboratory before: PDX 1 (ID:68552; Krivtsov et al5 in 2019) and PDX 2 (ID:17; Wang et al17 in 2017). (G-H) Kinetics of PB human CD45+ cells measured by flow cytometry during treatment with compound 10 (G) or compound 11 (H). Statistics were performed at the end point of the experiment (4 weeks on treatment), comparing treated and nontreated animals using unpaired t test. (I) Human CD45+ cells measured by flow cytometry in the bone marrow, spleen, and PB at the experimental end point (4 weeks on treatment; same animals as shown in Figure 1G-H) after compound 10 (top) or compound 11 (bottom) treatment. (J) Spleen weights (in mg) at the experimental end point after compound 10 (top) or compound 11 (bottom) treatment. (K) Blood cell counts in the PDX 1 cohort treated with compound 10 at the end point of the experiment. (L) CD11b surface expression on human CD45+ cells in the bone marrow of mice treated with compound 10 at the experimental end point. (M) Gene expression of MEIS1 and HOXA10 in PB leukemia cells of PDX 1 cohort mice treated with compound 10 at 14 days after initiation of treatment. Quantitative real-time polymerase chain reaction was performed using validated Taqman assays. (N) Western blot of H3K79me2 and total H3 as control in PDX cells from bone marrow of each of 2 representative mice (PDX 1) treated with compound 10 or vehicle. Statistics for all comparisons were performed using unpaired t test. *P < .05, **P < .01, ***P < .001, ****P < .0001. HB, hemoglobin; PBMC, peripheral blood mononuclear cell; PLT, platelet; sAML, secondary AML; WBC, white blood cell.
Efficacy of compounds 10 and 11 in PDXs. (A) Schematic of mouse trial using compound 10–supplemented chow (0.05%). (B) Kinetics of peripheral blood (PB) human CD45+ cells measured by flow cytometry during treatment with compound 10 by chow (0.05%). (C) Compound 10 plasma concentrations during oral administration via chow (0.05%) in the morning compared with the afternoon, indicating variant drug levels based on feeding activity of the animals. (D) Assessment of compound 10 toxicity measured by mouse body weight during administration via oral gavage (twice daily) at 50 and 100 mg/kg. Treatment was discontinued between days 3 and 5 because of toxicity observed with the 100 mg/kg dosing. (E) Plasma concentrations of compound 10 (left) and compound 11 (right) after oral and intraperitoneal (IP) administration, respectively. This pharmacokinetic study was performed at 14 days of twice-daily treatment to reflect the drug levels in PB during ongoing administration. Both drugs were solubilized in Kolliphor HS 15 before administration. (F) Schematic of PDX mouse trial using 2 different patient-derived samples and 2 novel DOT1L inhibitors as indicated. Both PDX grafts have been used and published by our laboratory before: PDX 1 (ID:68552; Krivtsov et al5 in 2019) and PDX 2 (ID:17; Wang et al17 in 2017). (G-H) Kinetics of PB human CD45+ cells measured by flow cytometry during treatment with compound 10 (G) or compound 11 (H). Statistics were performed at the end point of the experiment (4 weeks on treatment), comparing treated and nontreated animals using unpaired t test. (I) Human CD45+ cells measured by flow cytometry in the bone marrow, spleen, and PB at the experimental end point (4 weeks on treatment; same animals as shown in Figure 1G-H) after compound 10 (top) or compound 11 (bottom) treatment. (J) Spleen weights (in mg) at the experimental end point after compound 10 (top) or compound 11 (bottom) treatment. (K) Blood cell counts in the PDX 1 cohort treated with compound 10 at the end point of the experiment. (L) CD11b surface expression on human CD45+ cells in the bone marrow of mice treated with compound 10 at the experimental end point. (M) Gene expression of MEIS1 and HOXA10 in PB leukemia cells of PDX 1 cohort mice treated with compound 10 at 14 days after initiation of treatment. Quantitative real-time polymerase chain reaction was performed using validated Taqman assays. (N) Western blot of H3K79me2 and total H3 as control in PDX cells from bone marrow of each of 2 representative mice (PDX 1) treated with compound 10 or vehicle. Statistics for all comparisons were performed using unpaired t test. *P < .05, **P < .01, ***P < .001, ****P < .0001. HB, hemoglobin; PBMC, peripheral blood mononuclear cell; PLT, platelet; sAML, secondary AML; WBC, white blood cell.
For assessment of treatment efficacy, we transplanted human MLL-AF6 and MLL-AF9 AML cells into NSG mice. After engraftment was confirmed using flow cytometry, mice were separated into treatment and control cohorts and treated with either compound 10 (75 mg/kg orally twice daily), compound 11 (75 mg/kg intraperitoneally twice daily), or a respective vehicle control for 4 weeks (Figure 2F). We monitored the percentage of human cells in the blood and found a significant reduction in both PDX models after compound 10 or 11 treatment (Figure 2G-H). Enzymatic DOT1L inhibition took ∼20 days to exert therapeutic effects, presumably because of its dependency on chromatin reorganization during treatment. At the end point of the experiment (4 weeks on treatment), both compounds 10 and 11 had significantly reduced leukemia burden in bone marrow, spleen, and peripheral blood of PDXs (Figure 2I-J). In the peripheral blood of a highly leukemic cohort of mice (PDX 1), we observed a reduction of total white blood cells and a recovery of platelet counts, whereas the hemoglobin concentration remained unaffected by oral treatment with compound 10 (Figure 2K). Similar to our findings in vitro, compound 10 treatment led to a significant increase in CD11b expression on AML cells (Figure 2L; supplemental Figure 3F). To confirm the on-target activity of the orally bioavailable compound 10, we performed quantitative real-time polymerase chain reaction for MEIS1 and HOXA10 from peripheral blood mononuclear cells of the PDX 1 cohort as well as H3K79me2 western blot from bone marrow. We observed a significant reduction in both MEIS1 and HOXA10 RNA abundance and H3K79me2 after compound 10 treatment (Figure 2M-N).
In summary, we provide evidence that DOT1L inhibitors compound 10 and compound 11 act in a near-identical fashion to the established drug EPZ5676. Unlike EPZ5676, these compounds can be easily administered to mice (oral and intraperitoneal routes) and demonstrate promising antileukemic properties in preclinical PDX models of leukemia. The availability of these drugs now offers the opportunity to evaluate single-inhibitor and combination treatment regimens of DOT1L inhibitors with other drugs in relevant preclinical in vivo systems. Because a number of molecules that target epigenetic mechanisms of action are being assessed in leukemia (eg, demethylating agents and histone deacetylase, EZH2, LSD1, and Menin inhibitors), there is an urgent need to study combinations to improve clinical efficacy and disrupt oncogenic chromatin states. The development of these molecules will aid in the assessment of novel combination approaches for the treatment of AML.
All sequencing data generated for this study are publicly available via the Gene Expression Omnibus database (Super series: GSE149185; RNA sequencing data: GSE149184; ChIP-sequencing data: GSE149183).
The online version of this article contains a data supplement.
Acknowledgments
The authors thank Elizabeth Frank for her help with data analysis and also thank Dario Sterker for his support performing the pharmacokinetic studies.
This research was supported by a grant from Novartis.
Authorship
Contribution: A.V.K., S.A.A., and F.P. designed the experiments; J.Y.G., Y.X., F.P., F.S., C.G., A.W., and B.K.E. performed the experiments; A.V.K., F.P., C.H., R.T., and S.A.A. analyzed and interpreted the data; and F.P., J.A.P., A.V.K., and S.A.A. wrote and edited the manuscript.
Conflict-of-interest disclosure: S.A.A. has been a consultant and/or shareholder for Epizyme, Inc, Vitae/Allergan Pharmaceuticals, Imago Biosciences, Cyteir Therapeutics, C4 Therapeutics, Syros Pharmaceuticals, OxStem Oncology, Accent Therapeutics, and Mana Therapeutics and has received research support from Janssen, Novartis, and AstraZeneca. F.S., A.W., C.G., and R.T. are full-time employees and shareholders of Novartis. The remaining authors declare no competing financial interests.
Correspondence: Andrei V. Krivtsov, Department of Pediatric Oncology, Dana-Farber Cancer Institute, 360 Longwood Ave, Longwood Center, LC 8214, Boston, MA 02215; e-mail: andrei_krivtsov@dfci.harvard.edu; and Scott A. Armstrong, Department of Pediatric Oncology, Dana-Farber Cancer Institute, 360 Longwood Ave, Longwood Center, LC 8214, Boston, MA 02215; e-mail: scott_armstrong@dfci.harvard.edu.

This feature is available to Subscribers Only
Sign In or Create an Account Close Modal