

Key Points
Specific gene mutation combinations correlate with morphologic MDS/MPN subtypes and help elucidate the heterogeneity in these neoplasms.
Patients with MDS/MPN-U display different molecular profiles that mimic the ones observed in other MDS/MPN subtypes.

Abstract
More than 90% of patients with myelodysplastic/myeloproliferative neoplasms (MDSs/MPNs) harbor somatic mutations in myeloid-related genes, but still, current diagnostic criteria do not include molecular data. We performed genome-wide sequencing techniques to characterize the mutational landscape of a large and clinically well-characterized cohort including 367 adults with MDS/MPN subtypes, including chronic myelomonocytic leukemia (CMML; n = 119), atypical chronic myeloid leukemia (aCML; n = 71), MDS/MPN with ring sideroblasts and thrombocytosis (MDS/MPN-RS-T; n = 71), and MDS/MPN unclassifiable (MDS/MPN-U; n = 106). A total of 30 genes were recurrently mutated in ≥3% of the cohort. Distribution of recurrently mutated genes and clonal architecture differed among MDS/MPN subtypes. Statistical analysis revealed significant correlations between recurrently mutated genes, as well as genotype-phenotype associations. We identified specific gene combinations that were associated with distinct MDS/MPN subtypes and that were mutually exclusive with most of the other MDSs/MPNs (eg, TET2-SRSF2 in CMML, ASXL1-SETBP1 in aCML, and SF3B1-JAK2 in MDS/MPN-RS-T). Patients with MDS/MPN-U were the most heterogeneous and displayed different molecular profiles that mimicked the ones observed in other MDS/MPN subtypes and that had an impact on the outcome of the patients. Specific gene mutations also had an impact on the outcome of the different MDS/MPN subtypes, which may be relevant for clinical decision-making. Overall, the results of this study help to elucidate the heterogeneity found in these neoplasms, which can be of use in the clinical setting of MDS/MPN.
Introduction
Myelodysplastic/myeloproliferative neoplasms (MDSs/MPNs) are rare clonal hematopoietic malignancies with overlapping features from myelodysplastic syndromes (MDSs) and myeloproliferative neoplasms (MPNs). According to the 2017 World Health Organization (WHO) Classification, types of adult MDSs/MPNs include chronic myelomonocytic leukemia (CMML), atypical chronic myeloid leukemia (aCML), MDS/MPN with ring sideroblasts and thrombocytosis (MDS/MPN-RS-T), and MDS/MPN unclassifiable (MDS/MPN-U).1 Because of the overlapping features between these entities, as well as between MDS and MPN, differential diagnosis remains a challenge in many cases. According to previous studies, >90% of patients with MDS/MPN harbor somatic mutations in a group of known genes that are related to their pathophysiological features and play a role in their clinical heterogeneity.2-5 However, none of them is specific to MDS/MPN, and current diagnostic criteria do not include molecular data. A great effort has been made to understand how these mutations influence clinical phenotype and disease evolution, especially in CMML. These patients show frequent (40% to 50%) mutations in TET2, SRSF2, and ASXL1.6 Biallelic TET2 mutations and the TET2-SRSF2 combination are associated with monocytosis and CMML, whereas the presence of mutations in signaling genes (eg, K/NRAS, CBL, and JAK2) is more prevalent in the myeloproliferative subtype.2,7,8 Mutations in ASXL1 have been consistently associated with unfavorable outcomes and thus are included in current CMML-specific prognostic scores.2,6,9 However, the other MDS/MPN groups are in need of more extensive molecular studies. On the one hand, aCML, the most aggressive subtype of MDS/MPN, shows a high frequency of mutations in SETBP1 (30%), though their prognostic impact remains unclear.10,11 One study performed in 25 patients with aCML identified recurrent (>10%) mutations in ASXL1, TET2, NRAS, SETBP1, and RUNX1, with only TET2 mutations being associated with decreased overall survival.4 On the other hand, patients with MDS/MPN-RS-T have a mild course and are characterized by a high frequency of mutations in SF3B1 (90%), that strongly correlate with bone marrow ring sideroblasts, and mutations in JAK2 (40%), that correlate with platelet count.3,12 Less frequently mutated genes include TET2, DNMT3A, and ASXL1, according to 2 targeted molecular studies performed in 92 and 48 patients with MDS/MPN-RS-T, respectively.3,13 Finally, patients with MDS/MPN-U, the least well characterized of these syndromes, show recurrent mutations in several myeloid-related genes, as recently reported by Bose et al,5 though none of them predicts the outcome of the patients.5 In this study, we used genome-wide sequencing techniques to characterize the mutational landscape of 367 patients with MDS/MPN and to establish genotype-phenotype associations. We sought to identify potential diagnostic and prognostic molecular markers that can be applied in medical practice and provide novel insights into the hierarchy of mutations in MDS/MPN.
Methods
Patients and samples
A total of 367 adult patients with MDS/MPN, diagnosed according to the WHO Classification,1 were enrolled in this study. Bone marrow (BM) and peripheral blood (PB) samples from these patients had been sent for diagnosis to the Munich Leukemia Laboratory (MLL; n = 349) or the Institut Català d’Oncologia-Hospital Germans Trias i Pujol (ICO-HGTiP; n = 18). Routine analyses were performed in all cases, including cytomorphology, conventional chromosome banding analysis (CBA) and, in part, standard molecular analyses. Retrospective DNA samples from BM and PB, obtained at diagnosis or from treatment-naive patients, were collected in all cases. Informed consent was obtained from each patient. In addition, clinical and molecular data from 50 patients with MDS/MPN-U treated at the Cleveland Clinic were collected for validation purposes. The study adhered to the tenets of the Declaration of Helsinki and was approved by the internal review board of the MLL and the Ethics Committee of ICO-HGTiP.
Whole-genome and whole-exome sequencing
Whole-genome sequencing (WGS) was performed in 349 cases of MDS/MPN. Libraries were generated from 1 μg of DNA, by using the TruSeq PCR-Free prep kit according to the manufacturer’s recommendations (Illumina, San Diego, CA) and sequenced on NovaSeq6000/HiSeqX Illumina instruments by following a 2 × 150-bp paired-end–reads standard protocol at a mean depth of coverage of >100×. Whole-exome sequencing (WES) was performed in the remaining 18 patients. Libraries were generated from 1 μg of DNA with the SureSelect Human Exome Kit 51 Mb v5 (Agilent, Santa Clara, CA) and sequenced on a HiSeq2500 Illumina instrument, according to a 2 × 100-bp paired-end–reads protocol at a mean coverage of >200×.
WGS and WES data analysis
WGS and WES data were analyzed on Illumina’s BaseSpace Sequence Hub and in-house pipelines. Reads were aligned against human genome build 19 (hg19) with the tool Isaac3.14 Variant calling was performed using Strelka2,15 and variants were annotated with Ensembl VEP.16 For the purpose of this study, only exonic (nonsynonymous single-nucleotide variants and small insertions/deletions) and splicing variants were considered. Because control paired samples were not available, tumor-unmatched normal variant calling was performed with a pool of sex-matched DNA (Promega, Madison, WI), followed by a strict variant filtering process (supplemental Methods, available on the Blood Web site). In addition, GATK4 (version 4.0.2.1) was used for calling copy number aberrations (supplemental Methods). Copy number neutral loss of heterozygosity (LOH) regions were detected with CANVAS 1.3.1, called by Illumina tumor/normal APP 3.0.0. Again, unmatched-normal variant calling was performed using a pool of sex-matched DNA.17
VAF adjustment and clonal hierarchy analysis
Variant allele frequency (VAF) estimates were used to evaluate clonal and subclonal variant relationships within each sample. First, VAF values were adjusted for both copy number and zygosity. Then, mutations were assigned as ancestral for dominant hits and secondary for subsequent subclonal hits. For the purpose of this study, a cutoff of at least a 5% difference between VAFs was used to distinguish ancestral/dominant mutations (higher VAFs) from subclonal hits, whereas mutations with a VAF difference of <5% were referred to as codominant, as previously reported.7,18 Of note, there are several limitations associated with this approach (supplemental Methods). Biallelic TET2 or TP53 were deemed to be present when there were 2 heterozygous TET2 or TP53 mutations with a VAF sum of >55% or when there were homozygous TET2 or TP53 mutations (single TET2 or TP53 mutation with VAF >55% in the presence of 4q24 deletion or LOH, or 17p13.1 deletion or LOH, respectively).
Statistical analysis
Baseline characteristics are described as median and range for continuous variables and frequency and percentage for categorical variables. Comparisons between patient subsets were performed by χ2, Fisher’s exact, or Mann-Whitney U test, as appropriate. Pairwise associations between genes were evaluated by Fisher’s exact test corrected for multiple-hypothesis testing. Overall survival (OS) was defined as time from diagnosis to the last follow-up or death from any cause. In patients who underwent allogeneic stem cell transplantation (SCT), duration of follow-up was censored at the time of SCT. Of note, OS could still be influenced by other treatment strategies, which were highly heterogeneous across patients (Table 1). Survival curves were calculated by using the Kaplan-Meier method, and the log-rank test was used for comparisons between groups. Two-sided P < .05 was considered statistically significant. The R statistical package (version 1.2.5033) and the statistical package SPSS, version 23.0 (SPSS Inc., Chicago, IL) were used for all analyses.
Main demographic, hematological, and clinical data from the MDS/MPN cohort
| Variable | Baseline distribution in the cohort (n = 367) | |||
|---|---|---|---|---|
| CMML (n = 119) | aCML (n = 71) | MDS/MPN-RS-T (n = 71) | MDS/MPN-U (n = 106) | |
| Demographics | ||||
| Sex, n (%) | ||||
| Male | 79 (66) | 50 (70) | 27 (38) | 67 (63) |
| Female | 40 (34) | 21 (30) | 44 (62) | 39 (37) |
| Age, years, median (range) | 77 (50-89) | 74 (50-92) | 74 (44-93) | 75 (32-91) |
| Blood counts, median (range) | ||||
| Hb, g/dL | 11.8 (7.0-16.6) | 10.1 (5.8-14.6) | 9.4 (6.0-12.2) | 9.4 (4.9-14.9) |
| WBC count, ×109/L | 16.1 (2.8-86.9) | 44.8 (15.6-325.0) | 6.6 (2.4-19.7) | 27.3 (1.2-202.4) |
| Platelets, ×109/L | 119 (14-1,77) | 102 (60-786) | 564 (454-1,416) | 121 (7-2,276) |
| Neutrophils, ×109/L | 8.2 (0.3-54.7) | 28.53 (3.6-162.5) | 4.0 (1.8-8.6) | 18.2 (0.3-123.5) |
| Monocytes, ×109/L | 4.0 (1.0-95.7) | 0.8 (0.0-17.8) | 0.2 (0-0.7) | 0.7 (0-13.5) |
| Blasts, % | 0 (0-9) | 2 (0-18) | 0 (0-1) | 1 (0-10) |
| Bone marrow features | ||||
| Blasts, median (range) | 6 (0-19) | 1 (0-19) | 2 (0-6) | 2 (0-15) |
| <5%, n (%) | 81 (68) | 54 (76) | 68 (96) | 76 (72) |
| ≥5%, n (%) | 38 (32) | 17 (24) | 3 (4) | 30 (28) |
| Ring sideroblasts, median (range) | 0 (0-18) | 0 (0-14) | 66 (18-97) | 0 (0-84) |
| Cytogenetics | ||||
| Available, n/total n (%) | 119/119 (100%) | 69/71 (97%) | 69/71 (97%) | 102/106 (96%) |
| Normal karyotype, n (%) | 99 (83%) | 40 (58%) | 62 (90%) | 54 (53%) |
| Altered karyotype, n (%) | 20 (17%) | 29 (42%) | 7 (10%) | 48 (47%) |
| +8, n (%) | 6 (5%) | 12 (17%) | 3 (4%) | 26 (25%) |
| Isolated, n | 4 | 9 | 2 | 17 |
| +1 Abnormality, n | 2 | 2 | 1 | 3 |
| In CK, n | 0 | 1 | 0 | 6 |
| −7/del(7q), n (%) | 4 (3) | 4 (6) | 0 (0) | 12 (12) |
| Isolated, n | 3 | 0 | 0 | 5 |
| +1 Abnormality, n | 1 | 1 | 0 | 2 |
| In CK, n | 0 | 3 | 0 | 5 |
| −Y, n (%) | 4 (3) | 1 (1) | 3 (4) | 1 (1) |
| Complex karyotype, n (%) | 0 (0) | 3 (4) | 0 (0) | 12 (12) |
| Treatment, n (%) | ||||
| Cases with treatment information | 103 (87) | 57 (80) | 64 (90) | 86 (81) |
| No treatment | 52 (50) | 18 (32) | 35 (55) | 31 (36) |
| Supportive care | 17 (17) | 3 (5) | 21 (33) | 9 (11) |
| Azacytidine | 11 (11) | 4 (7) | 1 (2) | 6 (7) |
| Cytoreductive treatment | 18 (17) | 30 (53) | 6 (9) | 33 (38) |
| AML-induction therapy | 5 (5) | 2 (3) | 1 (2) | 7 (8) |
| Allogenic SCT | 5 (5) | 5 (9) | 1 (2) | 5 (6) |
| Outcome | ||||
| Cases with follow-up, n (%) | 99 (83) | 56 (79) | 52 (73) | 73 (69) |
| Median follow-up, median mo (range) | 39 (2-112) | 12 (3-98) | 48 (2-163) | 21 (2-182) |
| Leukemic transformation, n (%) | 16/91 (18) | 4/45 (9) | 4/47 (9) | 6/61 (10) |
| OS, median mo (95% CI) | 74 (48-101) | 16 (12-20) | NR | 80 (NR) |
AML, acute myeloid leukemia; CI, confidence interval; Hb, hemoglobin; NR, not reached; SCT, stem cell transplant.
Results
Characteristics of the MDS/MPN cohort
Frequency and spectrum of chromosomal abnormalities and gene mutations
CBA was available in 359 patients and revealed an abnormal karyotype in 29% (103 of 359) of MDSs/MPNs, with +8 (12%), −7/del(7q) (5%), and −Y (3%) being the most recurrent abnormalities (Table 1). Complex karyotypes (≥3 alterations; CKs) were detected in 4% of patients. Chromosomal abnormalities were uncommon in MDS/MPN-RS-T (10%) and CMML (17%), in contrast to aCML (42%) and MDS/MPN-U (47%), which showed higher genomic instability (Table 1; supplemental Figure 2).
A total of 20 304 variants were retained after variant filtering (supplemental Table 1), with a mean of 55 variants per patient. MDS/MPN-RS-T patients had a lower mean number of variants per patient compared with other MDS/MPN subtypes (48 in MDS/MPN-RS-T vs 55 in CMML, 58 in MDS/MPN-U, and 60 in aCML; P < .001; supplemental Figure 3). The frequency of base substitutions (C>A, C>G, C>T, T>A, T>C and T>G) was comparable across the MDS/MPN WHO subtypes (supplemental Figure 4). A mean of 5 variants per patient affected the genes previously reported in myeloid neoplasms (supplemental Table 2). Overall, 30 genes were recurrently mutated in ≥3% of the MDS/MPN cohort, all of which had already been reported in myeloid neoplasms, being ASXL1 (51%), TET2 (45%), SRSF2 (35%), SF3B1 (24%), JAK2 (19%), EZH2 (17%), RUNX1 (17%), SETBP1 (15%), NRAS (13%), CBL (13%), and KRAS (10%) the most frequent (Figure 1A; supplemental Figure 5). To focus on mutations that are more likely to be clinically relevant, we restricted further analyses to these genes. However, the distribution of gene frequencies was different across the 4 MDS/MPN subtypes (Figure 1B; supplemental Table 3) and, focusing on specific subgroups, less frequent mutations were detected in novel genes, including APC2 (6%) in aCML, HEPHL1 (6%) and PAFAH2 (6%) in MDS/MPN-RS-T, and ZBTB33 (5%) in MDS/MPN-U (supplemental Figure 6). The somatic origin of these mutations could not be confirmed because of the lack of germline controls.
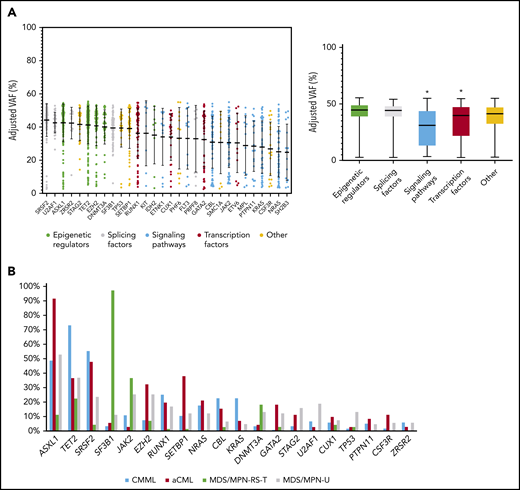
Recurrent gene mutations in MDS/MPN. (A) Distribution of adjusted VAFs across recurrently mutated genes individually (left) or grouped according to their functional category (right). The median-adjusted VAF of signaling genes was significantly lower than that of epigenetic regulators (P < .0001), splicing factors (P < .0001), transcription factors (0.0007), and other genes (P < .0001). The median-adjusted VAF of transcription factors was significantly lower than those of the epigenetic regulators (P < .0001) and splicing factors (P < .0001). (B) Bar plot showing the frequency of recurrently mutated genes among the different MDS/MPN subtypes.
Recurrent gene mutations in MDS/MPN. (A) Distribution of adjusted VAFs across recurrently mutated genes individually (left) or grouped according to their functional category (right). The median-adjusted VAF of signaling genes was significantly lower than that of epigenetic regulators (P < .0001), splicing factors (P < .0001), transcription factors (0.0007), and other genes (P < .0001). The median-adjusted VAF of transcription factors was significantly lower than those of the epigenetic regulators (P < .0001) and splicing factors (P < .0001). (B) Bar plot showing the frequency of recurrently mutated genes among the different MDS/MPN subtypes.
Copy number variation (CNV) analysis was performed on WGS data (n = 359). A total of 166 CNVs (110 losses and 56 gains) >1 Mb were identified. Of these, 51 fell below the resolution of CBA (<10 Mb). Among the rest, 105 of 115 were also detected by CBA (91% of concordance; supplemental Figure 7). CNVs >1 Mb were detected in 28% (98 of 349) of all MDS/MPN and in 12% (29 of 247) of patients with normal karyotype. Overall, CNV analysis revealed very few recurrent gains and losses in patients with MDS/MPN, besides those detectable by CBA (supplemental Figures 8 and 9), which were not specific to any MDS/MPN WHO subtype.
Correlation between genotype and disease phenotype
Statistical analysis revealed significant correlations between recurrently mutated genes and with chromosomal abnormalities, suggesting the presence of functional interactions among different molecular events, many of which have been reported in the spectrum of myeloid neoplasms (Figure 2A).8,19-26

Genotype-phenotype correlations. (A) Pairwise associations among recurrently mutated genes and cytogenetic abnormalities. Significant associations (adjusted P-value q < .05) are colored coded by odds ratio, where red depicts mutually exclusive gene pairs and green depicts gene pairs that are comutated more than expected by chance. Gene names are color coded according to their functional category. (B) Pairwise associations among recurrently mutated genes and hematological parameters. Significant associations (adjusted P-value q < .05) are colored by odds ratio, where green represents genotype-phenotype–positive associations and reds depict negative associations. NK, normal karyotype.
Genotype-phenotype correlations. (A) Pairwise associations among recurrently mutated genes and cytogenetic abnormalities. Significant associations (adjusted P-value q < .05) are colored coded by odds ratio, where red depicts mutually exclusive gene pairs and green depicts gene pairs that are comutated more than expected by chance. Gene names are color coded according to their functional category. (B) Pairwise associations among recurrently mutated genes and hematological parameters. Significant associations (adjusted P-value q < .05) are colored by odds ratio, where green represents genotype-phenotype–positive associations and reds depict negative associations. NK, normal karyotype.
We then searched for genotype-phenotype associations and investigated the correlation between molecular events and MDS/MPN subtypes or main biological parameters, including PB counts, BM features, and the presence of myelodysplasia (Figure 2B). Several positive correlations were detected between MDS/MPN subtypes and gene mutations, the strongest being MDS/MPN-RS-T with SF3B1 and JAK2; aCML with ASXL1 and SETBP1; CMML with TET2, SRSF2 or KRAS; and MDS/MPN-U with TP53 and U2AF1. Accordingly, mutations in those and other genes were associated with the presence or absence of specific hematological features that are distinctive in those entities, such as thrombocytosis, leukocytosis, or ring sideroblasts.
Clonal hierarchy of DTA mutations
Clonal and subclonal variant relationships within each sample were inferred based on VAF values adjusted by copy number and zygosity, according to karyotypes and CNV and LOH analysis performed on WGS data (supplemental Table 4). Given the limitations of this approach (supplemental Methods), this analysis was used to identify molecular events that occur earlier or later in MDS/MPN in a recurrent manner. Epigenetic regulators and splicing factors showed significantly higher VAFs compared with transcription factors and signaling genes, and therefore represent major driver events in MDS/MPN (Figure 1A). SF3B1 was frequently detected as a primary hit (78 of 367; 21%) and, in many cases (44 of 367; 12%), it was seen as a single founder event. Mutations in clonal hematopoiesis-related genes (DNMT3A, TET2, and ASXL1 [DTA genes]) were present in the ancestral clone in 67% (246 of 367) of the patients. Interestingly, a specific phenotype was observed in patients with ancestral DNMT3A, depending on codominant mutations, whereas more heterogeneous patterns of codominant/secondary hits were observed for TET2 and ASXL1 (supplemental Figure 10).
Clonal architecture of MDS/MPN subtypes
Overall, mutational profile (Figure 1B; supplemental Table 3) and clonal architecture were different across MDS/MPN subtypes. Patients with CMML (n = 119; Figure 3) showed a high frequency of ancestral TET2 mutations (85 of 119; 71%) that were commonly associated with a combination of biallelic TET2 (55 of 119; 46%; P < .0001) and TET2-SRSF2 (54 of 119; 45%; P < .0001). Mutations in SRSF2 (66 of 119; 55%) and ASXL1 (58 of 119; 49%) were commonly detected as founder lesions (49 of 119; 41%). Secondary mutations in these 2 genes (14 of 119 for SRSF2 and 9 of 119 for ASXL1) were preceded by TET2 mutations, except in 1 case each. Mutations in RUNX1 (30 of 119; 25%) were detected either as ancestral or secondary hits, but they never preceded TET2 or SRSF2, suggesting that, even in cases of codominance, RUNX1 may have been acquired later. Mutations in signaling genes such as CBL, K/NRAS, or JAK2 were commonly found in secondary clones. Regarding aCML (n = 71; Figure 4), it was characterized by the presence of ASXL1 mutations (65 of 71; 92%; P < .0001), usually present in the ancestral clone (56 of 71; 79%). Frequent codominant genes included SRSF2, TET2, EZH2, SETBP1, and GATA2. aCML was strongly associated with SETBP1 mutations (27 of 71; 38%; P < .0001), which were equally codominant or secondary to ASXL1. No patients were found to have ancestral SETBP1 and secondary ASXL1 mutations, suggesting that, in patients with this combination, ASXL1 may have been acquired earlier. Genes recurrently detected in smaller secondary clones included CSF3R, EZH2, and signaling genes. In contrast, patients with MDS/MPN-RS-T (n = 71; Figure 5) displayed much less heterogeneity. Overall, the most frequent mutations involved SF3B1 (97%), JAK2 (37%), and the DTA genes TET2 (23%), DNMT3A (18%), and ASXL1 (11%). Most SF3B1 mutations corresponded to ancestral hits (94%), whereas a few were secondary to DNMT3A (6%). DNMT3A mutations were always founder mutations, whereas TET2 and ASXL1 were detected in either ancestral or secondary clones, but never preceded SF3B1. Secondary hits in signaling genes included JAK2 (31%), SH2B3 (4%), and MPL (4%). Of note, no mutations in the Ras/MAPK pathway (K/NRAS, PTPN11, FLT3, and NF1) were detected in these patients. Finally, cases of MDS/MPN-U (n = 106) displayed the most heterogeneous molecular profile with a higher frequency of TP53 mutations (13 of 106; 12%; P = .0003), compared with the other MDS/MPN subtypes.
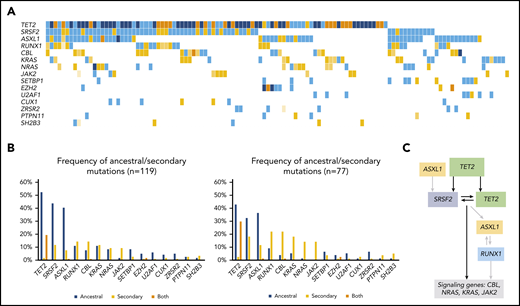
Molecular landscape and clonal architecture of CMML. (A) Oncoplot showing recurrently mutated genes and ancestry in CMML: blue depicts ancestral mutations (darker blue represents cases with 2 ancestral mutations in the same gene, mainly corresponding to biallelic TET2 mutations); yellow depicts secondary mutations and the intensity of the shade indicates the size of the VAF, where darker yellow represents mutations with higher VAFs that have probably been acquired earlier; orange depicts cases with 2 mutations in the same gene in which 1 mutation is ancestral and the other is secondary (mainly corresponding to biallelic TET2 mutations). (B) Frequency of ancestral/secondary mutations per gene in all patients with CMML (n = 1191; left) and in patients who present with at least 2 different clones (n = 77; right). (C) The clonal architecture of CMML. Black arrows depict most common events; gray arrows depict events that are recurrent but occur less frequently.
Molecular landscape and clonal architecture of CMML. (A) Oncoplot showing recurrently mutated genes and ancestry in CMML: blue depicts ancestral mutations (darker blue represents cases with 2 ancestral mutations in the same gene, mainly corresponding to biallelic TET2 mutations); yellow depicts secondary mutations and the intensity of the shade indicates the size of the VAF, where darker yellow represents mutations with higher VAFs that have probably been acquired earlier; orange depicts cases with 2 mutations in the same gene in which 1 mutation is ancestral and the other is secondary (mainly corresponding to biallelic TET2 mutations). (B) Frequency of ancestral/secondary mutations per gene in all patients with CMML (n = 1191; left) and in patients who present with at least 2 different clones (n = 77; right). (C) The clonal architecture of CMML. Black arrows depict most common events; gray arrows depict events that are recurrent but occur less frequently.

Molecular landscape and clonal architecture of aCML. (A) Oncoplot showing recurrently mutated genes and ancestry in aCML: pink depicts ancestral mutations (darker pink represents cases with 2 ancestral mutations in the same gene); yellow depicts secondary mutations, and the intensity of the shade indicates the size of the VAF (darker yellow represents mutations with higher VAFs that have probably been acquired earlier); purple depicts cases with 2 mutations in the same gene in which 1 mutation is ancestral and the other is secondary. (B) Frequency of ancestral/secondary mutations per gene in all patients with aCML (n = 71; left) and in patients who present with at least 2 different clones (n = 49; right). (C) The clonal architecture of aCML. Black arrows depict most common events; gray arrows depict events that are recurrent but occur less frequently.
Molecular landscape and clonal architecture of aCML. (A) Oncoplot showing recurrently mutated genes and ancestry in aCML: pink depicts ancestral mutations (darker pink represents cases with 2 ancestral mutations in the same gene); yellow depicts secondary mutations, and the intensity of the shade indicates the size of the VAF (darker yellow represents mutations with higher VAFs that have probably been acquired earlier); purple depicts cases with 2 mutations in the same gene in which 1 mutation is ancestral and the other is secondary. (B) Frequency of ancestral/secondary mutations per gene in all patients with aCML (n = 71; left) and in patients who present with at least 2 different clones (n = 49; right). (C) The clonal architecture of aCML. Black arrows depict most common events; gray arrows depict events that are recurrent but occur less frequently.

Molecular landscape and clonal architecture of MDS/MPN-RS-T. (A) Oncoplot showing recurrently mutated genes and ancestry in MDS/MPN-RS-T: green depicts ancestral mutations (darker green represents cases with 2 ancestral mutations in the same gene); yellow depicts secondary mutations, and the intensity of the shade indicates the size of the VAF, where darker yellow represents mutations with higher VAF which have probably been acquired earlier; orange depicts cases with 2 mutations in the same gene, where 1 mutation is ancestral and the other is secondary. (B) Frequency of ancestral/secondary mutations per gene in all patients with MDS/MPN-RS-T (n = 71; left) and in patients who present with at least 2 different clones (n = 4; right). (C) The clonal architecture of MDS/MPN-RS-T. Black arrows depict most common events; gray arrows depict events that are recurrent but occur less frequently.
Molecular landscape and clonal architecture of MDS/MPN-RS-T. (A) Oncoplot showing recurrently mutated genes and ancestry in MDS/MPN-RS-T: green depicts ancestral mutations (darker green represents cases with 2 ancestral mutations in the same gene); yellow depicts secondary mutations, and the intensity of the shade indicates the size of the VAF, where darker yellow represents mutations with higher VAF which have probably been acquired earlier; orange depicts cases with 2 mutations in the same gene, where 1 mutation is ancestral and the other is secondary. (B) Frequency of ancestral/secondary mutations per gene in all patients with MDS/MPN-RS-T (n = 71; left) and in patients who present with at least 2 different clones (n = 4; right). (C) The clonal architecture of MDS/MPN-RS-T. Black arrows depict most common events; gray arrows depict events that are recurrent but occur less frequently.
Molecular signatures in MDS/MPN subtypes
Considering that some mutations were strongly associated with hematological or clinical features that vary across MDS/MPN subtypes and because some gene combinations were more frequent in specific WHO subtypes, we hypothesized that specific gene combinations could help to distinguish these entities and therefore be helpful in differential diagnosis as a complement to current diagnostic tools. To that end, we first performed principal component analysis to identify the most representative variables that collectively explained most of the variability in the original dataset (supplemental Figure 11). Although cases of MDS/MPN-U were highly heterogeneous and did not cluster together, the other WHO subtypes were better differentiated. Considering the most representative genes, we then performed pairwise associations between the presence of specific gene combinations and MDS/MPN WHO subtypes. By this method, we identified specific gene combinations that associated with distinct MDS/MPN subtypes and that, at the same time, were mutually exclusive with most of the other WHO subtypes (Figure 6A). CMML was significantly enriched in combinations with TET2, whereas combinations of ASXL1, EZH2, and SETBP1 were highly represented in aCML. Interestingly, some genes that were equally mutated in different MDS/MPN subtypes were associated with a specific subtype according to their mutated partner. For example, SRSF2 mutations were associated with CMML in combination with TET2, but correlated with aCML when comutated with SETBP1. Similarly, RUNX1 mutations significantly occurred in combination with SRSF2 in CMML and with EZH2 in aCML. Finally, patients with MDS/MPN-RS-T were characterized by SF3B1-JAK2 and SF3B1-DNMT3A combinations.

Molecular signatures in MDS/MPN. (A) Associations among MDS/MPN subtypes and specific gene combinations. Significant associations (adjusted P-value q < 0.05) are colored by odds ratio, where green depicts positive associations and red depicts negative associations. Gene combinations were used to classify cases of MDS/MPN-U according to molecular profile: CMML-, aCML-, and MDS/MPN-RS-T–like. (B) The proportion of MDS/MPN-U cases, classified according to the molecular profile. (C) Kaplan Meier curves showing the overall survival of MDS/MPN-U molecular subtypes.
Molecular signatures in MDS/MPN. (A) Associations among MDS/MPN subtypes and specific gene combinations. Significant associations (adjusted P-value q < 0.05) are colored by odds ratio, where green depicts positive associations and red depicts negative associations. Gene combinations were used to classify cases of MDS/MPN-U according to molecular profile: CMML-, aCML-, and MDS/MPN-RS-T–like. (B) The proportion of MDS/MPN-U cases, classified according to the molecular profile. (C) Kaplan Meier curves showing the overall survival of MDS/MPN-U molecular subtypes.
Molecular subtypes of MDS/MPN-U
Patients with MDS/MPN-U (n = 106) displayed highly heterogeneous molecular features that clustered within the other WHO subtypes (supplemental Figure 11A). Therefore, we used the molecular signatures previously identified to further subclassify patients with MDS/MPN-U (Figures 6A-B and 7). Classification was performed based on the presence of specific gene combinations. Patients who harbored more than 1 possible combination (n = 9; 8%) were classified according to the molecular signature present in the main clone. According to their molecular profile, 61% of MDS/MPN-U cases were categorized as “CMML-like” (n = 18; 17%), “aCML-like” (n = 35; 33%), and “MDS/MPN-RS-T–like” (n = 12; 11%; Figure 6B). In addition, 13% (n = 14) of the patients were categorized as “TP53”, because they were characterized by the presence of either mono- (n = 6) or biallelic (n = 8) TP53 mutations. The rest of the patients (“Other”; n = 27; 26%) did not show distinctive gene signatures but were enriched in U2AF1 (n = 9), JAK2 (n = 9), and ASXL1 (n = 8) mutations (Figure 7). Molecular subtypes of MDS/MPN-U displayed hematological parameters in accordance with their phenotypic group: CMML-like cases had higher monocyte count, aCML-like cases had higher white blood cell (WBC) counts, and MDS/MPN-RS-T–like cases had a higher percentage of ring sideroblasts. In contrast, TP53 patients had more anemia and higher BM blast percentage, whereas cases within the group of Other were characterized by thrombocytosis, which correlated with the presence of JAK2 mutations (supplemental Figure 12). Furthermore, significant differences in OS were observed between the 5 MDS/MPN-U molecular groups, which mimicked the outcome of the corresponding MDS/MPN subtypes, with patients within TP53 group having the most unfavorable prognosis (Figure 6C; supplemental Figure 13). The hematological parameters of MDS/MPN-U–like subgroups were also compared with their counterpart MDS/MPN WHO subtype (supplemental Figure 14). To test the utility of MDS/MPN-U molecular subtypes in a validation cohort, we collected data from 50 additional patients with MDS/MPN-U who had available clinical and molecular data obtained from targeted sequencing analyses (supplemental Table 5). Overall, 50% (25 of 50) of the patients were reclassified according to the presence of specific gene combinations: 5 (10%) as CMML-like, 11 (22%) as aCML-like, 8 (16%) as MDS/MPN-RS-T–like, and 1 (2%) as TP53, whereas the rest (n = 25; 50%) were categorized as Other. Similar to what we observed in the original dataset, OS was significantly different between those groups (supplemental Figure 15). The hematological parameters are depicted in supplemental Figure 16.
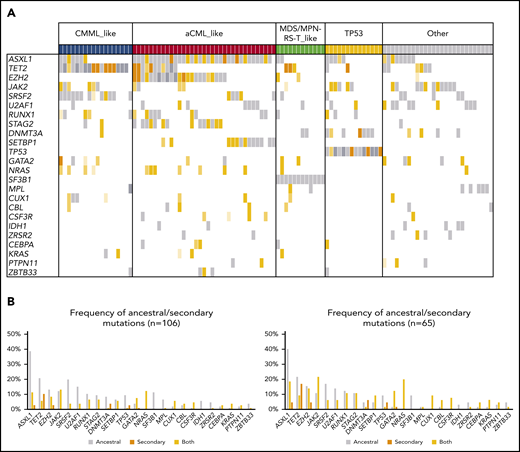
Molecular landscape and clonal architecture of MDS/MPN-U. (A) Oncoplot showing recurrently mutated genes and ancestry in MDS/MPN-U: gray depicts ancestral mutations (darker gray represents cases with 2 ancestral mutations in the same gene); yellow depicts secondary mutations, and the intensity of the shade indicates the size of the VAF, where darker yellow represents mutations with higher VAFs that probably have been acquired earlier; orange depicts cases with 2 mutations in the same gene, where 1 mutation is ancestral and the other is secondary. Patients are divided according to their molecular subtype (top of the barplot). (B) Frequency of ancestral/secondary mutations per gene in all patients with MDS/MPN-U (n = 106; left) and in those who present with at least 2 different clones (n = 65; right).
Molecular landscape and clonal architecture of MDS/MPN-U. (A) Oncoplot showing recurrently mutated genes and ancestry in MDS/MPN-U: gray depicts ancestral mutations (darker gray represents cases with 2 ancestral mutations in the same gene); yellow depicts secondary mutations, and the intensity of the shade indicates the size of the VAF, where darker yellow represents mutations with higher VAFs that probably have been acquired earlier; orange depicts cases with 2 mutations in the same gene, where 1 mutation is ancestral and the other is secondary. Patients are divided according to their molecular subtype (top of the barplot). (B) Frequency of ancestral/secondary mutations per gene in all patients with MDS/MPN-U (n = 106; left) and in those who present with at least 2 different clones (n = 65; right).
Survival analysis
Finally, we explored the impact of clinical, biological, and genetic data on patients’ outcomes in cases with available follow-up data (280 of 367; 76%; Table 1). The results of the univariate OS analysis in the MDS/MPN cohort and the 4 MDS/MPN subtypes are summarized in supplemental Table 6. The prognostic impact of demographic and hematological features differed across the spectrum of MDS/MPN subtypes. The presence of cytogenetic abnormalities was associated with an inferior OS in all MDS/MPN subtypes, except aCML. This impact was especially strong in MDS/MPN-RS-T, where abnormal karyotypes are rare but, if detected, they confer a very poor outcome. Regarding molecular features, the gene with the strongest prognostic impact was ASXL1, which was consistently associated with an unfavorable outcome across MDS/MPN subtypes, except in aCML, probably because of the already described aggressive course and the high percentage (92%) of ASXL1 mutations in this entity. Moreover, aCML was the only MDS/MPN subtype showing an improved outcome in the presence of specific gene mutations (SRSF2 and SETBP1), whereas mutations in RUNX1, NRAS, and CUX1 correlated with shorter OS (supplemental Figure 17). In CMML, mutations in the following genes were associated with a decreased OS: ASXL1 and RUNX1 mutations, both included in the molecular CMML-specific prognostic scoring system,6 and less frequent mutations in STAG2 and U2AF1 (supplemental Figure 18). In patients with MDS/MPN-RS-T, characterized by the presence of a low number of mutations, only ASXL1 and EZH2 genes were associated with a negative prognostic impact (supplemental Figure 19). Similarly, mutations in these 2 genes, as well as in STAG2, were associated with a shorter OS in MDS/MPN-U (supplemental Figure 20). Interestingly, the variable with the strongest prognostic impact in MDS/MPN-U was the molecular classification proposed in this study. Higher risk patients were the ones categorized either as aCML-like or TP53 (Figure 6C). Finally, we assessed the prognostic impact of different scoring systems previously reported in MDS/MPN (supplemental Table 6; supplemental Figures 17, 18, and 19).
Discussion
MDSs/MPNs have historically been analyzed in larger MDS or MPN cohorts, because they are rare and they present with overlapping features from both groups. However, MDS/MPN subtypes are known to be morphologically and clinically distinct,27-30 though these differences have not been widely explored at the molecular level. Analysis of oncogenic mutations in large, well-characterized cohorts of patients are essential for identifying specific genotype-phenotype associations. In this study, we used genome-wide sequencing techniques to characterize the mutational landscape of 367 adults with various types of MDS/MPN and establish genotype-phenotype associations that can be relevant in clinical decision-making.
The main limitation of this study is the lack of paired germline controls, which restricts the information that can be extracted from WGS data. Therefore, we have focused on recurrent events, which are more likely to be clinically relevant.
Our results showed that cases of MDS/MPN are characterized by the presence of mutations in genes that are common across the spectrum of myeloid neoplasms.5,13,31-33 However, the recurrence of these mutations differs across MDS/MPN subtypes. For example, CMML showed a high frequency of mutations in TET2 (73%), whereas aCML was characterized by ASXL1 mutations (92%) and MDS/MPN-RS-T by SF3B1 mutations (97%). Our results also suggest that the acquisition of mutations in MDS/MPN occurs similar to those reported in other myeloid neoplasms, with frequent founder mutations in epigenetic regulators (ASXL1, TET2, and DNMT3) and splicing factors (SF3B1 and SRSF2) and secondary hits in genes involved in signaling pathways (JAK2, N/KRAS, CBL, and ETNK1), though these patterns differ among the MDS/MPN subtypes.21,34,35 We also observed several associations between specific mutations and distinct hematological and clinical features that vary across MDS/MPN subtypes. These associations helped us to identify specific gene combinations that correlated with distinct MDS/MPN WHO subtypes and that were mutually exclusive from most of the other subtypes. We believe that these signatures can be useful in the differential diagnosis of these syndromes, which remains a challenge in many cases, and with other MDS or MPN types, such as chronic neutrophilic leukemia.33,36,37 Furthermore, these mutational signatures served as the basis for further stratifying MDS/MPN-U cases into 5 groups, according to their molecular profile: CMML-like, aCML-like, MDS/MPN-RS-T-like, TP53, and Other. Molecular subtypes of MDS/MPN-U displayed hematological parameters and clinical outcomes in accordance to their phenotypic group, suggesting that these may actually be cases of CMML, aCML or MDS/MPN-RS-T that probably did not fulfill all the WHO diagnostic criteria.
The prognostic impact of demographic and hematological features in MDS/MPN has been described but differs depending on the series. CMML is the most common MDS/MPN, and thus has been studied in depth. Several prognostic scoring systems have been historically proposed for CMML,38-42 though the inclusion of molecular markers, mainly ASXL1, has been demonstrated to improve the statistical power of the previous scores.2,6,9 In aCML, the most aggressive of MDS/MPN subtypes, common risk factors across the reported series include age, hemoglobin levels, and WBC count,4,27,30,43 all of which are included in the scoring system proposed by Onida et al27 in 2002, which also had a strong impact in our series of patients. The addition of molecular markers is expected to improve the risk stratification of patients, but no consistent markers have been described so far.4 The clinical impact of the SETBP1 mutations is controversial,10,11 and other genes associated with decreased OS in single studies include ETNK144 and TET2.4 In our study, mutations in SRSF2 and SETBP1 were associated with an improved OS, whereas EZH2 and RUNX1 were associated with decreased OS. The clinical impact of these 2 genes had only been investigated in 1 cohort including 25 aCML,4 and although our series included 71 aCML, their clinical impact should be validated in larger cohorts. In contrast, patients with MDS/MPN-RS-T have a mild course and a homogeneous molecular profile, characterized by normal karyotype and mutations in SF3B1 and JAK2.12,28,45,46 Therefore, it makes sense that, in our series, the presence of cytogenetic abnormalities or high-risk mutations (eg, ASXL1 or EZH2), though rare, correlated with very poor outcomes. Other risk factors have been proposed for this disease, but they are not reproducible among the reported series.12,13,47,48 The only specific scoring system reported in MDS/MPN-RS-T so far,13 which includes anemia, abnormal karyotype, and mutations in ASXL1 and SETBP1, had a strong impact in our series as well. Finally, patients with MDS/MPN-U are the most heterogeneous both morphologically and clinically and remain the most poorly characterized of all MDS/MPN.5,29,30,49 Our study shows that this heterogeneity can be explained at the molecular level, and that these genetic features have great prognostic impact in these patients.
In summary, we performed mutational analyses in the largest well-annotated MDS/MPN cohort to date with WGS data that provided insights into the clonal architecture of these syndromes. Our study also brings light to the molecular differences between these diseases that can be of help in the diagnosis workup of MDS/MPN. According to others and our results, we recommend performing targeted sequencing analyses in all patients with MDS/MPN-U and in any MDS/MPN patient with a controversial diagnosis. Finally, we confirmed that specific gene mutations may be useful in assessing the prognostic impact of the different MDS/MPN, which can be relevant for clinical decision-making including new targeted treatment options.
Any requests for scientific use of these data should be addressed to corresponding author of this manuscript.
The online version of this article contains a data supplement.
The publication costs of this article were defrayed in part by page charge payment. Therefore, and solely to indicate this fact, this article is hereby marked “advertisement” in accordance with 18 USC section 1734.
Acknowledgments
This work was supported by the Torsten Haferlach Leukämiediagnostik Stiftung and by a grant from Instituto de Salud Carlos III (PI17/00575). Josep Carreras Leukaemia Research Institute receives further financial support from CERCA Programme/Generalitat de Catalunya, Fundació Internacional Josep Carreras, La Caixa Foundation, and Celgene International.
Authorship
Contribution: L.P., F.S., and T.H. designed the study, reviewed the data analysis, and wrote the manuscript; L.P. analyzed the sequencing data, curated the clinical datasets, and performed the statistical analysis; L.P., M.M., and P.A. prepared the samples and performed the experiments; S.H., S.T., and F.F.-T. performed the bioinformatics analysis; V.A. performed the statistical analysis; I.F. provided the clinical data; M.M., B.X., L.Z., C.H., W.K., and T.H. diagnosed the patients and provided clinical data; V.A., C.M.K., and J.P.M. provided the clinical and molecular data for the validation cohort; and all authors reviewed the manuscript.
Conflict-of-interest disclosure: T.H., C.H., and W.K. are part owners of MLL Munich Leukemia Laboratory. M.M., S.H., S.T., and I.F. are employed by MLL. The remaining authors declare no competing financial interests.
Correspondence: Torsten Haferlach, MLL Munich Leukemia Laboratory, Max-Lebsche-Platz 31, 81377 Munich, Germany; e-mail: torsten.haferlach@mll.com.

This feature is available to Subscribers Only
Sign In or Create an Account Close Modal