

Key Points
In vivo depletion of myeloid subsets diminishes leukemia burden in multiple organs and prolongs survival in mouse models of T-ALL.
Human myeloid cells promote patient T-ALL cell survival, and elevated macrophage gene signatures correlate with worse patient prognosis.

Abstract
Despite harboring mutations in oncogenes and tumor suppressors that promote cancer growth, T-cell acute lymphoblastic leukemia (T-ALL) cells require exogenous cells or signals to survive in culture. We previously reported that myeloid cells, particularly dendritic cells, from the thymic tumor microenvironment support the survival and proliferation of primary mouse T-ALL cells in vitro. Thus, we hypothesized that tumor-associated myeloid cells would support T-ALL in vivo. Consistent with this possibility, in vivo depletion of myeloid cells results in a significant reduction in leukemia burden in multiple organs in 2 distinct mouse models of T-ALL and prolongs survival. The impact of the myeloid compartment on T-ALL growth is not dependent on suppression of antitumor T-cell responses. Instead, myeloid cells provide signals that directly support T-ALL cells. Transcriptional profiling, functional assays, and acute in vivo myeloid-depletion experiments identify activation of IGF1R as a critical component of myeloid-mediated T-ALL growth and survival. We identify several myeloid subsets that have the capacity to directly support survival of T-ALL cells. Consistent with mouse models, myeloid cells derived from human peripheral blood monocytes activate IGF1R and directly support survival of primary patient T-ALL cells in vitro. Furthermore, enriched macrophage gene signatures in published clinical samples correlate with inferior outcomes for pediatric T-ALL patients. Collectively, these data reveal that tumor-associated myeloid cells provide signals critical for T-ALL growth in multiple organs in vivo and implicate tumor-associated myeloid cells and associated signals as potential therapeutic targets.
Introduction
T-cell acute lymphoblastic leukemia (T-ALL) is a hematologic malignancy that arises from T-cell precursors in the thymus.1,2 Current treatments have improved survival rates for pediatric patients to ∼90%, whereas survival rates for adults remain at ∼50%. However, these intensified multiagent chemotherapy regimens are associated with significant long-term morbidity, including metabolic disorders, neurotoxicity, cognitive impairment, secondary cancers, and cardiopathies.3,4 Furthermore, patients refractory to frontline therapy or who relapse have poor outcomes and few alternative therapeutic options.5,6 Newer agents, such as nelarabine, improve survival for relapsed T-ALL7 but often result in neurotoxicity.8 Thus, development of less toxic effective therapies will be required to improve patient outcomes. Recent efforts to discover new therapeutic strategies for T-ALL have focused on tumor-intrinsic genomic alterations important for T-ALL progression, such as activating mutations in NOTCH1.9 Although clinical trials are ongoing, such strategies have yet to result in approved therapies that are effective and safe,2,5,6 underscoring the need for identification of new therapeutic targets and approaches.
Tumors often modulate cells in their local environments that, in turn, promote cancer survival and progression.10 Notably, neither murine nor human primary T-ALL cells survive when cultured in the absence of cytokines or cellular support,11-13 suggesting that the tumor microenvironment (TME) provides signals necessary for T-ALL progression.14 Indeed, interleukin-7 (IL-7) and NOTCH1 ligands, which are expressed by cortical thymic epithelial cells (TECs), have been implicated in promoting T-ALL survival.12-16 However, we and other investigators find that TECs are often ablated during T-ALL progression in mice and humans,11,17 suggesting a role for other factors in the thymic TME. Also, T-ALL results in systemic disease, with leukemic infiltration in the bone marrow (BM), spleen, liver, and other organs.2 The absence of TECs outside of the thymus indicates that other cell types support T-ALL at these secondary leukemia sites. In fact, BM-derived stromal cell lines can support T-ALL,18,19 possibly through expression of CXCL12 and IL-18.20-22 It remains to be determined whether common cell types can support T-ALL in the diverse organs infiltrated with leukemia.
Myeloid cells consist of heterogeneous cells that are often modulated within the TME to support progression, metastasis, and drug resistance of multiple cancer types.10,23-28 We reported that myeloid cells, particularly dendritic cells (DCs), become more numerous during T-ALL progression in the thymus of mice and patients. We also found that tumor-associated myeloid cells in the thymic TME are necessary and sufficient to support survival of T-ALL cells in vitro. Interestingly, myeloid cells from the thymus of healthy mice were incapable of supporting T-ALL, indicating that the myeloid compartment becomes altered during leukemia progression.11 These findings are consistent with studies showing that myeloid cells become altered in other organs in a NOTCH1-induced model of T-ALL.29,30 Our previous findings also suggest that myeloid cells directly support T-ALL growth,11 rather than relying on indirect mechanisms, such as immunosuppression, modulation of extracellular matrix deposition, or angiogenesis.10 Although myeloid cells have been shown to support T-ALL in vitro, their role in vivo has yet to be established.
Here, we sought to determine whether myeloid cells are necessary for T-ALL growth in vivo and, if so, to identify relevant myeloid subsets and signals. We find that myeloid cells from multiple leukemic sites have the capacity to support survival of T-ALL cells in vitro. Although our previous data demonstrated an important role for DCs in supporting T-ALL in the thymus,11 DC deficiency does not delay disease progression. However, tumor-associated myeloid cells from DC-deficient mice support T-ALL survival in vitro, suggesting a role for other myeloid subsets. Consistent with this, we show that multiple myeloid cell types can support survival of T-ALL in vitro. Notably, acute depletion of myeloid cells in mice through pharmacologic or genetic manipulation diminishes T-ALL burden in multiple organs and confers a significant survival advantage. Transcriptional profiling and functional assays show the relevance of IGF1R signaling for myeloid-mediated support of T-ALL in vivo. We also find that myeloid cells activate IGF1R and promote survival of human T-ALL cells, and an elevated macrophage gene signature is associated with inferior patient prognosis. Collectively, these studies demonstrate that myeloid cells directly support T-ALL progression in mouse models and in humans.
Methods
Mice
LN331,32 (from T. Serwold, Joslin Diabetes Center, Boston, MA), CD2-Lmo2 transgenic33 (LMO2; from U. Davé, Indiana University, Indianapolis, IN), C57BL/6J, B6.SJL-Ptprca Pepcb/BoyJ (CD45.1), Flt3l−/−34 (from K. Medina, Mayo Clinic, Rochester, MN), B6.FVB-Tg(ITGAM-DTR/EGFP)34Lan/J (CD11b-DTR),35 and B6(Cg)-Rag2tm1.1Cgn/J (Rag2−/−)36 mouse strains were bred in-house. Mice were sourced from The Jackson Laboratory, unless otherwise noted. Mice were housed in specific-pathogen–free conditions. All experimental procedures were approved by the Institutional Animal Care and Use Committee at the University of Texas at Austin.
T-ALL transplant model
A total of 5 × 10⁶ T-ALL cells were isolated from leukemic LN3 or LMO2 mice, resuspended in sterile phosphate-buffered saline, and injected intraperitoneally into nonirradiated sex-matched CD45.1+, Flt3l−/−, CD45.1+CD45.2+ CD11b-DTR+, or Rag2−/− mice, as indicated. Splenic T-ALL engraftment (CD45.2+CD5+) was evaluated by flow cytometry.
In vivo depletion of myeloid cells by clodronate liposomes
Mice with established T-ALL (>1% splenic engraftment) were treated with clodronate (dichloromethylene diphosphonate) encapsulated in liposomes (clodlip) from ClodronateLiposomes.org (Amsterdam, The Netherlands; 5 mg/mL) or FormuMax Scientific Inc. (Sunnyvale, CA; neutral, 7 mg/mL). Mice were injected intraperitoneally with 100 or 200 μL of clodlip solution every third day, for a total of 4 injections; T-ALL burden was assessed by flow cytometry 48 hours after the final injection. To identify cell types that phagocytose liposomes, control liposomes (devoid of clodronate) that were fluorescently labeled with Dil were injected intraperitoneally, and splenocytes were evaluated by flow cytometry after 24 or 48 hours.
PBMC-derived myeloid cell generation and coculture with patient samples
Deidentified primary pediatric T-ALL patient samples were obtained at Texas Children’s Hospital (Houston, TX). Sample procurement and analysis were approved by the institutional review board committees at The University of Texas at Austin and Texas Children’s Hospital/Baylor College of Medicine. T-ALL cells were isolated via Ficoll density gradient separation, washed, and frozen in RPMI 1640 containing 40% fetal bovine serum and 10% dimethyl sulfoxide (DMSO; volume-to-volume ratio) on the day of collection. For preparation of myeloid cells, peripheral blood mononuclear cells (PBMCs) were purified from leukoreduction system chambers from anonymous healthy donors (We Are Blood, Austin, TX) using Histopaque (1.077 g/mL; Sigma-Aldrich) density gradient centrifugation.37 10 × 106 to 15 × 106 PBMCs was seeded into T75 flasks (Corning) in 20 mL of complete RPMI medium and cultured at 37°C, 5% CO2 for 2 hours to allow monocyte adhesion. Adherent monocytes were washed twice with complete RPMI medium. Monocytes were differentiated for 7 to 9 days in the presence of granulocyte-macrophage colony-stimulating factor (GM-CSF; 50 ng/mL), macrophage colony-stimulating factor (M-CSF; 50 ng/mL), or GM-CSF (100 ng/mL) and IL-4 (50 ng/mL).37-40 For cocultures, 1.25 × 10⁵ patient T-ALL cells were plated alone or with monocyte-derived myeloid cells at a 1:1 ratio in 200 μL of complete RPMI in flat-bottom 96-well plates for 6 days prior to assessing the viability of T-ALL cells by flow cytometry. If the viability of primary patient T-ALL cells after thawing was <60%, live cells were enriched on a cushion of Histopaque prior to coculture.
Statistical analysis
Statistical analyses were performed with Prism (v8.4.2; GraphPad Software) and R (3.5.1; The R Foundation for Statistical Computing). Normality was determined using the D'Agostino & Pearson or Shapiro-Wilk test, as appropriate for sample size. Statistical significance was determined using an unpaired Student t test for normally distributed data; the nonparametric Mann-Whitney test, paired Student t test, or repeated measures 1-way analysis of variance (ANOVA) with the Bonferroni correction for normally distributed data; or the nonparametric Friedman test, repeated measures 2-way ANOVA with the Bonferroni correction, or log-rank test, as indicated in the figure legends. See supplemental Methods for additional experimental details (available on the Blood Web site).
Results
T-ALL infiltrates multiple organs following engraftment in secondary hosts and remains dependent on myeloid cells for in vitro survival
The LN3 mouse strain was cloned from a lymph node (LN) T cell, resulting in endogenously prerearranged TCRα and TCRβ genes in all cells and premature T-cell receptor expression during thymocyte development.31 LN3 mice spontaneously develop T-ALL, associated with frequent Notch1 mutations,11 with ∼50% penetrance at >6 months of age.32 Our previous studies demonstrated that leukemia-associated myeloid cells support survival and proliferation of primary LN3 T-ALL cells in vitro.11 To extend these findings in vivo, we transplanted primary T-ALL cells from leukemic LN3 mice into unconditioned immunocompetent CD45.1+ congenic mice. Disease penetrance is 100% following transplantation, and mice within a cohort harboring the same primary leukemia have similar disease kinetics (Figure 1A). Transplanted T-ALL cells infiltrate multiple organs, resembling human disease (Figure 1B; supplemental Figure 1). Importantly, T-ALL cells from multiple clinically relevant sites in transplanted mice remain dependent on the presence of myeloid cells from their TMEs to survive in vitro (Figure 1C-D; supplemental Figure 2). Multiple myeloid cell types, including macrophages, conventional DCs (cDC1 and cDC2), monocytes, and granulocytes, become more numerous in leukemic spleens, with an increased frequency of macrophages and Gr1lo monocytes within the myeloid compartment (Figure 1E-F; supplemental Figure 3A). Importantly, this expansion is myeloid specific, as host T-cell (TCRβ+) and B-cell (B220+) counts remain constant, despite increased organ cellularity. Moreover, myeloid cells are intermingled with T-ALL cells in the TME of multiple organs, highlighting their potential to provide growth signals (Figure 1G). Collectively, these results demonstrate that, following transplantation into secondary hosts, T-ALL cells modulate the myeloid composition in the TME, and myeloid cells from multiple leukemic organs can support survival of T-ALL cells in vitro.
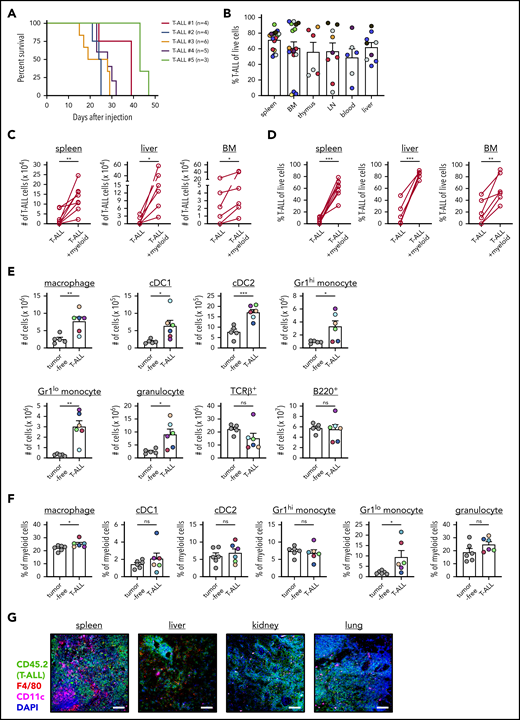
Transplanted T-ALL infiltrates multiple organs, remodels the myeloid compartment, and remains dependent on myeloid support for survival in vitro. (A) Survival of nonirradiated CD45.1+ mice transplanted with primary LN3 (CD45.2+) T-ALL cells was followed. Each line represents results from a cohort of mice transplanted with a distinct primary T-ALL sample. (B) Quantification of the frequencies of T-ALL cells (CD45.2+) within the indicated organs of leukemic transplant mice. Graph depicts cumulative data from 3 to 8 experiments, each with a distinct color-coded primary T-ALL. Bars represent means + standard error of the mean (SEM); circles represent individual mice. Graphs depict the number (C) and frequency (D) of viable T-ALL cells 6 or 7 days after culture in the presence or absence of enriched myeloid cells from the TME. T-ALL cells and myeloid cells were isolated from the indicated organs of leukemic mice that had been transplanted with primary LN3 T-ALL cells. Graphs depict cumulative data from 6 to 8 experiments, each with a distinct transplanted T-ALL sample; circles represent the average of 2 or 3 technical replicate wells per experiment. Graphs depict the number of cells of the indicated subsets (E) and frequencies of myeloid subsets (F) within the myeloid compartment (CD11b+ and/or CD11c+ cells) of spleens from tumor-free and LN3 T-ALL–transplanted mice. Graphs depict cumulative data from 5 or 6 independent experiments, each with a distinct color-coded primary T-ALL. Bars represent means + SEM; circles represent individual mice. (G) Representative immunofluorescent images of transplanted LN3 T-ALL cells and myeloid cells in the indicated organs. Immunostaining for T-ALL cells (CD45.2; green), F4/80 (red), CD11c (magenta), and DAPI (blue) is shown. Scale bars, 100 μm. *P < .05, **P < .01, ***P < .001, paired (C-D) and unpaired (E-F) Student t tests. ns, not significant.
Transplanted T-ALL infiltrates multiple organs, remodels the myeloid compartment, and remains dependent on myeloid support for survival in vitro. (A) Survival of nonirradiated CD45.1+ mice transplanted with primary LN3 (CD45.2+) T-ALL cells was followed. Each line represents results from a cohort of mice transplanted with a distinct primary T-ALL sample. (B) Quantification of the frequencies of T-ALL cells (CD45.2+) within the indicated organs of leukemic transplant mice. Graph depicts cumulative data from 3 to 8 experiments, each with a distinct color-coded primary T-ALL. Bars represent means + standard error of the mean (SEM); circles represent individual mice. Graphs depict the number (C) and frequency (D) of viable T-ALL cells 6 or 7 days after culture in the presence or absence of enriched myeloid cells from the TME. T-ALL cells and myeloid cells were isolated from the indicated organs of leukemic mice that had been transplanted with primary LN3 T-ALL cells. Graphs depict cumulative data from 6 to 8 experiments, each with a distinct transplanted T-ALL sample; circles represent the average of 2 or 3 technical replicate wells per experiment. Graphs depict the number of cells of the indicated subsets (E) and frequencies of myeloid subsets (F) within the myeloid compartment (CD11b+ and/or CD11c+ cells) of spleens from tumor-free and LN3 T-ALL–transplanted mice. Graphs depict cumulative data from 5 or 6 independent experiments, each with a distinct color-coded primary T-ALL. Bars represent means + SEM; circles represent individual mice. (G) Representative immunofluorescent images of transplanted LN3 T-ALL cells and myeloid cells in the indicated organs. Immunostaining for T-ALL cells (CD45.2; green), F4/80 (red), CD11c (magenta), and DAPI (blue) is shown. Scale bars, 100 μm. *P < .05, **P < .01, ***P < .001, paired (C-D) and unpaired (E-F) Student t tests. ns, not significant.
Other myeloid cells support T-ALL in the absence of DCs
Based on our previous finding that DCs from leukemic thymuses are capable of supporting T-ALL growth in vitro,11 we hypothesized that DCs would contribute to T-ALL progression in vivo. To test this hypothesis, we assessed LN3 T-ALL progression following transplantation into Flt3l−/− mice, in which DC differentiation is impaired.34 Flow cytometric evaluation confirmed a selective decrease in cDC1 and cDC2 cellularity in Flt3l−/− spleens (Figure 2A). Despite this reduction in DCs, Flt3l−/− mice succumbed significantly faster to T-ALL than did wild-type (WT) recipients (Figure 2B). We next tested whether propagation of T-ALL in DC-attenuated hosts reflected a selective pressure on the leukemia cells to become independent of myeloid support. This was not the case, because T-ALL cells continued to rely on myeloid cells from the TME of Flt3l−/− mice for survival in vitro (Figure 2C-D). We next confirmed that DCs remained depleted in the spleens of leukemic Flt3l−/− mice (Figure 2E). To identify myeloid cells likely to support T-ALL, we evaluated the composition of enriched myeloid cells used in coculture assays and found that macrophages were the most abundant cell type in WT and Flt3l−/− spleens (supplemental Figure 4). These results demonstrate that DCs are not necessary for T-ALL progression in vivo and suggest that other tumor-associated myeloid cell types, such as macrophages, likely contribute to T-ALL growth.
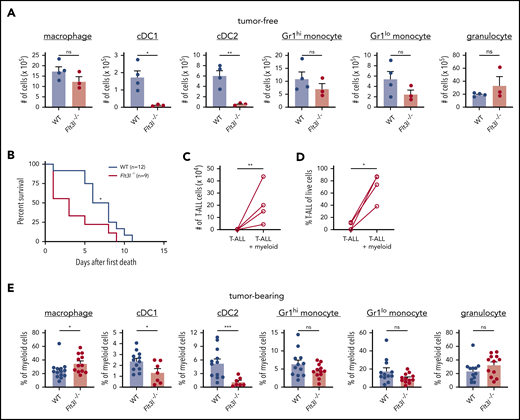
T-ALL growth is independent of DCs in vivo and can be supported by other myeloid subsets. (A) Quantification of the indicated myeloid cell subsets in spleens of tumor-free WT and Flt3l−/− mice. Bars represent means + standard error of the mean (SEM) of 3 independent experiments; circles represent individual mice. (B) Survival of WT and Flt3l−/− recipient mice after transplantation with primary LN3 T-ALL cells. Graph displays cumulative survival of WT and Flt3l−/− mice from 3 independent experiments, each using distinct primary T-ALL samples. The Kaplan-Meier survival curves were normalized to the first day of death in each experiment. The number (C) and frequency (D) of viable T-ALL cells from the spleens of Flt3l−/− mice transplanted with primary LN3 T-ALL were assessed by flow cytometry 6 or 7 days after culture in the presence or absence of tumor-associated myeloid cells. Graphs display cumulative results from 4 independent experiments with distinct primary tumors. Circles represent the mean of 2 or 3 technical replicate wells per experiment. (E) Quantification of the frequencies of the indicated myeloid subsets within the splenic myeloid compartment of primary LN3 T-ALL-bearing WT and Flt3l−/− mice. Bars represent means + SEM of cumulative data from 7 to 13 independent primary tumors; circles represent individual mice. *P < .05, **P < .01, ***P < .001, unpaired Student t test (A,E), log-rank test (B), and paired Student t test (C-D). ns, not significant.
T-ALL growth is independent of DCs in vivo and can be supported by other myeloid subsets. (A) Quantification of the indicated myeloid cell subsets in spleens of tumor-free WT and Flt3l−/− mice. Bars represent means + standard error of the mean (SEM) of 3 independent experiments; circles represent individual mice. (B) Survival of WT and Flt3l−/− recipient mice after transplantation with primary LN3 T-ALL cells. Graph displays cumulative survival of WT and Flt3l−/− mice from 3 independent experiments, each using distinct primary T-ALL samples. The Kaplan-Meier survival curves were normalized to the first day of death in each experiment. The number (C) and frequency (D) of viable T-ALL cells from the spleens of Flt3l−/− mice transplanted with primary LN3 T-ALL were assessed by flow cytometry 6 or 7 days after culture in the presence or absence of tumor-associated myeloid cells. Graphs display cumulative results from 4 independent experiments with distinct primary tumors. Circles represent the mean of 2 or 3 technical replicate wells per experiment. (E) Quantification of the frequencies of the indicated myeloid subsets within the splenic myeloid compartment of primary LN3 T-ALL-bearing WT and Flt3l−/− mice. Bars represent means + SEM of cumulative data from 7 to 13 independent primary tumors; circles represent individual mice. *P < .05, **P < .01, ***P < .001, unpaired Student t test (A,E), log-rank test (B), and paired Student t test (C-D). ns, not significant.
Myeloid cells support T-ALL initiation and progression
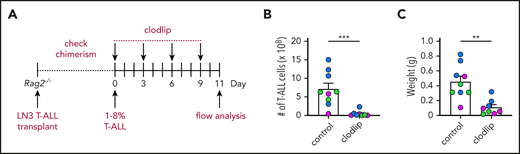
To test whether myeloid cells promote T-ALL progression in vivo, we used clodlip to deplete phagocytic cells, including macrophages, DCs, and monocytes.41-43 We first confirmed that clodlip was internalized by myeloid cells, but not by T-ALL or lymphocytes (TCRβ+ or B220+) (supplemental Figure 5A-C). We also confirmed that clodlip treatment does not impact lymphocyte cellularity in healthy mice, indicating that it is not broadly toxic (supplemental Figure 5D). Next, LN3 T-ALL cells were transferred into congenic recipients; once splenic T-ALL burden reached 1% to 8%, clodlip was administered to half of the cohort over 9 days prior to assessing T-ALL burden (Figure 3A). Strikingly, myeloid depletion resulted in fewer circulating T-ALL blasts and diminished T-ALL burden in the spleen, liver, kidney, lung, BM, thymus, and inguinal LNs (Figure 3B-D). Furthermore, depleting myeloid cells from mice with established T-ALL conferred a significant survival benefit (Figure 3E). These results demonstrate that leukemia-associated myeloid cells support established T-ALL progression in vivo.
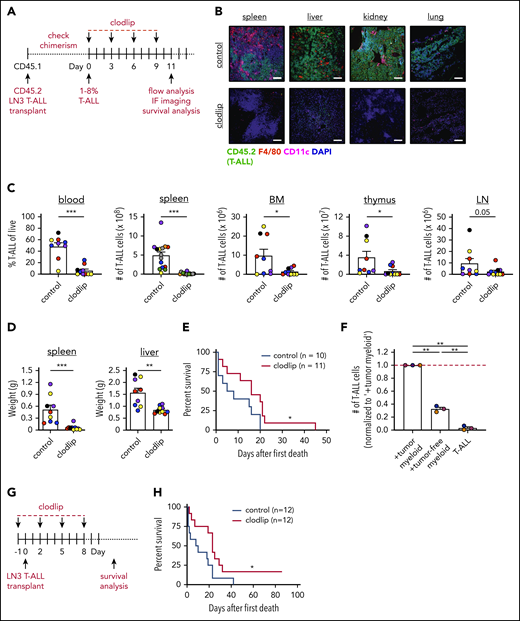
Depletion of phagocytic myeloid subsets results in decreased tumor burden in vivo and prolongs survival. (A) Schematic diagram depicting the dosing schedule for clodlip treatment to deplete myeloid cells in mice with established transplanted LN3 T-ALL. (B) Representative images from the indicated organs of control or clodlip-treated mice after establishment of T-ALL burden. Immunostaining for T-ALL cells (CD45.2; green), F4/80 (red), CD11c (magenta), and DAPI (blue) is shown. Scale bars, 100 μm. (C) Quantification of the frequency of T-ALL cells in the blood and numbers of T-ALL cells in the spleen, BM, thymus, and inguinal LNs in control and clodlip-treated mice. Bars depict means + standard error of the mean (SEM) of cumulative data from 5 to 8 experiments, each with a distinct color-coded primary T-ALL; circles represent individual mice. (D) Quantification of the weights of spleens and livers from control and clodlip-treated mice from the same experiments as in (C). Bars show means + SEM from 5 independent experiments, each with a distinct color-coded primary T-ALL; circles represent individual mice. (E) Graph displays cumulative survival of control and clodlip-treated mice from 2 independent experiments, each with a different primary LN3 T-ALL, using the treatment regimen in (A). The Kaplan-Meier survival curves were normalized to the first day of death in each experiment. (F) Quantification of viable T-ALL cells, isolated from the spleens of LN3 T-ALL–transplanted mice 6 or 7 days after culture in the presence or absence of enriched myeloid cells from the spleens of tumor-bearing or tumor-free mice. Results were normalized to the viability of T-ALL cells cocultured with tumor-associated myeloid cells within each experiment (red line). Bars depict means + SEM of cumulative data from 3 experiments, each with a distinct color-coded primary T-ALL; circles represent the mean of 2 or 3 replicate wells per experiment. (G) Schematic diagram depicting the dosing schedule to deplete myeloid cells prior to T-ALL engraftment in congenic recipients. (H) Graph displays cumulative survival of control and clodlip-treated mice from 3 independent experiments, each with a different primary LN3 T-ALL. The Kaplan-Meier survival curves were normalized to the first day of death in each experiment. *P < .05, **P < .01, ***P < .001, unpaired Student t test (C-D), log-rank test (E,H), repeated measures one-way ANOVA with the Bonferroni correction (F).
Depletion of phagocytic myeloid subsets results in decreased tumor burden in vivo and prolongs survival. (A) Schematic diagram depicting the dosing schedule for clodlip treatment to deplete myeloid cells in mice with established transplanted LN3 T-ALL. (B) Representative images from the indicated organs of control or clodlip-treated mice after establishment of T-ALL burden. Immunostaining for T-ALL cells (CD45.2; green), F4/80 (red), CD11c (magenta), and DAPI (blue) is shown. Scale bars, 100 μm. (C) Quantification of the frequency of T-ALL cells in the blood and numbers of T-ALL cells in the spleen, BM, thymus, and inguinal LNs in control and clodlip-treated mice. Bars depict means + standard error of the mean (SEM) of cumulative data from 5 to 8 experiments, each with a distinct color-coded primary T-ALL; circles represent individual mice. (D) Quantification of the weights of spleens and livers from control and clodlip-treated mice from the same experiments as in (C). Bars show means + SEM from 5 independent experiments, each with a distinct color-coded primary T-ALL; circles represent individual mice. (E) Graph displays cumulative survival of control and clodlip-treated mice from 2 independent experiments, each with a different primary LN3 T-ALL, using the treatment regimen in (A). The Kaplan-Meier survival curves were normalized to the first day of death in each experiment. (F) Quantification of viable T-ALL cells, isolated from the spleens of LN3 T-ALL–transplanted mice 6 or 7 days after culture in the presence or absence of enriched myeloid cells from the spleens of tumor-bearing or tumor-free mice. Results were normalized to the viability of T-ALL cells cocultured with tumor-associated myeloid cells within each experiment (red line). Bars depict means + SEM of cumulative data from 3 experiments, each with a distinct color-coded primary T-ALL; circles represent the mean of 2 or 3 replicate wells per experiment. (G) Schematic diagram depicting the dosing schedule to deplete myeloid cells prior to T-ALL engraftment in congenic recipients. (H) Graph displays cumulative survival of control and clodlip-treated mice from 3 independent experiments, each with a different primary LN3 T-ALL. The Kaplan-Meier survival curves were normalized to the first day of death in each experiment. *P < .05, **P < .01, ***P < .001, unpaired Student t test (C-D), log-rank test (E,H), repeated measures one-way ANOVA with the Bonferroni correction (F).
After developing in the thymus, T-ALL cells seed other organs, where local microenvironments must be permissive for successful engraftment. Thus, we tested whether myeloid cells from secondary sites could support T-ALL. Myeloid cells from tumor-free spleens supported T-ALL in vitro, although significantly less efficiently compared with leukemia-associated splenic myeloid cells (Figure 3F). Furthermore, myeloid depletion prior to T-ALL transplantation resulted in reduced disease penetrance and a significant survival benefit (Figure 3G-H). These results demonstrate that myeloid cells in nonleukemic tissues support T-ALL upon engraftment at secondary sites in vivo.
To validate the impact of myeloid support on T-ALL burden, we used CD11b-DTR transgenic mice, in which the diphtheria toxin receptor (DTR) is expressed under the control of the CD11b promoter,35 as an alternate means of depleting myeloid cells. T-ALL cells were transplanted into CD11b-DTR+ mice and transgene-negative littermate controls; once splenic T-ALL burden reached 1% to 8%, diphtheria toxin (DT) was administered to deplete CD11b+ myeloid cells (supplemental Figure 6A).44-46 Consistent with clodlip results, myeloid depletion significantly diminished T-ALL burden in several organs, including the spleen and LN, with spleen and liver weights declining to those of tumor-free littermate controls (supplemental Figure 6B-D).
We also determined whether myeloid cells supported T-ALL in an independent transgenic mouse model in which LIM domain only 2 (Lmo2) expression is driven by the human CD2-promoter.33 Similar to the LN3 model, LMO2 T-ALL cells remained dependent on leukemia-associated myeloid cells for survival in vitro following transplantation into unconditioned recipients (supplemental Figure 6E-F). Furthermore, myeloid depletion resulted in a significant reduction in T-ALL burden (supplemental Figure 6G-I). Taken together, these concordant findings using multiple T-ALL models and myeloid-depletion methods demonstrate that myeloid cells provide critical support for T-ALL engraftment and progression in vivo.
Multiple myeloid subsets can directly support T-ALL survival
We reasoned that determining which myeloid subsets were depleted by clodlip or DT would identify candidate cell types that contribute to T-ALL growth. Clodlip treatment resulted in an almost complete depletion of splenic macrophages, as well as a significant reduction in cDC1, cDC2, and monocytes (Figure 4A). Although macrophages were also depleted in the BM, we did not detect a significant reduction in myeloid subsets in the thymus or LN (supplemental Figure 7A).47-49 In the CD11b-DTR model, administration of DT resulted in a significant decrease in splenic macrophages, cDC1 and cDC2, Gr1hi and Gr1lo monocytes, and granulocytes, whereas only DCs were depleted in the LN (supplemental Figure 7B). To evaluate the ability of the implicated myeloid subsets to support T-ALL survival, we used fluorescence-activated cell sorting (FACS) to sort myeloid cells from the spleens and livers of tumor-bearing mice (supplemental Figure 8A) and verified their cellular identities morphologically (Figure 4B) before coculturing with T-ALL cells. Macrophages from the spleen and liver robustly supported survival of T-ALL cells in vitro, and monocytes and cDC2 were also supportive, albeit to a lesser extent (Figure 4C; supplemental Figure 8B). Thus, multiple myeloid subsets from the TMEs of hematopoietic and nonhematopoietic organs can directly promote T-ALL survival.
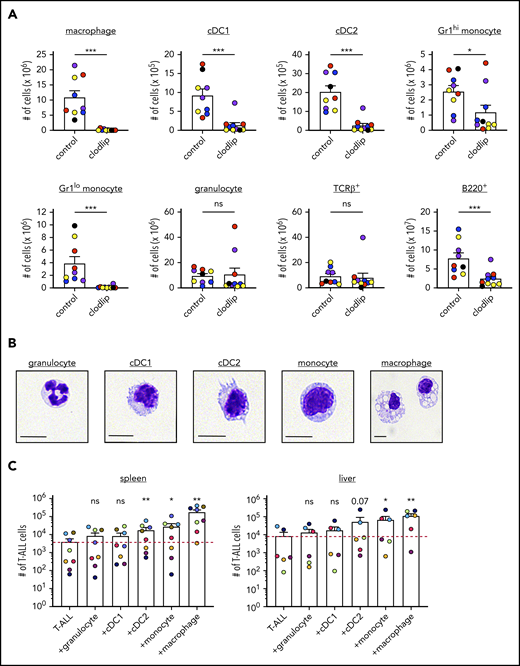
Clodlip treatment depletes multiple myeloid subsets that support T-ALL growth at hematopoietic and nonhematopoietic sites. (A) Quantification of the number of myeloid cells of the indicated subsets in the spleens of control and clodlip-treated leukemic mice transplanted with primary LN3 T-ALL. Bars show means + standard error of the mean (SEM) from 5 independent experiments (the same as those analyzed in Figure 3C), each with a distinct color-coded primary T-ALL; circles represent independent mice. (B) Representative histologic images of FACS-sorted splenic myeloid subsets from primary LN3 T-ALL–transplanted mice, stained with the May-Grünwald Giemsa reagent. Scale bars, 10 μm. (C) Quantification of viable T-ALL cells 6 or 7 days after culture in the presence or absence of the indicated FACS-sorted myeloid subsets from the spleen or liver of transplanted LN3 T-ALL–bearing mice. Bars show means + SEM of cumulative results from 6 to 8 independent experiments, each with a color-coded distinct primary T-ALL; circles represent the average of technical replicate wells per experiment. The red line indicates the mean number of viable T-ALL cells cultured alone. *P < .05, **P < .01, ***P < .001, unpaired Student t test (A), repeated measures 1-way ANOVA with the Bonferroni correction (C). ns, not significant.
Clodlip treatment depletes multiple myeloid subsets that support T-ALL growth at hematopoietic and nonhematopoietic sites. (A) Quantification of the number of myeloid cells of the indicated subsets in the spleens of control and clodlip-treated leukemic mice transplanted with primary LN3 T-ALL. Bars show means + standard error of the mean (SEM) from 5 independent experiments (the same as those analyzed in Figure 3C), each with a distinct color-coded primary T-ALL; circles represent independent mice. (B) Representative histologic images of FACS-sorted splenic myeloid subsets from primary LN3 T-ALL–transplanted mice, stained with the May-Grünwald Giemsa reagent. Scale bars, 10 μm. (C) Quantification of viable T-ALL cells 6 or 7 days after culture in the presence or absence of the indicated FACS-sorted myeloid subsets from the spleen or liver of transplanted LN3 T-ALL–bearing mice. Bars show means + SEM of cumulative results from 6 to 8 independent experiments, each with a color-coded distinct primary T-ALL; circles represent the average of technical replicate wells per experiment. The red line indicates the mean number of viable T-ALL cells cultured alone. *P < .05, **P < .01, ***P < .001, unpaired Student t test (A), repeated measures 1-way ANOVA with the Bonferroni correction (C). ns, not significant.
Adaptive immunity is not required to reduce T-ALL burden after myeloid depletion
We previously found that thymic tumor–associated myeloid cells express genes associated with an immunosuppressive signature, such as Arg1, Ym1, Mmp2, and Fizz1.11,50 Thus, the reduced T-ALL burden following depletion of tumor-associated myeloid cells could result from relieving suppression of antileukemic T-cell responses.51 To test this possibility, T-ALL was transplanted into lymphodeficient Rag2−/− mice36 ; once T-ALL was established, half of the cohort was treated with clodlip (Figure 5A). Flow cytometric analysis revealed that myeloid depletion significantly diminished T-ALL burden, even in the absence of an adaptive immune response (Figure 5B-C). Taken together with the finding that myeloid cells support T-ALL survival in vitro, these studies indicate that myeloid cells directly support T-ALL in vivo.
Adaptive immune responses are not required for the decrease in leukemia burden following myeloid depletion. (A) Schematic diagram depicting the dosing schedule for clodlip treatment to deplete myeloid cells in Rag2−/− mice transplanted with primary LN3 T-ALL. Quantification of the number of splenic T-ALL cells (B) and weight of spleens (C) from T-ALL–bearing Rag2−/− mice in the indicated treatment groups. Bars represent means + standard error of the mean of data compiled from 3 independent experiments, each with a distinct color-coded primary T-ALL; circles represent individual mice. **P < .01, ***P < .001, unpaired Student t test.
Adaptive immune responses are not required for the decrease in leukemia burden following myeloid depletion. (A) Schematic diagram depicting the dosing schedule for clodlip treatment to deplete myeloid cells in Rag2−/− mice transplanted with primary LN3 T-ALL. Quantification of the number of splenic T-ALL cells (B) and weight of spleens (C) from T-ALL–bearing Rag2−/− mice in the indicated treatment groups. Bars represent means + standard error of the mean of data compiled from 3 independent experiments, each with a distinct color-coded primary T-ALL; circles represent individual mice. **P < .01, ***P < .001, unpaired Student t test.
Myeloid cells activate IGF1R signaling to promote T-ALL survival in vivo
To identify mechanisms by which myeloid cells promote T-ALL survival, we carried out transcriptional profiling of T-ALL cells vs healthy T-lineage cells. T cells were chosen as controls because tumor-associated myeloid cells significantly supported the survival of T-ALL but not T cells (Figure 6A). Therefore, we reasoned that T-ALL cells in the leukemic microenvironment would exhibit gene signatures induced by supportive myeloid cells that would not be found in tumor-free T cells. Thus, the transcriptional profiles of primary thymic and splenic T-ALL cells were compared with thymocytes and splenic CD8+ T cells from tumor-free mice by RNA sequencing. Principal component analysis showed that leukemia status was the major driver of transcriptional differences between samples (PC1), followed by tissue-specific signatures (PC2; Figure 6B). Pathway analysis showed that “IGF1R” was among the top pathways activated preferentially in T-ALL cells, in the spleen and in the thymus (Figure 6C; supplemental Figure 9A-B). Consistent with this, Igf1r transcripts were elevated in T-ALL cells (Figure 6D), and IGF1R was activated in T-ALL cells, but not in T cells from the same leukemic spleens (Figure 6E).
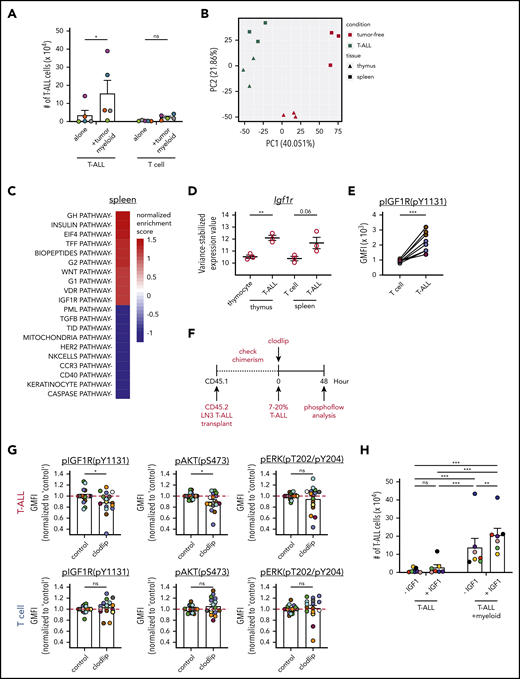
Activation of IGF1R signaling is associated with myeloid-mediated T-ALL survival. (A) Quantification of viable T-ALL cells and CD8+ T cells, isolated from the spleens of leukemic LN3 mice or tumor-free mice, respectively, 6 or 7 days after culture in the presence or absence of enriched splenic leukemia-associated myeloid cells. Bars represent means + standard error of the mean (SEM) of data compiled from 5 independent experiments with a distinct color-coded primary T-ALL; circles represent the average of 2 or 3 technical replicate wells per experiment. (B) Principal component analysis (PCA) of gene-expression profiles of T-ALL cells from the thymus or spleen of LN3 mice, as well as thymocytes or splenic CD8+ T cells from tumor-free mice. Symbols represent individual biologic replicates. (C) The top 10 pathways that were significantly enriched or depleted in splenic T-ALL cells relative to healthy CD8+ T cells were identified by gene set enrichment analysis, using BioCarta gene sets. (D) Variance-stabilized expression values of Igf1r from control T-lineage vs T-ALL cells from the thymus and spleen. Bars represent means + SEM; circles represent individual biologic replicates. (E) pIGF1R levels in LN3-transplanted T-ALL cells (CD45.2+CD5+) relative to host T cells (CD45.1+CD5+) from the same spleens were quantified by flow cytometry and are displayed as geometric mean fluorescence intensities (GMFI). Data are compiled from 3 independent experiments, each with a distinct color-coded primary T-ALL. Circles represent individual mice. (F) Schematic diagram for acute myeloid depletion in mice with established LN3 T-ALL to assess changes in activation of IGF1R and downstream signals. (G) Levels of pIGF1R and the downstream signaling molecules phosphorylated (p)AKT and pERK were quantified in T-ALL cells (upper panels) and host T cells (lower panels) following acute myeloid depletions, as in (F). GMFIs from clodlip-treated mice were normalized to the mean of control mice in each experiment. Bars represent means + SEM from 9 independent experiments, each with a distinct color-coded primary T-ALL. Circles represent individual mice. The red line indicates the mean of relative GMFIs in control mice. (H) Quantification of viable splenic T-ALL cells, isolated from the spleens of primary LN3 T-ALL–transplanted mice, 6 or 7 days after culture in the presence or absence of leukemia-associated splenic myeloid cells and in the presence or absence of exogenous IGF1 (100 ng/mL). Bars represent means + SEM of data compiled from 7 independent experiments with a distinct color-coded primary T-ALL; circles represent the average of 2 or 3 technical replicate wells per experiment. *P < .05, **P < .01, ***P < .001, repeated measures 2-way ANOVA with the Bonferroni correction (A,H), unpaired Student t test (D,G), paired Student t test (E). ns, not significant.
Activation of IGF1R signaling is associated with myeloid-mediated T-ALL survival. (A) Quantification of viable T-ALL cells and CD8+ T cells, isolated from the spleens of leukemic LN3 mice or tumor-free mice, respectively, 6 or 7 days after culture in the presence or absence of enriched splenic leukemia-associated myeloid cells. Bars represent means + standard error of the mean (SEM) of data compiled from 5 independent experiments with a distinct color-coded primary T-ALL; circles represent the average of 2 or 3 technical replicate wells per experiment. (B) Principal component analysis (PCA) of gene-expression profiles of T-ALL cells from the thymus or spleen of LN3 mice, as well as thymocytes or splenic CD8+ T cells from tumor-free mice. Symbols represent individual biologic replicates. (C) The top 10 pathways that were significantly enriched or depleted in splenic T-ALL cells relative to healthy CD8+ T cells were identified by gene set enrichment analysis, using BioCarta gene sets. (D) Variance-stabilized expression values of Igf1r from control T-lineage vs T-ALL cells from the thymus and spleen. Bars represent means + SEM; circles represent individual biologic replicates. (E) pIGF1R levels in LN3-transplanted T-ALL cells (CD45.2+CD5+) relative to host T cells (CD45.1+CD5+) from the same spleens were quantified by flow cytometry and are displayed as geometric mean fluorescence intensities (GMFI). Data are compiled from 3 independent experiments, each with a distinct color-coded primary T-ALL. Circles represent individual mice. (F) Schematic diagram for acute myeloid depletion in mice with established LN3 T-ALL to assess changes in activation of IGF1R and downstream signals. (G) Levels of pIGF1R and the downstream signaling molecules phosphorylated (p)AKT and pERK were quantified in T-ALL cells (upper panels) and host T cells (lower panels) following acute myeloid depletions, as in (F). GMFIs from clodlip-treated mice were normalized to the mean of control mice in each experiment. Bars represent means + SEM from 9 independent experiments, each with a distinct color-coded primary T-ALL. Circles represent individual mice. The red line indicates the mean of relative GMFIs in control mice. (H) Quantification of viable splenic T-ALL cells, isolated from the spleens of primary LN3 T-ALL–transplanted mice, 6 or 7 days after culture in the presence or absence of leukemia-associated splenic myeloid cells and in the presence or absence of exogenous IGF1 (100 ng/mL). Bars represent means + SEM of data compiled from 7 independent experiments with a distinct color-coded primary T-ALL; circles represent the average of 2 or 3 technical replicate wells per experiment. *P < .05, **P < .01, ***P < .001, repeated measures 2-way ANOVA with the Bonferroni correction (A,H), unpaired Student t test (D,G), paired Student t test (E). ns, not significant.
Experiments were then performed to test whether IGF1R activation is involved in myeloid-mediated support of T-ALL. In vitro cocultures in the presence of IGF1R inhibitors showed that myeloid-mediated survival of LN3-transplanted T-ALL cells was dependent on IGF1R signaling (supplemental Figure 9C). Notably, acute myeloid depletion in leukemic mice (Figure 6F) resulted in reduced activation of IGF1R (phosphorylated IGF1R [pIGF1R]) and the downstream signaling molecule AKT, but not ERK, in T-ALL cells but not in normal T cells in the same spleens (Figure 6G; supplemental Figure 9D). These results suggest that therapeutic targeting of tumor-associated myeloid cells could specifically reduce survival signals in T-ALL cells, without impairing T cells. We next determined whether IGF1 was sufficient to support T-ALL survival. Although IGF1 was not sufficient to support T-ALL survival, exogenous IGF1 enhanced T-ALL survival in the presence of leukemia-associated myeloid cells, indicating that myeloid cells sensitize T-ALL to IGF1R signaling (Figure 6H). Collectively, these studies indicate that leukemia-associated myeloid cells support T-ALL, at least in part by activating the IGF1R pathway to promote survival.
Human myeloid cells support primary patient T-ALL cells in vitro and are associated with worse prognosis
To determine whether myeloid cells directly support survival of human T-ALL, primary patient T-ALL cells were cocultured with monocytes or monocyte-derived myeloid cells from the peripheral blood of healthy donors. Notably, monocytes, M-CSF–derived macrophages, and DCs all supported the survival of primary patient T-ALL cells in vitro (Figure 7A; supplemental Figure 10A). Furthermore, evaluation of published transcriptional datasets from pediatric patient samples52 revealed that an elevated macrophage gene signature correlated with reduced event-free survival rates, with a similar trend observed for elevated monocyte signatures (Figure 7B; supplemental Table 1). In contrast, gene signatures of nonmyeloid populations, such as B cells and natural killer cells, did not correlate with patient outcomes (supplemental Figure 10B). The association between macrophage signatures and patient outcomes is not confounded by genetic T-ALL subtypes (supplemental Figure 10C).
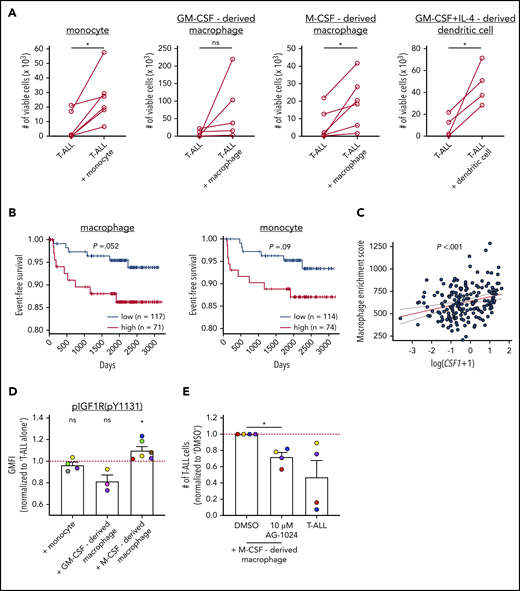
Human myeloid cells promote survival of patient T-ALL cells in vitro, and an elevated macrophage gene signature in patients is associated with worse prognosis. (A) Quantification of viable primary patient T-ALL cells cultured for 6 or 7 days in the presence or absence of monocytes from healthy donor PBMCs or the indicated monocyte-derived myeloid cells. T-ALL viability was assessed by flow cytometry. Data are compiled from 2 to 4 independent experiments using 4 to 6 distinct patient-derived leukemias. Each circle represents the average of 2 or 3 technical replicates. (B) Longitudinal event-free survival is plotted for pediatric T-ALL patients stratified into 2 groups based on their enrichment scores for macrophage or monocyte gene signatures, as indicated. Patient data were analyzed from published datasets from 264 T-ALL patients from the TARGET ALL Phase 2 trial.52 (C) Plot depicts the correlation between log-transformed Csf1 expression values and macrophage enrichment scores in patient samples. The red and dotted lines represent the best-fit line and 95% confidence bands, respectively. Circles represent each patient sample. (D) pIGF1R levels were quantified by flow cytometry in patient T-ALL cells cultured for 3 or 4 days in the presence or absence of PBMC-derived monocytes or the indicated monocyte-derived myeloid cells. Data are normalized to levels in T-ALL cells cultured alone (red line). Bars represent means + SEM from 3 to 5 independent experiments using 3 to 6 distinct color-coded patient-derived T-ALL samples. Circles represent the average of 2 technical replicate wells. (E) Quantification of viable patient T-ALL cells cultured alone or with M-CSF–derived macrophages in the presence of 10 µM AG-1024 (an IGF1R inhibitor) or DMSO. Results were normalized to DMSO-treated cultures in each experiment (red line). Bars represent means + SEM from 3 independent experiments using 4 of the distinct color-coded patient T-ALL samples used for cocultures with M-CSF–derived macrophages in (D). Circles represent the average of 2 technical replicate wells. *P < .05, paired Student t test (A), log-rank test (B), simple linear regression analyses (C), 1-sample Student t test (D), repeated measures 1-way ANOVA with the Bonferroni correction (E). ns, not significant.
Human myeloid cells promote survival of patient T-ALL cells in vitro, and an elevated macrophage gene signature in patients is associated with worse prognosis. (A) Quantification of viable primary patient T-ALL cells cultured for 6 or 7 days in the presence or absence of monocytes from healthy donor PBMCs or the indicated monocyte-derived myeloid cells. T-ALL viability was assessed by flow cytometry. Data are compiled from 2 to 4 independent experiments using 4 to 6 distinct patient-derived leukemias. Each circle represents the average of 2 or 3 technical replicates. (B) Longitudinal event-free survival is plotted for pediatric T-ALL patients stratified into 2 groups based on their enrichment scores for macrophage or monocyte gene signatures, as indicated. Patient data were analyzed from published datasets from 264 T-ALL patients from the TARGET ALL Phase 2 trial.52 (C) Plot depicts the correlation between log-transformed Csf1 expression values and macrophage enrichment scores in patient samples. The red and dotted lines represent the best-fit line and 95% confidence bands, respectively. Circles represent each patient sample. (D) pIGF1R levels were quantified by flow cytometry in patient T-ALL cells cultured for 3 or 4 days in the presence or absence of PBMC-derived monocytes or the indicated monocyte-derived myeloid cells. Data are normalized to levels in T-ALL cells cultured alone (red line). Bars represent means + SEM from 3 to 5 independent experiments using 3 to 6 distinct color-coded patient-derived T-ALL samples. Circles represent the average of 2 technical replicate wells. (E) Quantification of viable patient T-ALL cells cultured alone or with M-CSF–derived macrophages in the presence of 10 µM AG-1024 (an IGF1R inhibitor) or DMSO. Results were normalized to DMSO-treated cultures in each experiment (red line). Bars represent means + SEM from 3 independent experiments using 4 of the distinct color-coded patient T-ALL samples used for cocultures with M-CSF–derived macrophages in (D). Circles represent the average of 2 technical replicate wells. *P < .05, paired Student t test (A), log-rank test (B), simple linear regression analyses (C), 1-sample Student t test (D), repeated measures 1-way ANOVA with the Bonferroni correction (E). ns, not significant.
M-CSF, which is encoded by CSF1, regulates the differentiation and survival of T-ALL–supportive macrophages (Figure 7A), and elevated CSF1 expression is associated with poor prognosis in other cancers.53-55 Notably, expression of Csf1 and macrophage-enrichment scores were significantly correlated in T-ALL patients (Figure 7C). Because M-CSF–derived macrophages express more Igf1 than do GM-CSF–derived macrophages,39 we hypothesized that M-CSF–derived macrophages would support human T-ALL by activating IGF1R signaling. After culturing primary patient T-ALL cells in the presence or absence of myeloid cells, pIGF1R levels were elevated in T-ALL cells only by M-CSF–derived macrophages (Figure 7D; supplemental Figure 10D-E). Furthermore, survival of T-ALL cells cocultured with M-CSF–derived macrophages was significantly impaired in the presence of IGF1R inhibitors (Figure 7E). Collectively, these results indicate that myeloid cells promote progression of human T-ALL, consistent with findings in mouse models, and they do so, in part, by activating IGF1R signaling in T-ALL.
Discussion
Although it has long been recognized that T-ALL cells require external signals to survive in vitro,12,13,20,21 the cell types in the TME that promote T-ALL growth in vivo have remained elusive. Because our previous studies indicated a role for DCs in the thymic TME,11 we initially hypothesized that DCs would be required to support T-ALL in vivo. However, Flt3l−/− mice succumbed to T-ALL, despite diminished DC cellularity. Because our previous studies showed that CD11b+CD11c− myeloid cells from the thymic TME could also support primary T-ALL in vitro,11 we suspected that other myeloid cell types might compensate for the absence of DCs in Flt3l−/− mice. Indeed, enriched myeloid cells from the TME of Flt3l−/− mice robustly supported T-ALL survival in vitro. Cocultures with purified myeloid subsets revealed that macrophages had the most potent pro–T-ALL activity, followed by monocytes and cDC2. Consistent with these results from murine T-ALL models, primary patient T-ALL cells were also supported in cocultures by myeloid cells, including monocytes, M-CSF–derived macrophages, and GM-CSF plus IL-4–derived DCs. Collectively, these findings suggested that multiple myeloid subsets could support T-ALL in vivo.
In keeping with a critical role for myeloid cells in supporting T-ALL in vivo, depleting multiple myeloid subsets in mice with established leukemia via pharmacologic or genetic means resulted in a sharp decrease in circulating T-ALL blasts and reduced T-ALL infiltrates in several clinically relevant organs, like the spleen and BM. Notably, although tumor-associated myeloid cells can actively suppress antitumor immune responses,50 we found that myeloid depletion reduced T-ALL burden in the absence of adaptive immunity. Together, with the ability of myeloid cells to support T-ALL in cocultures, these data indicate that myeloid cells in distinct TMEs directly promote T-ALL growth.
Depletion of myeloid cells either before or after T-ALL transfer revealed that myeloid cells promote T-ALL engraftment and progression of established disease. After developing in the thymus, T-ALL cells egress from the thymus and infiltrate secondary organs, including the spleen, liver, BM, and LN. To engraft at these sites, T-ALL cells must encounter a supportive microenvironment. Interestingly, splenic myeloid cells in tumor-free mice, unlike healthy thymic DCs,11 have some capacity to support T-ALL survival, albeit less so than leukemia-associated myeloid cells. These findings suggest that T-ALL cells encounter myeloid cells capable of supporting engraftment upon entry into secondary sites. The finding that tumor-free splenic myeloid cells supported T-ALL is also consistent with the result that healthy PBMC-derived myeloid subsets supported survival of patient T-ALL cells. After engrafting, T-ALL cells modify the environment through unknown signals, resulting in recruitment and/or differentiation of myeloid cells with an enhanced capacity to support T-ALL growth. The correlation between increased CSF1 expression and elevated macrophage signatures in patients suggests that CSF1 may contribute to altering the myeloid compartment in aggressive T-ALL, because patients with higher macrophage signatures have worse outcomes. However, the source and cause of increased CSF1 expression remain to be determined.
Transcriptional profiling data implicated IGF1R signaling in myeloid-mediated T-ALL support, and myeloid cells, including DCs and M2-like macrophages, can be an important source of IGF1.56 Our previous studies demonstrated that leukemia-associated thymic DCs in LN3 mice with primary T-ALL express and secrete elevated levels of IGF1 relative to DCs from healthy thymuses.11 Thus, we tested whether IGF1R signaling was activated in T-ALL cells in vivo by myeloid cells. Indeed, acute myeloid depletion resulted in a significant reduction in IGF1R and AKT activation in T-ALL cells, and IGF1R signaling was required for survival of mouse and human T-ALL cells cocultured with leukemic myeloid cells. It remains to be determined whether myeloid cells must produce IGF1 and/or other factors to support T-ALL survival and whether tissue-resident and/or monocyte-derived macrophages promote T-ALL growth. The finding that only M-CSF–derived macrophages induced IGF1R activation in patient T-ALL cells implicates M2-like macrophages as playing a dominant role. The finding that PBMC-derived monocytes supported T-ALL survival but did not activate IGF1R also indicates that additional signals are involved in myeloid-mediated T-ALL support. A more complete understanding of the origin and identity of T-ALL–supportive myeloid cells and their tumor-supportive mechanisms will reveal which subsets and signals would be optimal therapeutic targets.
Collectively, our study demonstrates that myeloid composition and function are altered in multiple organs, such that myeloid cells can directly support T-ALL growth in vivo. Other signals in the TME of different organs likely complement myeloid-dependent signals to promote T-ALL progression. Myeloid depletion delays T-ALL incidence and improves survival, but most mice still succumb to leukemia. This may partially reflect incomplete myeloid depletion, because the reduction in T-ALL burden was greatest in organs in which clodlip efficiently eliminated multiple myeloid subsets. In addition, previous studies identified a CXCR4-CXCL12 axis as critical for T-ALL survival in the BM.20,21 Also, IL-7 can support T-ALL and is produced by stromal cells in the LN.57,58 Nevertheless, our studies clearly demonstrate that myeloid cells play a critical role in promoting T-ALL progression in vivo and indicate that a combined therapeutic strategy to target signals provided by myeloid cells and other stromal components may prove efficacious.
RNA sequencing data reported in this article have been deposited in the Gene Expression Omnibus database (accession number GSE150096).
For original data, please contact Lauren I. R. Ehrlich (lehrlich@austin.utexas.edu).
The online version of this article contains a data supplement.
The publication costs of this article were defrayed in part by page charge payment. Therefore, and solely to indicate this fact, this article is hereby marked “advertisement” in accordance with 18 USC section 1734.
Acknowledgments
The authors thank all members of the Ehrlich laboratory for helpful discussions and advice. They also thank the staff of the animal facility and the Center for Biomedical Research Support at the University of Texas at Austin for technical assistance.
This work was supported by grant RP180073 from the Cancer Prevention and Research Institute of Texas (L.I.R.E.), grant RSG367515 from the American Cancer Society (L.I.R.E.), the William and Ella Owens Medical Research Foundation (L.I.R.E.), grant PF14-216 from the American Cancer Society (T.A.T.), grant RR160093 from the Cancer Prevention and Research Institute of Texas (in support of T.A.T.), and The Clayton Foundation (C.-H.L. and G.G.).
Authorship
Contribution: A.L., T.A.T., S.H.N., Z.H., D.A., W.H.G., R.Y.A., A.S., H.J.S., and C.-H.L. performed experiments; A.L., and T.A.T. designed experiments, analyzed results, generated figures, and wrote the manuscript; G.G. and T.M.H. provided advice and materials; and L.I.R.E. designed experiments, analyzed and interpreted results, and wrote the manuscript.
Conflict-of-interest disclosure: The authors declare no competing financial interests.
Correspondence: Lauren I. R. Ehrlich, 100 East 24th St, STOP A5000, Austin, TX 78712-1191; e-mail: lehrlich@austin.utexas.edu; and Todd A. Triplett, 6.226 HDB, Dell Medical School, 1701 Trinity St, Austin, TX 78712-1873; e-mail: todd.triplett@austin.utexas.edu.

This feature is available to Subscribers Only
Sign In or Create an Account Close Modal