

Key Points
High GDF-15 levels are robustly associated with an increased risk of VTE.
MR reveals that GDF-15 is a risk marker rather than a causal risk factor for VTE.

Abstract
Growth differentiation factor 15 (GDF-15), a marker of inflammation and oxidative stress, has emerged as a biomarker for arterial cardiovascular disease. However, the association between GDF-15 and venous thromboembolism (VTE) remains uncertain. We therefore investigated the association between plasma GDF-15 levels and future risk of incident VTE and explored the potential of a causal association using Mendelian randomization (MR). We conducted a population-based nested case-control study comprising 416 VTE patients and 848 age- and sex-matched controls derived from the Tromsø Study. Logistic regression was used to calculate odds ratios (ORs) for VTE across GDF-15 quartiles. For the MR, we used data from the International Network on Venous Thrombosis (INVENT) consortium to examine whether single nucleotide polymorphisms (SNPs) associated with GDF-15 levels with genome-wide significance were related to VTE. We found that the ORs for VTE increased across GDF-15 quartiles (Ptrend = .002). Participants with GDF-15 values in the highest quartile (≥358 pg/mL) had an OR for VTE of 2.05 (95% confidence interval, 1.37-3.08) compared with those with GDF-15 in the lowest quartile (<200 pg/mL) in the age- and sex-adjusted model. ORs remained essentially the same after further adjustment for body mass index, smoking, hormone therapy, physical activity, and C-reactive protein. Similar results were obtained for provoked/unprovoked events, deep vein thrombosis, and pulmonary embolism. GDF-15 levels, as predicted by the SNPs, were not associated with VTE in MR. Our results indicate that high GDF-15 levels are associated with increased risk of VTE, but MR suggests that this association is not causal.
Introduction
Venous thromboembolism (VTE), encompassing deep vein thrombosis (DVT) and pulmonary embolism (PE), is a multicausal disease, affecting 1 to 2 per 1000 individuals each year.1 VTE is associated with serious short- and long-term complications, including postthrombotic syndrome, recurrence, and death.1,2 In contrast to arterial cardiovascular disease (CVD), such as myocardial infarction (MI) and ischemic stroke, for which the incidence has declined during the last decades,3-5 the incidence of VTE has slightly increased during the same time period.6-8 It is likely that the incidence of VTE will continue to rise in the coming years because major risk factors for VTE such as advancing age, obesity, and the incidence of cancer are increasing in the population.9-11 To reduce the health burden associated with VTE, novel biomarkers need to be identified and causal pathways that contribute to VTE pathogenesis must be unraveled.
Growth differentiation factor 15 (GDF-15), also known as macrophage inhibitory cytokine 1 (MIC-1), is a member of the transforming growth factor β (TGF-β) superfamily.12 GDF-15 is recognized as a marker of oxidative stress, inflammation, and tissue remodeling.13-17 It has been shown to be a biomarker for risk of future arterial CVD18 and for thromboembolic and bleeding risk in patients with atrial fibrillation treated with anticoagulant therapy.19 Moreover, previous studies have shown increased plasma levels of GDF-15 in acute PE, and in patients with adverse outcome after PE.20,21
In a small community-based cohort (Framingham Heart Study), higher levels of GDF-15 were associated with increased risk of future VTE.22 However, data on the association between GDF-15 and VTE remains scarce,22 and the possible mechanisms underlying this association are unknown. For instance, the association between GDF-15 levels and VTE may be explained by common factors (confounders) that are related to both GDF-15 (exposure) and VTE (outcome). Inflammation and oxidative stress are linked to the pathogenesis of venous thrombosis,23,24 and these factors have been shown to induce GDF-15 expression in experimental studies.13,14,17 Thus, GDF-15 may simply be a risk marker of VTE rather than a component in the causal path. Alternatively, GDF-15 may be causally related to VTE. If so, genetic variants that regulate GDF-15 levels are expected to be associated with VTE. Clarification of this question is worth pursuing from both mechanistic and clinical viewpoints because GDF-15 could emerge as a potential new target for VTE prevention. First, we investigated the association between plasma levels of GDF-15 and the future risk of incident VTE and adjusted for high-sensitivity C-reactive protein (CRP), a sensitive and reliable downstream marker of inflammation. Second, we explored the potential association between GDF-15 and VTE from a causal perspective using a Mendelian randomization (MR) approach to examine whether genetically predicted levels of GDF-15 were associated with VTE.
Methods
Study population
To address the association between plasma levels of GDF-15 and future risk of incident VTE, we used a nested case-control study derived from the Tromsø Study. The Tromsø Study is a single-center population-based cohort study, with repeated health surveys of inhabitants in Tromsø, Norway.25 All inhabitants age 25 years or older living in the municipality of Tromsø were invited to take part in the fourth survey of the Tromsø Study (Tromsø 4), carried out in 1994-1995. A total of 27 158 individuals participated, corresponding to 77% of those who were invited. Participants were followed from the inclusion date until the date of an incident VTE, migration, death, or end of follow-up (September 1, 2007).26 The identification of all first lifetime VTE events was performed by searching the hospital discharge diagnosis registry, the autopsy registry, and the registry of radiologic procedures from the University Hospital of North Norway, which is the only hospital in the Tromsø region. Trained personnel performed extensive review of medical records to adjudicate each VTE event. An episode of VTE was confirmed if there were signs and symptoms consistent with DVT or PE in combination with objective confirmation by radiologic methods, leading to initiation of treatment, as previously described.26 A VTE event was classified as provoked when it occurred in the presence of 1 or more of the following provoking factors: active cancer, trauma or surgery (within 8 weeks before the event), acute medical conditions (acute ischemic stroke, acute MI, or acute infection), immobilization (bed rest for longer than 3 days, confinement to a wheelchair within the past 8 weeks, or long distance travel of 4 hours or longer within the past 14 days), or other factors specifically described as being provoked by a physician in the medical record (eg, intravascular catheter).
A total of 462 individuals experienced a VTE event during the follow-up period (1994-2007), as described in Figure 1. For each case, 2 age- and sex-matched controls who were alive at the index date of the VTE event were randomly sampled from the source cohort (n = 924), as previously described.27,28 In 46 cases and 76 controls, plasma samples of sufficient quality were not available for the analyses; consequently, our final analyses comprised 416 VTE cases and 848 controls. The regional committee for medical and health research ethics approved the study, and all study participants provided written informed consent.
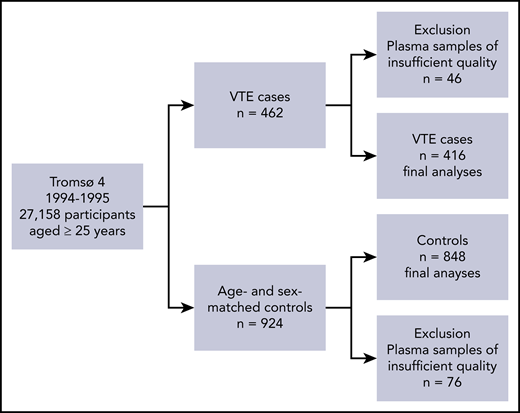
Flowchart of the study population. The flowchart illustrates the nested case-control study derived from the fourth survey of the Tromsø Study (1994-1995).
Flowchart of the study population. The flowchart illustrates the nested case-control study derived from the fourth survey of the Tromsø Study (1994-1995).
Baseline measurements
Body height (to the nearest cm) and weight (to the nearest 0.5 kg) were assessed with participants wearing light clothing and no shoes.26 Body mass index (BMI) was calculated as weight divided by the square of height in meters (kg/m2). A self-administered questionnaire was used to collect detailed baseline information related to previous history of cancer and arterial CVD events (ie, MI, angina pectoris, transient ischemic attack, and stroke).27,28 The questionnaire also included information on lifestyle factors, such as current daily smoking (pipe, cigar, or cigarettes), hormone therapy (estrogen supplementation or oral contraceptives), and physical activity. Physical activity was dichotomized into regular physical activity (≥1 hour per week) yes/no.
Blood sample collection and storage of blood products
Procedures for blood collection and storage of blood products have been previously described elsewhere.27,28 Briefly, blood from participants who were not fasting was collected from an antecubital vein into 5-mL vacutainers (Becton Dickinson, Le Pont de Claix, France) containing EDTA (K3-EDTA 40 µL, 0.37 mol/L per tube) as an anticoagulant at inclusion in Tromsø 4 (1994-1995). Platelet-poor plasma was prepared by centrifugation at 3000g for 10 minutes at room temperature, after which the supernatant was transferred into cryovials (Greiner Laboratechnik, Nürtringen, Germany) in 1-mL aliquots and stored at −80°C until further analysis.
Measurement of GDF-15, CRP, and hemostatic factors
Plasma samples were thawed at 37°C in a water bath for 5 minutes and prepared for analyses by centrifugation at 13 500g for 2 minutes to obtain platelet-free plasma.28 High-sensitivity CRP28 and GDF-15 plasma levels were measured in duplicates by enzyme-immunoassay (EIA) using commercially available reagents (R&D Systems, Minneapolis, MN) in a 384 format using the combination of a SELMA (Jena, Germany) pipetting robot and a BioTek (Winooski, VT) dispenser/washer (EL406). Absorption was read at 450 nm with a wavelength correction set to 540 nm using an EIA plate reader (Synergy H1 Hybrid, BioTek, Winooski, VT). The intra- and interassay coefficients of variation were 2.6% and 9.1%, respectively, for high-sensitivity CRP,28 and 2.4% and 7.0% for GDF-15. Plasma levels of von Willebrand factor were measured by EIAs with antibodies (A0082, P02256) obtained from Dako (Glostrup, Denmark) using a polyclonal antibody for coating (A0082) and a horseradish peroxidase–conjugated polyclonal antibody for detection (P02256). Parallel diluted pooled human plasma was used as standard. D-dimer was measured by EIA using a monoclonal antibody (s4H9)29 for coating together with a monoclonal horseradish peroxidase–conjugated antibody for detection (ab24474, Abcam, Cambridge, United Kingdom). Parallel diluted samples of known concentration were used as standards.
Statistical analysis
Association between GDF-15 levels and VTE: the nested case-control study
Statistical analyses were carried out using Stata version 15.0 (StataCorp, College Station, TX) and R version 3.6.1 (The R Foundation for Statistical Computing, Vienna, Austria). GDF-15 was categorized according to quartile cutoffs determined in the control population (<200, 200-264, 264-358, ≥358 pg/mL). Baseline characteristics across quartiles of GDF-15 were expressed as proportions for categorical variables and as mean (± standard deviation [SD]) or median (25th-75th percentiles) for continuous variables. Logistic regression models were used to calculate odds ratios (OR) for VTE with 95% confidence intervals (CIs) according to quartiles of GDF-15. The lowest GDF-15 quartile was used as the reference category. The association between GDF-15 levels and VTE was adjusted for age and sex in model 1, for age, sex, BMI, smoking, hormone therapy, and physical activity in model 2, and CRP was added to model 3. We calculated the P value for linear trend for VTE risk across increasing quartiles of GDF-15.
We performed subgroup analyses according to VTE location (ie, DVT and PE) and presence of provoking factors (ie, provoked and unprovoked VTE events). Arterial CVD and cancer are comorbidities associated with both GDF-15 levels18,30 and VTE.31-33 For sensitivity purposes, we evaluated the association between GDF-15 levels and overall VTE after excluding participants with self-reported history of cancer or arterial CVD events at baseline. Of note, D-dimer and von Willebrand factor are hemostatic factors reported to be associated not only with incident VTE34-36 but also with GDF-15 levels.37 To investigate whether these well-established VTE biomarkers could affect the association between GDF-15 levels and VTE, we added them to a fourth model as a sensitivity analysis.
Our results based on only 1 measurement of GDF-15 could be subject to regression dilution bias because of the long follow-up time in the source cohort.38 To assess this question, analyses were performed by restricting the maximum follow-up time for the VTE cases while keeping all controls in the analyses.27,28 ORs were estimated at every 0.1-year increase in follow-up time and plotted as a function of this maximum time. A minimum of 10 VTE cases were required for the first estimation.
MR
We used an MR approach to investigate the association between GDF-15 levels and risk of VTE from a causal perspective. MR is a method that uses genetic variants that are associated with modifiable exposures to assess causal relationship between exposures and diseases.39,40 MR relies on the fact that genotypes are randomly assigned at gamete formation, are generally independent of confounding, and are not influenced by disease processes.39,40 This way, MR is suitable for causal inference in observational studies. MR analysis requires estimates of the effect sizes of both the association between the single nucleotide polymorphisms (SNPs) and the exposure (ie, GDF-15 levels) and the association between the SNPs and the outcome (ie, VTE).41 In this study, we conducted a 2-sample MR analysis (ie, the SNP-exposure effects and the SNP-outcome effects were taken from 2 separate studies).41 To obtain the effect size of SNPs on GDF-15 levels, we used data from the largest available meta-analysis of genome-wide association studies of GDF-15 levels reported to date, with 5440 community-based white participants.42 In this meta-analysis, 9 SNPs on chromosome 19 were associated with GDF-15 blood concentration with genome-wide significance (ie, rs888663, rs3746181, rs1363120, rs749451, rs1054564, rs1227731, rs3195944, rs17725099, and rs16982345).42 For each of the 9 SNPs, effect size estimates and standard errors were extracted from the meta-analysis.42 Next, we used genome-wide association study summary data from the International Network on Venous Thrombosis (INVENT) consortium meta-analysis (7507 VTE cases and 52 632 controls)43 to obtain the effect size estimates of the association between these SNPs and VTE. The detailed information on the 9 SNPs (eg, position on chromosome 19, location relative to the nearest gene, and minor allele frequency) is described in supplemental Table 1 (available on the Blood Web site), along with the effect size estimates and standard errors for the SNP-exposure association and the SNP-outcome association obtained from the meta-analysis42 and the INVENT consortium,43 respectively.
After filtering the 9 SNPs with a maximum linkage disequilibrium of 0.3, rs1054564, rs17725099, rs749451, and rs888663 SNPs were used in the final analysis (for details on linkage disequilibrium estimates, see supplemental Table 2). Of the 4 SNPs, rs888663 and rs17725099 are located in the downstream region of the pyroglutamyl-peptidase 1 (PGPEP1) gene, rs1054564 is located in the 3′ untranslated region of GDF15, and rs749451 is located in the 3′ untranslated region of PGPEP1 (supplemental Table 1). The 4 SNPs included in the MR analysis explained ∼8.9% of the variance of GDF-15 blood concentration, as described in supplemental Table 1.The analysis was performed using the MR-Base framework.41 Causal-effect estimates of GDF-15 levels on VTE were obtained separately for each SNP, and to generate an estimate using all the SNPs, we used the inverse variance weighted method for primary analysis and MR-Egger for sensitivity analysis.44
Results
Association between GDF-15 levels and VTE: the nested case-control study
The distribution of baseline characteristics across quartiles of GDF-15 levels is shown in Table 1. The mean age, median CRP levels, proportion of self-reported history of arterial CVD, and current smoking increased across quartiles of GDF-15, whereas the proportion of participants with regular physical activity decreased. The sex distribution, mean BMI, proportion of participants with cancer, and current use of hormone therapy did not differ substantially across quartiles of GDF-15.
Distribution of baseline characteristics according to quartiles of plasma levels of GDF-15
| Characteristic | Plasma GDF-15 (pg/mL) | |||||||||||
|---|---|---|---|---|---|---|---|---|---|---|---|---|
| Quartile 1 (<200) | Quartile 2 (200-264) | Quartile 3 (264-358) | Quartile 4 (≥358) | |||||||||
| No. of participants | 285 | 326 | 313 | 340 | ||||||||
| Age, mean ± SD, years | 49 ± 13 | 57 ± 12 | 64 ± 11 | 69 ± 11 | ||||||||
| Male sex, n (%) | 137 (48.1) | 166 (50.9) | 144 (46.0) | 147 (43.2) | ||||||||
| High-sensitivity CRP, median (25th-75th percentile), mg/L | 0.93 (0.56-1.84) | 1.18 (0.68-2.34) | 1.49 (0.89-2.68) | 1.90 (0.90-3.44) | ||||||||
| BMI, mean ± SD, kg/m2 | 25.9 ± 3.8 | 26.4 ± 4.1 | 26.7 ± 4.3 | 26.5 ± 4.7 | ||||||||
| Smoking, n (%) | 67 (23.5) | 92 (28.2) | 104 (33.2) | 131 (38.5) | ||||||||
| Hormone therapy, n (%) | 19 (6.7) | 20 (6.1) | 14 (4.5) | 7 (2.1) | ||||||||
| Physical activity, n (%)* | 76 (26.7) | 78 (23.9) | 47 (15.0) | 38 (11.2) | ||||||||
| Cancer, n (%)† | 8 (2.8) | 12 (3.7) | 19 (6.1) | 19 (5.6) | ||||||||
| Arterial CVD, n (%)‡ | 13 (4.6) | 46 (14.1) | 54 (17.3) | 87 (25.6) | ||||||||
Physical activity was defined as regular physical activity (≥1 hour per week) at baseline.
Self-reported history of cancer at baseline.
Self-reported history of arterial CVD (MI, angina, stroke) at baseline.
The characteristics of the VTE patients are shown in Table 2. The mean age at the time of VTE was 67.6 ± 13.7 years, and 48.1% were men. Among the VTE patients, 62.3% presented with DVT and 57.9% with provoked VTE events. The most common provoking factors were surgery or trauma (22.4%), cancer (21.4%), and immobilization (18.0%).
Characteristics of the VTE events (n = 416)
| Characteristic | Value | ||
|---|---|---|---|
| Age at VTE, mean ± SD, years | 67.6 ± 13.7 | ||
| Male sex, n (%) | 200 (48.1) | ||
| DVT, n (%) | 259 (62.3) | ||
| PE, n (%) | 157 (37.7) | ||
| Unprovoked VTE, n (%) | 175 (42.1) | ||
| Provoked VTE, n (%) | 241 (57.9) | ||
| Surgery or trauma, n (%) | 93 (22.4) | ||
| Cancer, n (%) | 89 (21.4) | ||
| Immobilization, n (%) | 75 (18.0) | ||
| Acute medical condition, n (%) | 65 (15.6) | ||
| Other factors, n (%) | 17 (4.1) | ||
The ORs for VTE according to quartiles of plasma levels of GDF-15 are shown in Table 3. For overall VTE, the ORs increased across quartiles of GDF-15 in the age- and sex-adjusted model (Ptrend = .002). Individuals with plasma GDF-15 levels in the highest quartile (≥358 pg/mL) had a 2.1-fold higher OR for VTE (OR, 2.05; 95% CI, 1.37-3.08) compared with those with GDF-15 in the lowest quartile (<200 pg/mL). Risk estimates remained essentially the same after adding BMI, smoking, hormone therapy, and physical activity to model 2 (OR, 2.24; 95% CI, 1.46-3.43), as well as after further adjustment for CRP in model 3 (OR, 2.07; 95% CI, 1.35-3.19).
ORs (95% CIs) for overall VTE and subgroups according to quartiles of plasma levels of GDF-15
| Quartiles of GDF-15 (pg/mL) | Controls | Cases | OR (95% CI) | ||
|---|---|---|---|---|---|
| Model 1 | Model 2 | Model 3 | |||
| Overall VTE | |||||
| <200 | 211 | 74 | 1 (reference) | 1 (reference) | 1 (reference) |
| 200-264 | 213 | 113 | 1.63 (1.14-2.35) | 1.67 (1.16-2.41) | 1.63 (1.13-2.35) |
| 264-358 | 211 | 102 | 1.59 (1.08-2.36) | 1.67 (1.12-2.51) | 1.59 (1.06-2.39) |
| ≥358 | 213 | 127 | 2.05 (1.37-3.08) | 2.24 (1.46-3.43) | 2.07 (1.35-3.19) |
| Ptrend | .002 | .001 | .003 | ||
| DVT | |||||
| <200 | 211 | 46 | 1 (reference) | 1 (reference) | 1 (reference) |
| 200-264 | 213 | 73 | 1.74 (1.13-2.68) | 1.75 (1.13-2.70) | 1.70 (1.10-2.64) |
| 264-358 | 211 | 66 | 1.71 (1.07-2.72) | 1.76 (1.09-2.85) | 1.68 (1.04-2.73) |
| ≥358 | 213 | 74 | 2.00 (1.23-3.26) | 2.13 (1.28-3.54) | 1.99 (1.19-3.33) |
| Ptrend | .015 | .009 | .023 | ||
| PE | |||||
| <200 | 211 | 28 | 1 (reference) | 1 (reference) | 1 (reference) |
| 200-264 | 213 | 40 | 1.48 (0.87-2.53) | 1.54 (0.89-2.66) | 1.49 (0.86-2.58) |
| 264-358 | 211 | 36 | 1.42 (0.79-2.54) | 1.54 (0.85-2.80) | 1.43 (0.78-2.62) |
| ≥358 | 213 | 53 | 2.14 (1.19-3.86) | 2.38 (1.29-4.39) | 2.15 (1.16-4.00) |
| Ptrend | .016 | .008 | .023 | ||
| Provoked VTE | |||||
| <200 | 211 | 38 | 1 (reference) | 1 (reference) | 1 (reference) |
| 200-264 | 213 | 71 | 1.93 (1.22-3.03) | 1.96 (1.24-3.10) | 1.92 (1.21-3.05) |
| 264-358 | 211 | 53 | 1.50 (0.91-2.48) | 1.56 (0.94-2.61) | 1.51 (0.90-2.52) |
| ≥358 | 213 | 79 | 2.27 (1.36-3.78) | 2.37 (1.40-4.02) | 2.25 (1.32-3.84) |
| Ptrend | .011 | .009 | .018 | ||
| Unprovoked VTE | |||||
| <200 | 211 | 36 | 1 (reference) | 1 (reference) | 1 (reference) |
| 200-264 | 213 | 42 | 1.32 (0.80-2.18) | 1.33 (0.80-2.22) | 1.29 (0.77-2.15) |
| 264-358 | 211 | 49 | 1.75 (1.03-2.95) | 1.83 (1.07-3.16) | 1.70 (0.98-2.95) |
| ≥358 | 213 | 48 | 1.82 (1.05-3.17) | 2.05 (1.15-3.66) | 1.83 (1.02-3.30) |
| Ptrend | .024 | .010 | .033 | ||
Model 1, adjusted for age and sex; Model 2, adjusted for age, sex, BMI, smoking, hormone therapy, and physical activity; Model 3, adjusted for age, sex, BMI, smoking, hormone therapy, physical activity, and high-sensitivity CRP.
Similar to the overall analysis, GDF-15 levels were consistently associated with VTE risk in all subgroups (ie, DVT, PE, provoked VTE, and unprovoked VTE) (Table 3). In the age- and sex-adjusted model, individuals with plasma GDF-15 levels in the highest quartile had a 2.0-fold higher OR for DVT (OR, 2.00; 95% CI, 1.23-3.26) and a 2.1-fold higher OR for PE (OR, 2.14; 95% CI, 1.19-3.86) compared with those with GDF-15 in the lowest quartile. The ORs for the highest vs the lowest quartile of GDF-15 were 2.27 (95% CI, 1.36-3.78) for provoked VTE and 1.82 (95% CI, 1.05-3.17) for unprovoked VTE. As in the overall analysis, risk estimates remained essentially the same in the subgroups after further adjustment for BMI, smoking, hormone therapy, physical activity, and CRP (Table 3). In the sensitivity analyses, exclusion of participants with self-reported history of cancer (supplemental Table 3) and arterial CVD (supplemental Table 4) at baseline yielded results similar to those in the main analysis. Supplemental Table 5 shows that even after additional adjustment for D-dimer and von Willebrand factor (model 4), GDF-15 levels remained consistently associated with VTE, with an OR of 2.00 (95% CI, 1.29-3.11) for the highest versus the lowest quartile (Ptrend across quartiles = .007).
To investigate the possibility of underestimating ORs as a result of regression dilution bias, we estimated ORs for VTE among individuals with high (highest quartile) vs low (lowest quartile) plasma GDF-15 as a function of time between blood sampling and VTE events. As shown in Figure 2, the ORs for VTE by high levels of GDF-15 were substantially higher with shortened time between blood sampling and VTE events.
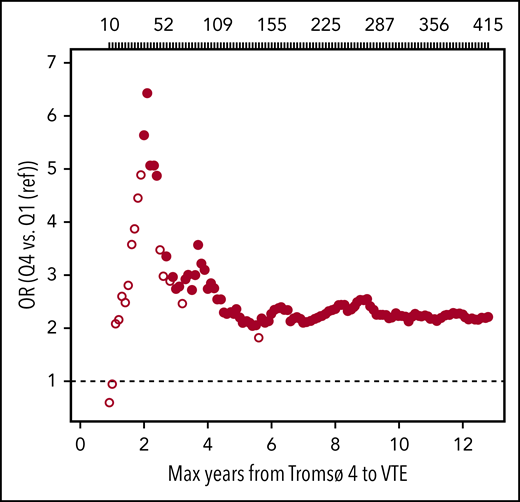
Plots of estimated ORs for overall VTE as a function of time from blood sampling in Tromsø 4 (1994-1995) to VTE events. Participants with plasma GDF-15 levels in the highest quartile (Q4) were compared with those with GDF-15 levels in the lowest quartile (Q1, reference category). Analyses were adjusted for age, sex, BMI, smoking, hormone therapy, physical activity, and high-sensitivity CRP. Large, solid circles indicate ORs with P < .05. The number of VTE events are depicted above the plot. Note that because of a missing value in BMI, there were 415 VTE events when BMI was used as an adjustment variable.
Plots of estimated ORs for overall VTE as a function of time from blood sampling in Tromsø 4 (1994-1995) to VTE events. Participants with plasma GDF-15 levels in the highest quartile (Q4) were compared with those with GDF-15 levels in the lowest quartile (Q1, reference category). Analyses were adjusted for age, sex, BMI, smoking, hormone therapy, physical activity, and high-sensitivity CRP. Large, solid circles indicate ORs with P < .05. The number of VTE events are depicted above the plot. Note that because of a missing value in BMI, there were 415 VTE events when BMI was used as an adjustment variable.
MR
Causal-effect estimates of GDF-15 levels on VTE using MR analysis are shown in Figure 3. Genetically predicted GDF-15 levels were not associated with VTE in analyses for each of the individual SNPs: rs888663 (log-odds per SD, 0.106; 95% CI, −0.082 to 0.294), rs17725099 (log-odds per SD, 0.089; 95% CI, −0.233 to 0.412), rs749451 (log-odds per SD, −0.052; 95% CI, −0.261 to 0.156), and rs1054564 (log-odds per SD, −0.124; 95% CI, −0.347 to 0.099). When the 4 SNPs were combined, no association of GDF-15 with VTE was detected in inverse variance–weighted analysis (log-odds per SD, 0.002; 95% CI, −0.109 to 0.113) and MR-Egger analysis (log-odds per SD, −0.030; 95% CI, −0.623 to 0.564).
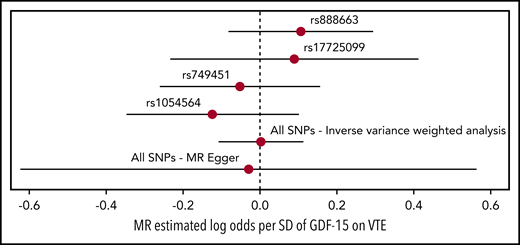
Forest plot of the MR analysis. Forest plot of the MR analysis with point estimates (log-odds per SD of GDF-15) and 95% CIs of causal effect of GDF-15 levels on VTE for each SNP and collectively (ie, inverse variance–weighted analysis and MR-Egger) in regression analyses.
Forest plot of the MR analysis. Forest plot of the MR analysis with point estimates (log-odds per SD of GDF-15) and 95% CIs of causal effect of GDF-15 levels on VTE for each SNP and collectively (ie, inverse variance–weighted analysis and MR-Egger) in regression analyses.
Discussion
In this nested case-control study derived from the general population, we found that the risk of VTE increased with increasing levels of GDF-15. Participants with GDF-15 levels in the highest quartile had a twofold higher OR for VTE than those with GDF-15 in the lowest quartile in analyses adjusted for age and sex. The risk estimates remained essentially the same after further adjustment for potential confounders, including BMI, lifestyle factors (ie, smoking, hormone therapy, and physical activity) and CRP. Similar results were obtained for DVT, PE, and provoked and unprovoked VTE events, and after excluding participants with self-reported history of cancer and arterial CVD at baseline. In contrast, when using an MR approach, genetically predicted GDF-15 plasma levels were not associated with VTE. Our findings suggest that GDF-15 is not causally related to VTE, but GDF-15 may still be relevant as a biomarker to help improve risk stratification of VTE.
GDF-15 has emerged as a biomarker in several diseases, including arterial CVD, heart failure, and cancer. For instance, higher levels of GDF-15 have been associated with increased risk of future cardiovascular events in the community and in patients with coronary artery disease, and with adverse outcomes among those with heart failure.18 Moreover, increased GDF-15 has been associated with various types of cancer,30 kidney disease,45 and inflammatory disorders, such as rheumatoid arthritis.46 In the ARISTOTLE trial, GDF-15 was associated with major bleeding and death in patients with atrial fibrillation who were receiving oral anticoagulation.19 Although GDF-15 is weakly expressed in human tissue during normal conditions,14 GDF-15 seems to be expressed and secreted in response to inflammation,14,17 oxidative stress,13,17 and hypoxia,17 reflecting its potential as a biomarker for development and progression of a wide range of disorders.
In contrast to arterial CVD, the association between plasma GDF-15 levels and VTE has not been thoroughly investigated. The predictive ability of 12 biomarkers was assessed in the Framingham Heart Study, a cohort consisting of 3120 participants, of whom 139 developed an incident VTE during a median follow-up of 16 years.22 Among the tested biomarkers, GDF-15 and D-dimer were individually associated with VTE in multivariable-adjusted analyses. In our nested case-control study derived from a population-based cohort, we extended previous findings by identifying GDF-15 as a global biomarker for VTE of similar effect size irrespective of the presence of provoking factors and location of the VTE event (ie, DVT or PE).
To the best of our knowledge, this study is the first to address the relationship between GDF-15 levels and VTE from a causal point of view. In our observational study, causality was assessed by using genetic variants and applying MR, thus avoiding confounding and reverse causation.39,40 By using a group of 4 SNPs associated with GDF-15 levels on a genome-wide significant level,42 we found that genetically predicted GDF-15 levels were not associated with VTE. This finding suggests that GDF-15 is not causally related to VTE but it is simply a risk marker for VTE. Furthermore, our results, which show that the VTE risk was considerably higher with shortened time between blood sampling and the thrombotic events, reinforce the notion that GDF-15 is a modifiable biomarker. Still, it is important to address that even when blood samples were collected several years before the thrombotic event, GDF-15 levels remained significantly associated with VTE, a finding that underscores the potential of GDF-15 as a reliable biomarker for VTE. To clarify the clinical utility of GDF-15 as a biomarker for VTE, assessment of the association between GDF-15 and VTE after adjustment for well-established VTE biomarkers would be an important step. Interestingly, we found that the association between GDF-15 levels and VTE was essentially independent of D-dimer and von Willebrand factor, which are well-known biomarkers for incident VTE.34-36 This finding suggests that GDF-15 could be a useful biomarker for improving risk stratification for VTE in the clinic that would guide decision-making on VTE prevention together with other relevant biomarkers using a multimarker approach.
A noteworthy finding of this study was the fact that inflammation did not seem to explain the relationship between GDF-15 levels and VTE, because adjustment for CRP had a negligible effect on the risk estimates. Because GDF-15 has also been regarded as a marker of oxidative stress,13,17 oxidative stress could be relevant for the association between GDF-15 and VTE. Accordingly, experimental data have shown that hydrogen peroxide enhanced venous thrombosis susceptibility in aged mice.24 Further studies are warranted to confirm our findings on the association between plasma GDF-15 levels and VTE and reveal underlying mechanisms for this association.
Strengths of our study include the nested case-control study design, in which the VTE cases were selected from a population-based cohort, and the age- and sex-matched controls were selected from the same source population. Because of the prospective nature of this study, it was possible to make assumptions on the temporal sequence between exposure and outcome. Some limitations of the study need to be mentioned. The blood samples in which the analysis of GDF-15 was performed were drawn in 1994-1995 and were stored at −80°C for up to 22 years. The long storage time could potentially affect the plasma levels of GDF-15. Nevertheless, it is unlikely that this would change the results, because a storage effect on plasma samples would be similar in VTE cases and controls. In addition, plasma GDF-15 was measured solely at baseline, and changes in GDF-15 levels during follow-up (up to 12 years) could have resulted in underestimation of the true association because of regression dilution.38 Although ORs for VTE according to plasma GDF-15 decreased with prolonged time between blood sampling and the thrombotic event, risk estimates remained significant during the entire follow-up period. Chronic kidney disease is associated with GDF-15 levels45 and VTE47 and could act as a potential confounder for the association between GDF-15 and VTE. Unfortunately, information on estimated glomerular filtration rate and albuminuria (variables used to define chronic kidney disease) was available in only a limited number of participants from Tromsø 4, and therefore we could not take chronic kidney disease into account in our regression analyses. In this study, the great majority of participants were white, and caution is warranted when extrapolating our findings to other ethnicities. Finally, the limitations of an MR approach40,41 should be considered when interpreting our results.
In conclusion, our results indicate that high plasma GDF-15 levels are associated with increased risk of VTE. Our findings on MR analysis further suggest that GDF-15 is not causally related to VTE.
For original data e-mail the corresponding author (vania.m.morelli@uit.no).
The online version of this article contains a data supplement.
The publication costs of this article were defrayed in part by page charge payment. Therefore, and solely to indicate this fact, this article is hereby marked “advertisement” in accordance with 18 USC section 1734.
Acknowledgment
K.G. Jebsen Thrombosis Research and Expertise Center is supported by an independent grant from Stiftelsen Kristian Gerhard Jebsen.
Authorship
Contribution: E.-S.H. contributed to statistical analysis, interpreted data, and drafted the manuscript; K.H. performed the Mendelian randomization analysis, interpreted data, and revised the manuscript; N.L., P.A., and T.U. performed the laboratory analysis and revised the manuscript; J.-B.H. conceived and designed the study, interpreted data, and revised the manuscript; and S.K.B. and V.M.M. contributed to statistical analyses, interpreted data, and revised the manuscript.
Conflict-of-interest disclosure: The authors declare no competing financial interests.
A complete list of the members of the INVENT Consortium appears in the supplemental appendix.
Correspondence: Vânia M. Morelli, K.G. Jebsen Thrombosis Research and Expertise Center, Department of Clinical Medicine, UiT-The Arctic University of Norway, N-9037 Tromsø, Norway; e-mail: vania.m.morelli@uit.no.

This feature is available to Subscribers Only
Sign In or Create an Account Close Modal