

Key Points
Genetically heterogeneous BC progenitors demonstrate molecular convergence on PRC1- and PRC2-regulated pathways.
A model of PRC-driven reprogramming identifies novel BC combination therapies, tumor suppressor genes, and biomarkers for transformation.

Abstract
Targeted therapies against the BCR-ABL1 kinase have revolutionized treatment of chronic phase (CP) chronic myeloid leukemia (CML). In contrast, management of blast crisis (BC) CML remains challenging because BC cells acquire complex molecular alterations that confer stemness features to progenitor populations and resistance to BCR-ABL1 tyrosine kinase inhibitors. Comprehensive models of BC transformation have proved elusive because of the rarity and genetic heterogeneity of BC, but are important for developing biomarkers predicting BC progression and effective therapies. To better understand BC, we performed an integrated multiomics analysis of 74 CP and BC samples using whole-genome and exome sequencing, transcriptome and methylome profiling, and chromatin immunoprecipitation followed by high-throughput sequencing. Employing pathway-based analysis, we found the BC genome was significantly enriched for mutations affecting components of the polycomb repressive complex (PRC) pathway. While transcriptomically, BC progenitors were enriched and depleted for PRC1- and PRC2-related gene sets respectively. By integrating our data sets, we determined that BC progenitors undergo PRC-driven epigenetic reprogramming toward a convergent transcriptomic state. Specifically, PRC2 directs BC DNA hypermethylation, which in turn silences key genes involved in myeloid differentiation and tumor suppressor function via so-called epigenetic switching, whereas PRC1 represses an overlapping and distinct set of genes, including novel BC tumor suppressors. On the basis of these observations, we developed an integrated model of BC that facilitated the identification of combinatorial therapies capable of reversing BC reprogramming (decitabine+PRC1 inhibitors), novel PRC-silenced tumor suppressor genes (NR4A2), and gene expression signatures predictive of disease progression and drug resistance in CP.
Introduction
Early-stage or chronic phase (CP) chronic myeloid leukemia (CML) is a genetically simple disease caused by the BCR-ABL1 fusion gene, and most patients treated with ABL1 tyrosine kinase inhibitors (TKI) enjoy a normal life expectancy.1,2 In contrast, patients with late-stage or blast crisis (BC) CML continue to die of TKI-resistant disease, with the development of novel therapeutic approaches made especially daunting by the molecular heterogeneity found within BC.3,4
In response to these challenges, several groups have suggested using convergence-based frameworks to elucidate resistance-conferring pathways that drive cancer progression as strategies to overcome them.5,6 Phenotypic convergence in cancer progression and drug resistance occurs in various cancers and has been attributed to evolutionary selection of recurring genetic and epigenetic alterations.5 The emergence of stem cell signatures within various cancer progression transcriptomes is a prime example of convergence, where it confers dual advantages of multidrug resistance and enhanced self-renewal.7,8 In BC, convergence can be appreciated phenotypically in patients by the inexorable accumulation of differentiation-arrested and multidrug-resistant CD34+ progenitors,3 and at the cellular and molecular levels by acquisition of leukemia stem cell (LSC) properties in bulk CD34+ BC progenitors,9,10 as well as a BC-specific gene expression signature that distinguishes them from CP progenitors.11,12 However, because BC-specific genetic events exist at low frequencies and occur in functionally diverse genes,3,4 recent work has focused on epigenetic alterations in driving CML progression.12 Notably, both polycomb repressive complex 2 (PRC2) and complex 1 (PRC1) have been implicated in CML: PRC2 in CP LSCs (which are distinct from BC LSCs)3,13-15 reprogramming, and PRC1 in BC transformation.16-18 Although both PRCs comprise multiprotein complexes with histone modification activity, and in general act to repress gene expression,19,20 the precise mechanisms by which they contribute to CP or BC remain unclear.13 Intriguingly, the mechanisms by which PRCs contribute to transformation are diverse and disease specific.21,22 Thus, even within hematologic malignancies, PRC2 can function either as an oncogene (lymphomas) or tumor suppressor gene (myeloid leukemias).19,23,24 Furthermore, understanding the stage-specific roles in CML has direct therapeutic implications, as drugs targeting EZH2 and BMI1, the enzymatic component of PRC2 and core component of PRC1, respectively, are being actively evaluated in clinical trials.21,25
To assess the contribution of genetic and epigenetic events toward pathway convergence in BC CML, we annotated the genomes, epigenomes, and transcriptomes from a rare set of paired CP to BC progression samples and supported this by analyses of a collection of unpaired samples. We identified recurrent PRC-associated events at the genetic, epigenetic, and transcriptomic levels, and by integrating these data sets, propose a novel BC model incorporating critical roles of PRC1 and PRC2 in BC reprogramming (Figure 7C). Guided by this model, we identify combinatorial epigenetic therapies capable of reversing BC reprogramming, novel PRC-silenced tumor suppressor genes, and potential biomarkers for disease progression and TKI resistance in CP.
Methods
Patient samples
CML samples were obtained from Singapore General Hospital; Akita University Hospital, Japan; City of Hope National Medical Center, United States; National University Hospital of Singapore; and University of California, Irvine Medical Center, United States. Written informed consent and institutional review board approval at the participating institutions were obtained from all patients who contributed samples.
Reagents, tissue culture, cell biology, and molecular biology techniques
Reagents and aforementioned techniques used are described in detail in the supplemental Methods, available on the Blood Web site.
Genomics analysis
Whole-genome sequencing (WGS) and exome sequencing were performed on the HiSeq 2000 (Illumina). Additional details are provided in the supplemental Methods.
Gene expression analysis
Patient cells were lysed immediately after thawing, and RNA was extracted using the AllPrep DNA/RNA/miRNA Universal kit (Qiagen, Netherlands). Samples were hybridized on Human BeadChip HT12 v4 whole-genome expression arrays (Illumina, San Diego, CA), as per manufacturer’s instructions. Additional details are provided in the supplemental Methods.
DNA methylation analysis
DNA was extracted using the AllPrep DNA/RNA/miRNA Universal kit concurrently with RNA extraction for gene expression analysis. Samples were hybridized on Illumina Infinium HumanMethylation450 BeadChip (Illumina, San Diego, CA) DNA methylation arrays. Additional details are provided in the supplemental Methods.
Chromatin immunoprecipitation sequencing
Chromatin immunoprecipitation (ChIP)-seq methodology and downstream processing are described in the supplemental Methods.
Statistical and bioinformatics analysis
Details are provided in the supplemental Methods.
Results
Genomic alterations of CML display a moderate mutation load and are enriched for PRC-related genes during progression
We performed WGS on a discovery set comprising 13 pairs of matched CP and BC (9 lymphoid BC [LBC] and 4 myeloid BC [MBC]) samples within our cohort (supplemental Tables 1-3). Because patients in the discovery cohort were deceased, nontumor germline controls were obtained from mesenchymal stromal cells isolated from bone marrow aspirates when possible (n = 6; “Methods”; supplemental Table 4). We took advantage of the 2 disease stages per patient by subtracting from the BC samples such genomic alterations as could already be detected in CP, thereby focusing on events acquired after CP (BC-specific). We found evidence for a novel CML-specific mutational signature (supplemental Figure 1; supplemental Note), but little evidence for reactive oxygen species (ROS) or activation induced cytidine deaminase (AID)/apolipoprotein B editing complex (APOBEC) signatures.26-28 On average, the mutational load was comparable to other acute leukemias.29 Recurrently mutated BC-specific genes encompassed those that have been previously described, with ABL1 kinase domain mutations and RUNX1 mutations being the most common and recurrent somatic single nucleotide variants (SNVs), but also an IKZF1 stop gain and a missense mutation (R208X and N159S, transcript NM_006060, Figures 1A-B; supplemental Tables 5-8). The ABL1 and RUNX1 mutations were not enriched for characteristic mutations of the CML signature (supplemental Figure 2). Of note, 5 of the patients with paired CP-BC samples progressed to BC within 6 months (supplemental Table 1). All 5 were patients with LBC, showing a lower mutation load than patients with LBC who progressed after 6 months (supplemental Figure 3), but no consistent differences for ABL1 mutations acquired during progression (supplemental Table 5B).
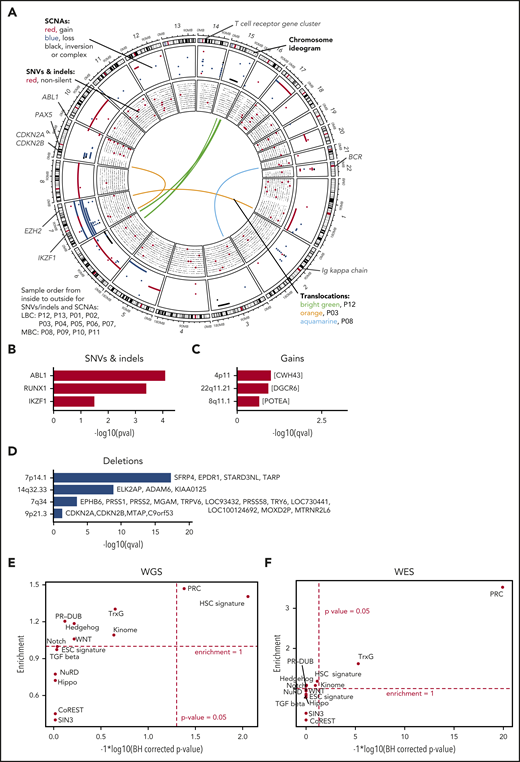
Genomic alterations during progress from CP to BC. (A) The genomic DNA of 13 paired patients with CML was analyzed by WGS at 2 disease stages, allowing the identification of stage-specific alterations for BC (CP→BC) for each patient. Circos plot shows in the outer layer genomic gains (red) deletions (blue), and inversion/complex rearrangements (black), followed toward the center by SNVs (silent/noncoding in black and putative damaging in red). Each row represents 1 of the 13 samples. Central lines show translocations with individual samples in different colors. (B) Significantly mutated genes by SNV and indels in 13 patients during progression. (C-D) Significantly copy number altered genomic regions acquired during progression by (C) gains and (D) deletions. (E-F) Test for significant (x-axis) and enrichment (y-axis) of genomic alterations acquired from CP to BC for paired (E, by WGS) or unpaired (F, by WES) samples in genes related to cancer and epigenetic pathways (see supplemental Table 11 for gene lists). Dashed lines indicate significance and deviation from the null hypothesis of no enrichment (enrichment = 1).
Genomic alterations during progress from CP to BC. (A) The genomic DNA of 13 paired patients with CML was analyzed by WGS at 2 disease stages, allowing the identification of stage-specific alterations for BC (CP→BC) for each patient. Circos plot shows in the outer layer genomic gains (red) deletions (blue), and inversion/complex rearrangements (black), followed toward the center by SNVs (silent/noncoding in black and putative damaging in red). Each row represents 1 of the 13 samples. Central lines show translocations with individual samples in different colors. (B) Significantly mutated genes by SNV and indels in 13 patients during progression. (C-D) Significantly copy number altered genomic regions acquired during progression by (C) gains and (D) deletions. (E-F) Test for significant (x-axis) and enrichment (y-axis) of genomic alterations acquired from CP to BC for paired (E, by WGS) or unpaired (F, by WES) samples in genes related to cancer and epigenetic pathways (see supplemental Table 11 for gene lists). Dashed lines indicate significance and deviation from the null hypothesis of no enrichment (enrichment = 1).
We identified somatic copy number alterations (SCNAs) acquired during transitions from CP to BC and found, on average, 60 Mb with copy number gain, 56 Mb with copy number loss, and 11 Mb of complex structural changes (Figures 1C-D; supplemental Table 9). Patients with LBC showed an average of 74 Mb gain and 67 Mb loss, whereas MBC showed 30 Mb gain and 33 Mb loss. Overall, more genes were affected by SCNAs than nonsilent SNVs/indels during BC transformation (median = 5 for nonsilent SNVs/indels [range, 0-12]; median = 182.5 for SCNAs [range, 1-4744]; supplemental Tables 5A and 9). This is in agreement with the notion that BCR-ABL1 alters DNA double strand repair.30,31 IKZF1 was the non-immunoglobulin-related gene that was most frequently affected by deletions during progression (7 of 13, >50%; Figure 1A; supplemental Table 9) as previously reported.3,4 Using GISTIC analysis,32 we searched for genomic regions that showed significant copy number alterations and identified recurrent deletions on chromosomes 7 (containing TARP among others), 9 (CDKN2A/B), and 14 (FAM30A, also known as KIAA0125; Figure 1A,D; supplemental Table 10) supporting earlier reports.4,33 Of note, the TARP and KIAA0125 loci were affected by immunoglobulin rearrangements, whereas rearrangements or deletions in immunoglobulin genes per se were observed in 7 of 9 paired LBC samples, but in none of the MBC samples. We noticed that PRC genes were affected by SCNAs in a number of CP to BC progressions and formally tested for enrichment of BC-specific genomic alterations (SCNAs, SNVs, and indels) in cancer-related and epigenetic pathways (supplemental Table 11).20,34-42 Interestingly, we found the hematopoietic stem cell (HSC; including KIAA0125 as a potential passenger event) signature and PRC genes to be significantly enriched for genomic alterations, mainly SCNAs, acquired from CP to BC (1.4-fold enrichment [P = .009] and 1.47-fold enrichment [P = .042], binomial test Benjamini-Hochberg corrected, respectively; Figure 1E). Next, we expanded our analysis by whole-exome sequencing (WES) of 37 additional BC (23 MBC and 14 LBC) and 2 accelerated phase samples and found that PRC genes were still significantly enriched (Figure 1F). Combining the BC-specific genome alterations of the paired samples with the (unpaired) validation set, we observed additional genes as recurrently altered including CDKN2A/B, PAX5, and EZH2 (supplemental Tables 12 and 13), which have documented roles as leukemia-initiating genes.4,24,43-50 We also confirmed the enrichment of genomic alterations in HSC and PRC genes, underscoring the relevance of these alterations for CML (combined P values 5.4 × 10⁻³ for HSC and <1 × 10⁻¹⁰ for PRC, using Fisher’s approach; supplemental Table 14).
Taken together, the mutation load of the CML progression genome is moderate, with SCNAs playing a more important role than somatic SNVs, and indels and point mutations showing a CML-specific mutation signature. In addition to changes in previously described candidate genes, genomic alterations are enriched in HSC and PRC genes.
Genetically heterogeneous BC progenitors converge on stem cell- and PRC-related transcriptional signatures
We next characterized the transcriptional changes associated with transformation by comparing the gene expression signatures of CP as well as MBC and LBC CD34+ cells, as defined by standard immunophenotyping.51 We found that, despite being genetically heterogeneous for mutations in established leukemia tumor suppressor genes and oncogenes, both MBC and LBC transcriptomes were highly congruent, sharing a core set of 431 and 522 concordant significantly upregulated and downregulated genes, respectively when compared with CP, with less than 2% of gene expression changes in opposite directions (Figure 2A; supplemental Figure 4A; supplemental Tables 15 and 16). We also compared the LBC and MBC transcriptomes directly and confirmed that the MBC and LBC transcriptomes were enriched for gene signatures found in their normal (eg, lymphoid progenitors and B cells) as well as malignant myeloid and lymphoid counterparts, respectively (supplemental Figure 5A). We then used the MsigDB hallmark gene sets52 to identify the major biological states and processes present within the BC transcriptome, as well as identify significant differences. We found that both MBC and LBC were enriched for inflammatory pathways, including interleukin 2, JAK-STAT, NF-κB, and transforming growth factor β signaling, and were also depleted of the cell cycle and proliferation genes (MBC, Figure 2B; LBC, supplemental Figure 6A). We note that the combination of inflammatory signatures coupled with quiescence is reminiscent of a recently described TKI-resistant CP LSC population.53 Regarding differences, we found that the MBC transcriptome was enriched for metabolism-associated pathways (eg, mTORC1 signaling, fatty acid metabolism, and bile acid metabolism) when compared with LBC (supplemental Figure 5B). Increased mTORC1 signaling is an established feature of BC,54 and our data suggest that this pathway and other metabolic processes are differentially activated in MBC compared with LBC.
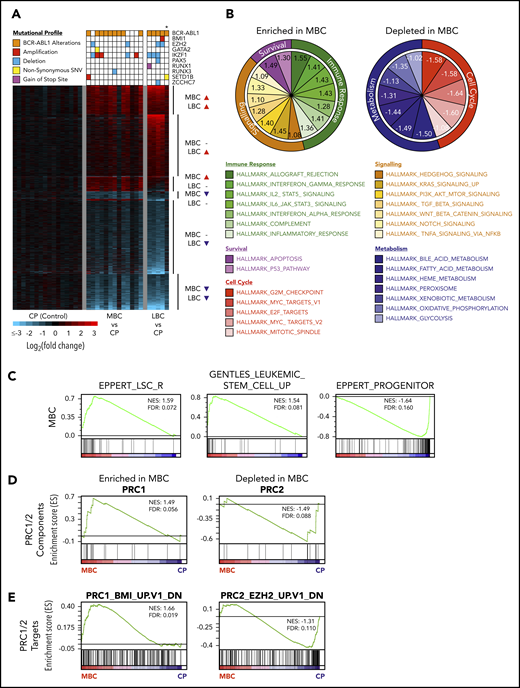
CD34+ BC progenitors exhibit transcriptional convergence. (A) Heat map of statistically significant (Log2 fold-change > 0.58 or < −0.58 and adjusted P < .05) gene expression differences between CD34+ MBC (n = 13), LBC (n = 5), and CP (n = 16) progenitors. Mutational profiles of the commonest recurring gene mutations are depicted for each transcriptome. All ABL1 mutations are in the 3′ part of the gene belonging to BCR-ABL1. *Biphenotypic BC sample with myeloid and lymphoid immunophenotype (“Methods”). (B) Enriched and depleted MSigDB v6.1 hallmark gene sets within the MBC gene expression networks. (C) GSEA-based network analysis for LSC gene set signatures within MBC transcriptomes. (D-E) PRC1 and PRC2 pathway gene set signatures within MBC by GSEA.
CD34+ BC progenitors exhibit transcriptional convergence. (A) Heat map of statistically significant (Log2 fold-change > 0.58 or < −0.58 and adjusted P < .05) gene expression differences between CD34+ MBC (n = 13), LBC (n = 5), and CP (n = 16) progenitors. Mutational profiles of the commonest recurring gene mutations are depicted for each transcriptome. All ABL1 mutations are in the 3′ part of the gene belonging to BCR-ABL1. *Biphenotypic BC sample with myeloid and lymphoid immunophenotype (“Methods”). (B) Enriched and depleted MSigDB v6.1 hallmark gene sets within the MBC gene expression networks. (C) GSEA-based network analysis for LSC gene set signatures within MBC transcriptomes. (D-E) PRC1 and PRC2 pathway gene set signatures within MBC by GSEA.
Next, we examined the transcriptomes for evidence of LSC or HSC signatures. Consistent with current understanding,3 both MBC and LBC populations were enriched for LSC and HSC transcriptional programs, as defined by 3 independent data sets,37,55,56 whereas in contrast, CP CD34+ cells resembled progenitor populations that are devoid of self-renewal capacity (MBC, Figure 2C; LBC, supplemental Figure 6B). Because the enrichment of LSC/HSC signatures at the transcriptomic level mirrored the genomic enrichment of HSC-related genes (Figure 1E), we determined whether our transcriptomic data set was also enriched for alterations in the PRC pathway we observed genetically (Figures 1E-F; supplemental Tables 11 and 14). Using gene set enrichment analysis (GSEA), we found an enrichment and depletion of genes that comprise the canonical PRC1 and PRC2 complexes, respectively (MBC, Figure 2D; LBC, supplemental Figure 6C). Gain- and loss-of-function events affecting PRC1 and PRC2, respectively, are known to individually contribute to myeloid leukemias,16-18,57-59 and our findings suggest that both types of events occur simultaneously during BC transformation. Importantly, using MSigDB gene sets for biologically validated BMI1 and EZH2 targets, we found that PRC1 (BMI1) and PRC2 (EZH2) target genes were enriched and depleted for, respectively, in MBC and LBC transcriptomes (MBC, Figure 2E; LBC, supplemental Figure 6D).
Taken together, our integrated analyses of the BC progression genomes and transcriptomes revealed that stem cell- and PRC-related expression signatures are remarkably consistent across samples bearing a variety of leukemia-associated genetic events.
A BC-specific methylome is enriched for PRC targets and regulates differentiation
Although DNA hypermethylation is an established hallmark of BC, the failure of DNA methyltransferase inhibitors (DNMTi) to produce durable responses in patients with BC prompted us to reassess the contribution of methylation-altered genes to BC reprogramming.13,60-65 We first confirmed prior work indicating that MBC and LBC transitions consisted mainly of hypermethylation events (87% and 80% of differential probes in MBC and LBC, respectively), and that hypermethylation occurred in promoter regions rather than gene bodies (52% vs 45% respectively, for MBC; 60% vs 38%, respectively, for LBC supplemental Figure 7A). In addition, we found that the normal bone marrow transition to CP is already marked by alterations in DNA methylation and includes a pan-CML signature that persists through BC transformation and is characterized primarily by hypomethylation (Figure 3A). Importantly, and as for the BC transcriptome (Figure 2A), the BC DNA methylation signature appears indifferent to underlying leukemia-associated gene mutations (Figure 3A). Next, to assess the contribution of methylation-altered genes to BC, we integrated our methylation and gene expression data sets. We found the majority of BC gene expression changes to be associated with hypermethylation instead of hypomethylation (MBC, Figure 3B; LBC, supplemental Figure 6E; supplemental Table 17). Furthermore, decreased gene expression was more commonly associated with hypermethylation events in the promoter, in contrast to genes with increased expression (supplemental Figure 7B), and is consistent with prior observations.66-68
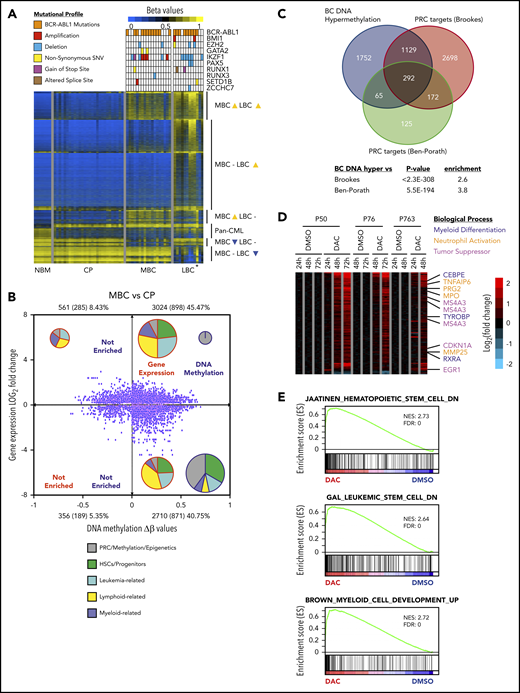
The BC methylome is enriched for PRC targets and regulates differentiation. (A) DNA methylation heat map of NBM (n = 7), CP (n = 28), MBC (n = 18), and LBC (n = 12) β values. Mutational profiles of the commonest recurring gene mutations are depicted for each methylome. *Biphenotypic BC sample with myeloid and lymphoid immunophenotype (“Methods”). (B) Starburst plot depicting the relationship between gene expression and DNA methylation (adjusted P < .05 for both). Numbers indicate probes with number of genes in parentheses. Percentages indicate proportion of probes out of the total. The number of samples used are 28 for CP and 18 for MBC. Pie charts show relative proportions of MSigDB v6.1 gene set functions enriched in each quadrant for gene expression and DNA methylation, whereas pie chart size indicate the relative number of gene sets (not to scale). (C) Genes that are hypermethylated at BC significantly overlapped with genes that are bound by PRC from 2 published data sets.35,36 (D) Heat map showing gene expression changes for DAC compared with dimethyl sulfoxide treatments (adjusted P value < .05 and gene expression Log2 fold-change >0.58 or <−0.58) in 3 primary BC patient samples. (E) Preranked GSEA analysis of the expression profile of DAC-treated primary BC cells that is depleted for HSC and LSC signature but enriched for myeloid differentiation genes.
The BC methylome is enriched for PRC targets and regulates differentiation. (A) DNA methylation heat map of NBM (n = 7), CP (n = 28), MBC (n = 18), and LBC (n = 12) β values. Mutational profiles of the commonest recurring gene mutations are depicted for each methylome. *Biphenotypic BC sample with myeloid and lymphoid immunophenotype (“Methods”). (B) Starburst plot depicting the relationship between gene expression and DNA methylation (adjusted P < .05 for both). Numbers indicate probes with number of genes in parentheses. Percentages indicate proportion of probes out of the total. The number of samples used are 28 for CP and 18 for MBC. Pie charts show relative proportions of MSigDB v6.1 gene set functions enriched in each quadrant for gene expression and DNA methylation, whereas pie chart size indicate the relative number of gene sets (not to scale). (C) Genes that are hypermethylated at BC significantly overlapped with genes that are bound by PRC from 2 published data sets.35,36 (D) Heat map showing gene expression changes for DAC compared with dimethyl sulfoxide treatments (adjusted P value < .05 and gene expression Log2 fold-change >0.58 or <−0.58) in 3 primary BC patient samples. (E) Preranked GSEA analysis of the expression profile of DAC-treated primary BC cells that is depleted for HSC and LSC signature but enriched for myeloid differentiation genes.
We then used GSEA to determine whether hypermethylated expression-altered genes were enriched for a priori defined cellular processes, and found an enrichment for gene sets involved in stem cell fate, myeloid and lymphoid function, and leukemia-related signatures (MBC, Figure 3B; LBC, supplemental Figure 6E; supplemental Table 18). Interestingly, we noted DNA methylated genes were significantly enriched for PRC-related processes, including genes that are established PRC targets (MBC, Figure 3B; LBC, supplemental Figure 6E; supplemental Table 18), and confirmed this association with 2 independent data sets (Figure 3C).35,36 These findings suggest that PRC binding is instructional for genes destined for hypermethylation in BC, a finding we investigate here.
To better understand the limited efficacy of DNMTis in BC, we determined the gene expression changes associated with pharmacological reversal of DNA hypermethylation. Despite the efficacy of low-dose 5-aza-2'-deoxycytidine (DAC)69 in demethylating 9083 genes within the BC methylome (supplemental Figure 7C-D; supplemental Tables 19-21), only 97 (1.07%) genes were significantly upregulated after 3 days of DAC treatment (adjusted P < .05, cutoff: log2 fold-change of ≥0.58). Prominent genes upregulated from days 1 to 3 include those involved in neutrophil function (MPO, PRG2, TNFAIP6, MMP25), myeloid differentiation (CEBPE, RXRA, TYROBP), and leukocyte activation, as well as myeloid tumor suppressor activity (EGR1, MS4A3, CDKN1A/p21; Figure 3D; supplemental Table 19).70-76 In addition, GSEA indicated that DAC treatment resulted in depletion of established HSC and LSC genes but enriched for myeloid differentiation genes (Figure 3E). We conclude that although DNA methylation is associated with many of the gene expression changes associated with BC reprogramming, the inability of DNMTis to reverse the majority of DNA methylation-associated gene expression changes, even under optimized in vitro conditions, suggests additional layers of epigenetic regulation in BC reprogramming.
Differential contribution of BMI1 and EZH2 to BC
Because our analyses of orthogonal data sets (Figures 1E-F, 2D-E, and 3B; supplemental Figure 6C-E) indicate that PRC1 and PRC2 alterations are recurring features of BC, we investigated whether PRC1 and PRC2 directly contribute to BC transformation. We performed ChIP followed by high-throughput sequencing (ChIP-seq) on CD34+ CP and BC samples for EZH2 and BMI1 binding. We found that both BMI1 and EZH2 are bound to common genomic regions (Figure 4A), and that their binding occurs primarily near transcription start sites (Figure 4B; supplemental Figure 8A). Consistent with other studies,20,77 we also found that 80% of EZH2-bound genes were co-occupied by BMI1, and conversely, the majority of BMI1 binding occurs independently of EZH2 (6347/9676, or 66%; Figure 4C; supplemental Table 22). Gene ontology (GO) analysis revealed that genes bound by BMI1 and EZH2 had distinct as well as overlapping functions, including cell development and differentiation, inflammation, proliferation, leukocyte function, and apoptosis (Figure 4C; supplemental Tables 23-25).
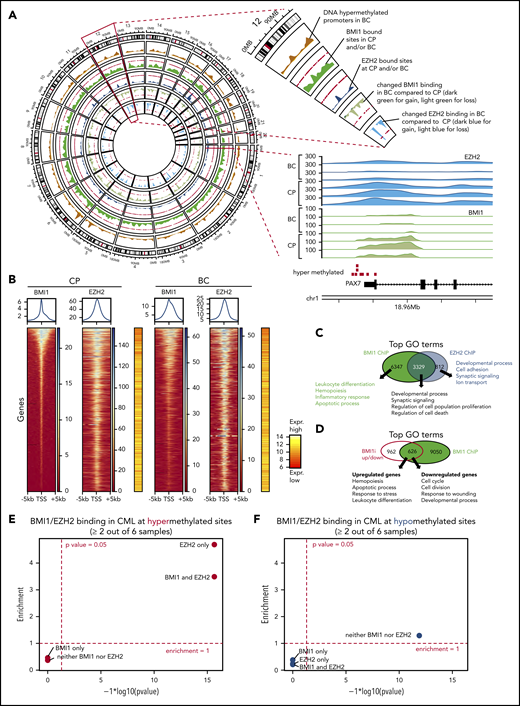
Differential contribution of BMI1 and EZH2 to BC reprogramming. (A) Circos plot displays genome-wide regions bound by BMI1 and EZH2 by ChIP-seq and BC-specific DNA methylation regions. Chromosome 12 is enlarged to illustrate individual tracks. Each track shows the regional accumulation of the respective signals. Of note, in the lowest 2 tracks (changes in BMI1/EZH2 binding), the weaker binding (light color) dominates. Bottom right shows the BMI1 and EZH2 ChIP-seq tracks at a gene locus on chromosome 1, illustrating the consistent binding at a hypermethylated site and weaker binding in BC. (B) ChIP-seq heat maps displaying binding densities of BMI1 and EZH2 at transcription start sites (TSS). TSS of all plots are arranged in the same order defined by BMI1 densities in CP. Data of 1 representative patient out of 3 patients with CP and 3 patients with BC, respectively, is shown. Plots of all samples can be found in supplemental Figure 8A. Averaged binding profiles are plotted on top. Average expression levels of respective genes are shown in red/yellow heat maps (16 patients with CP vs 15 patients with BC from Figure 2). (C) Top GO terms for BMI1- and EZH2-bound genes in CML. (D) Top GO terms for genes that are bound by BMI1 and differentially expressed (FDR < 0.05; Log2FC > 0.58 or <−0.58) after treatment with BMI1 inhibitor (BMI1i) PTC209 of CD34+ BC cells. (E-F) Enrichment analysis of BMI1 and EZH2 binding sites, each based on 3 CP and 3 BC samples, for DNA hypermethylated (red, E) or hypomethylated (blue, F) loci (as defined by 28 patients with CP vs 30 patients with BC in Figure 3A). Fold-enrichment for overlap is shown on the y-axis; negative logarithmic P values for enrichment are shown on the x-axis.
Differential contribution of BMI1 and EZH2 to BC reprogramming. (A) Circos plot displays genome-wide regions bound by BMI1 and EZH2 by ChIP-seq and BC-specific DNA methylation regions. Chromosome 12 is enlarged to illustrate individual tracks. Each track shows the regional accumulation of the respective signals. Of note, in the lowest 2 tracks (changes in BMI1/EZH2 binding), the weaker binding (light color) dominates. Bottom right shows the BMI1 and EZH2 ChIP-seq tracks at a gene locus on chromosome 1, illustrating the consistent binding at a hypermethylated site and weaker binding in BC. (B) ChIP-seq heat maps displaying binding densities of BMI1 and EZH2 at transcription start sites (TSS). TSS of all plots are arranged in the same order defined by BMI1 densities in CP. Data of 1 representative patient out of 3 patients with CP and 3 patients with BC, respectively, is shown. Plots of all samples can be found in supplemental Figure 8A. Averaged binding profiles are plotted on top. Average expression levels of respective genes are shown in red/yellow heat maps (16 patients with CP vs 15 patients with BC from Figure 2). (C) Top GO terms for BMI1- and EZH2-bound genes in CML. (D) Top GO terms for genes that are bound by BMI1 and differentially expressed (FDR < 0.05; Log2FC > 0.58 or <−0.58) after treatment with BMI1 inhibitor (BMI1i) PTC209 of CD34+ BC cells. (E-F) Enrichment analysis of BMI1 and EZH2 binding sites, each based on 3 CP and 3 BC samples, for DNA hypermethylated (red, E) or hypomethylated (blue, F) loci (as defined by 28 patients with CP vs 30 patients with BC in Figure 3A). Fold-enrichment for overlap is shown on the y-axis; negative logarithmic P values for enrichment are shown on the x-axis.
To specifically identify the subset of BC genes that are maintained by continued BMI1 and EZH2 activity, we treated primary CD34+ BC cells with the BMI1 and EZH2 inhibitors (PTC20978 and GSK126,79 respectively), using concentrations validated for on-target effects in CML cell lines (Figures 5A-C; supplemental Figure 12C-D), and identified BMI1- and EZH2-bound genes whose expression was altered by drug treatment. Strikingly, PTC209 treatment induced expression changes of 626 BMI1-bound genes compared with only 19 EZH2-bound genes after GSK126 treatment (Figure 4D; supplemental Figure 9A; supplemental Tables 26 and 27). The BMI1-bound genes that responded to PTC209 were significantly enriched for leukocyte differentiation, apoptosis, and cell proliferation processes, suggesting important functional contributions to BC reprogramming (Figure 4D; supplemental Tables 28 and 29). Importantly, and in agreement with prior reports,80-83 PTC209-induced differentially expressed genes were enriched for expression signatures found in BMI1-deficient cells, as well as other PTC209-treated cells (supplemental Figure 9B). Because BMI1’s contribution to cancer occurs in part via suppressing tumor suppressor genes,20 we focused on the subset of BMI1-bound genes that are both downregulated in BC and upregulated by PTC209 treatment (supplemental Figure 9C-D; supplemental Tables 30 and 31). Interestingly, genes fulfilling these criteria were involved in immune and inflammatory responses, cell death, and cellular stress (supplemental Figure 10A; supplemental Tables 31 and 32), a subset of which we tested for tumor suppressive function (Figure 6).
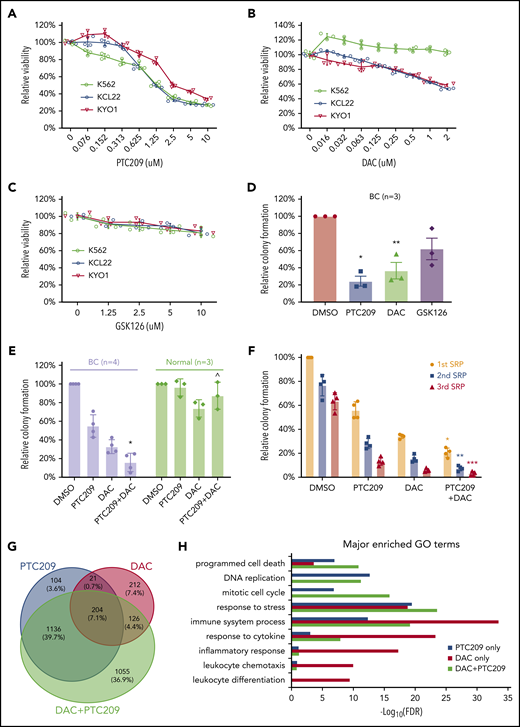
PRC1 and DNA methylation contributes to BC by promoting cell survival and proliferation. MTS assays of 3 CML cell lines that were incubated (3 days) with (A) PTC209, (B) decitabine (DAC), (C) GSK126. Results shown as mean ± standard deviation (n = 3). (D) CFAs showing the effect of PTC209 (2.5 μM), DAC (200 nM), and GSK126 (2.5 μM) on BC CD34+ cells. *P = .006; **P = .023. (E) CFAs showing combination effect of PTC209 and DAC on primary BC and normal CD34+ cells. *P = .0018; ^P = .14. (F) Three rounds of serial replating (SRP) assays were performed with primary CD34+ BC cells. Relative colony formation is a percentage of the number of colonies in each sample relative to that in the first SRP DMSO control. *P = .0003 (1st SRP); **P = .0001 (2nd SRP); ***P = .0026 (3rd SRP). (G) Overlap of differentially expressed genes (log2FC > 0.58 or log2FC < −0.58; FDR < 0.05) induced by PTC209 and DAC (either single or combined). (H) Top GO terms for differentially regulated genes after drug treatment.
PRC1 and DNA methylation contributes to BC by promoting cell survival and proliferation. MTS assays of 3 CML cell lines that were incubated (3 days) with (A) PTC209, (B) decitabine (DAC), (C) GSK126. Results shown as mean ± standard deviation (n = 3). (D) CFAs showing the effect of PTC209 (2.5 μM), DAC (200 nM), and GSK126 (2.5 μM) on BC CD34+ cells. *P = .006; **P = .023. (E) CFAs showing combination effect of PTC209 and DAC on primary BC and normal CD34+ cells. *P = .0018; ^P = .14. (F) Three rounds of serial replating (SRP) assays were performed with primary CD34+ BC cells. Relative colony formation is a percentage of the number of colonies in each sample relative to that in the first SRP DMSO control. *P = .0003 (1st SRP); **P = .0001 (2nd SRP); ***P = .0026 (3rd SRP). (G) Overlap of differentially expressed genes (log2FC > 0.58 or log2FC < −0.58; FDR < 0.05) induced by PTC209 and DAC (either single or combined). (H) Top GO terms for differentially regulated genes after drug treatment.
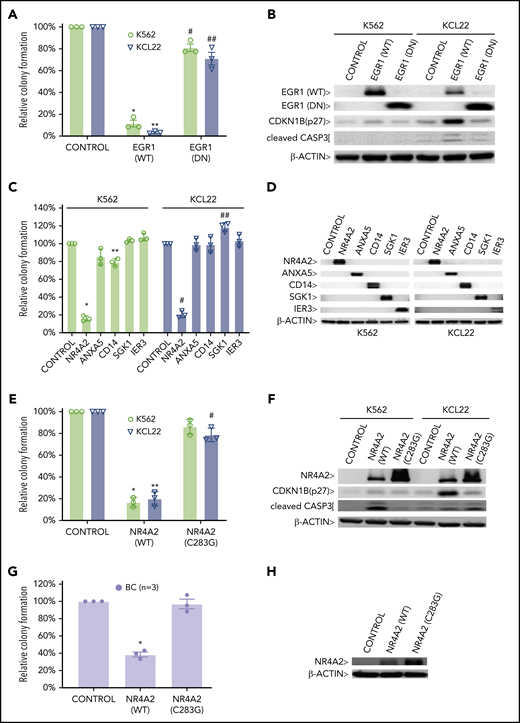
PRC1 contributes to BC by inhibiting expression of BC tumor suppressors. CFAs of K562 and KCL22 cells retrovirally transduced with (A) EGR1, either wild-type (WT) or dominant negative (DN) or (C) the indicated cDNAs are shown. (A) *P = .001; **P = .00004; #P = .03; ##P = .04. (C) *P = .000001; **P = .0011; #P = .000003; ##P = .003. CFAs of K562, KCL22 (E), and primary BC cells (G) retrovirally transduced with FLAG-NR4A2, either wild-type (WT) or (C283G) mutant are shown. (E) *P = .0009; **P = .0022; #P = .027. (G) *P = .0021. For panels A, C, E, and G, results are given as mean ± standard deviation (n = 3). For each CFA plot, the corresponding immunoblots are shown on the right (B,D,F,H). Control, cells retrovirally transduced with empty vector.
PRC1 contributes to BC by inhibiting expression of BC tumor suppressors. CFAs of K562 and KCL22 cells retrovirally transduced with (A) EGR1, either wild-type (WT) or dominant negative (DN) or (C) the indicated cDNAs are shown. (A) *P = .001; **P = .00004; #P = .03; ##P = .04. (C) *P = .000001; **P = .0011; #P = .000003; ##P = .003. CFAs of K562, KCL22 (E), and primary BC cells (G) retrovirally transduced with FLAG-NR4A2, either wild-type (WT) or (C283G) mutant are shown. (E) *P = .0009; **P = .0022; #P = .027. (G) *P = .0021. For panels A, C, E, and G, results are given as mean ± standard deviation (n = 3). For each CFA plot, the corresponding immunoblots are shown on the right (B,D,F,H). Control, cells retrovirally transduced with empty vector.
Having uncovered an association between PRC targets and BC hypermethylated genes (Figure 3B-C), and because polycomb-repressed genes regulate self-renewal and lineage commitment,84-87 we tested whether PRC binding in CP is instructional for promoter DNA hypermethylation in BC. We observed significant enrichment of promoters bound by EZH2 alone (4.7-fold; P < 10−16), as well as those bound by EZH2 + BMI1 (3.5-fold; P < 10−16), at sites of DNA hypermethylation in BC, but not for BMI1-alone bound promoters (Figure 4E). In contrast, BMI1 and/or EZH2 bound promoters are not significantly enriched for DNA hypomethylation (Figure 4F). To gain insight into the dynamics of EZH2-directed DNA hypermethylation during disease progression, we investigated EZH2-bound promoters with differential binding in CP and BC. Strikingly, we found that 239 BC hypermethylated promoters showed stronger EZH2 binding in CP compared with BC, but not vice versa (supplemental Figure 10B; supplemental Table 22). Similarly, 629 promoters showed stronger binding of BMI1 in CP and only 30 promoters in BC (supplemental Figure 10C; supplemental Table 22). Conspicuously, the sites where EZH2 and/or BMI1 binding was reduced in BC compared with CP were even more strongly enriched for DNA-hypermethylation in BC (8.8-fold for EZH2, 9.1-fold for EZH2 + BMI1, and 5.5-fold for BMI1) at high levels of significance (P < 10−16; supplemental Figure 8C). These results are in agreement with reported decreased binding of EZH2 occurring at sites that have become DNA hypermethylated.88 To further explore the relationship between histone marks and DNA hypermethylation, we performed ChIP-seq experiments for the repressive mark histone 3 lysine 27 tri-methylation (H3K27me3) that is established by PRC2 catalytic activity and is recognized by DNMTs, and for H3K4me3, an activation mark. We observed a strong enrichment for H3K27me3 and depletion for H3K4me3 at DNA-hypermethylation sites, supporting the canonical model of PRC function, and that bivalent genes, marked by both H3K27me3 and H3K4me3, are also significantly enriched for DNA-hypermethylated sites (supplemental Figure 11A-B; supplemental Table 22).89,90
In summary, our results indicate that both EZH2 and BMI1 contribute to reprogramming of the BC transcriptome, but do so in distinct ways: EZH2 plays a greater role than BMI1 in specifying genes for subsequent DNA methylation-mediated silencing in BC, whereas BMI1 plays a greater role in maintaining the BC transcriptome, in particular regulating processes involved in differentiation and cell survival (Figure 4D; supplemental Figure 10A). We next tested a BC model (Figure 7C) based on these findings by evaluating the effect of inhibiting DNA methylation and PRC activity in BC reprogramming and function, determining whether PRC-silenced genes encompass novel BC tumor suppressors, and assessing whether validated gene sets predictive of poor outcome in CP progenitors are enriched for targets of PRC and/or DNA methylation.
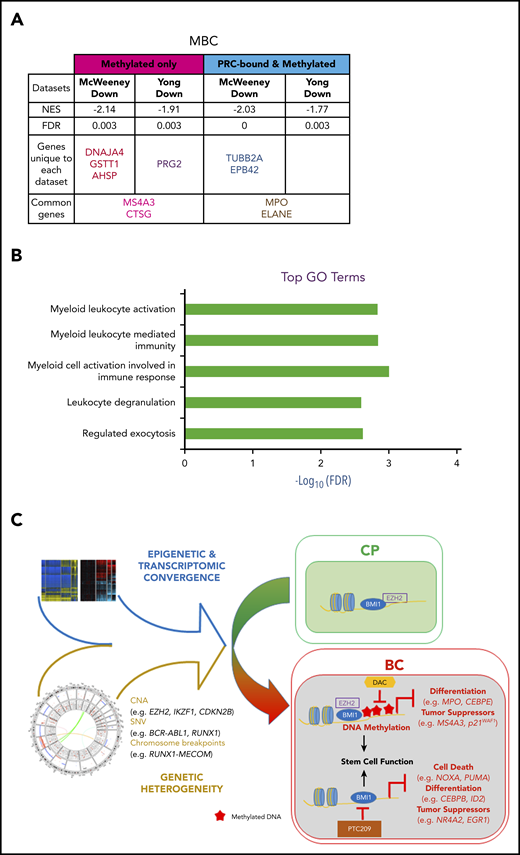
DNA methylation- and PRC-silenced genes in BC predict poor outcome in patients with CP. Table summarizing preranked GSEA results for MBC vs CP (A). Normalized enrichment score (NES), FDR, as well as the identity of the genes that drive the enrichment are provided (for details, see “Methods”; supplemental Tables 39-41). A negative NES value denotes that genes downregulated from CP to BC in our samples are enriched for the indicated data sets. (B) Top GO terms, with FDR scores, for genes in panel A. (C) CP to BC progression model that illustrates that, despite genetic heterogeneity, there is a convergence in progression-specific transcriptomes and methylomes that are driven by BMI1 and EZH2. Specifically, EZH2 directs BC-specific DNA hypermethylation that inhibits cell differentiation and tumor suppressor programs, whereas BMI1 also inhibits cell death.
DNA methylation- and PRC-silenced genes in BC predict poor outcome in patients with CP. Table summarizing preranked GSEA results for MBC vs CP (A). Normalized enrichment score (NES), FDR, as well as the identity of the genes that drive the enrichment are provided (for details, see “Methods”; supplemental Tables 39-41). A negative NES value denotes that genes downregulated from CP to BC in our samples are enriched for the indicated data sets. (B) Top GO terms, with FDR scores, for genes in panel A. (C) CP to BC progression model that illustrates that, despite genetic heterogeneity, there is a convergence in progression-specific transcriptomes and methylomes that are driven by BMI1 and EZH2. Specifically, EZH2 directs BC-specific DNA hypermethylation that inhibits cell differentiation and tumor suppressor programs, whereas BMI1 also inhibits cell death.
Combined targeting of DNA methylation and BMI1 activity in BC cells
Our analyses indicated important roles for DNA methylation and BMI1 in maintaining the BC transcriptome, including altering the function of genes involved in differentiation, proliferation, and cell survival (Figure 3-4). Accordingly, we tested DNMT, BMI1, and EZH2 inhibitors (DAC, PTC209, and GSK126, respectively) against a panel of 3 CML BC cell lines. We found that PTC209 and DAC, but not GSK126, decreased the viability of most BC cell lines in a dose-dependent manner (Figure 5A-C). Primary BC CD34+ cells exhibited similar responses, in that PTC209 and DAC resulted in fewer progenitor colonies than GSK126 (Figure 5D). We note that the sensitivity of BC cell lines and primary BC cells to BMI1 inhibitors, but not EZH2 inhibitors, is consistent with our genomic and transcriptomic analyses (Figure 2D-E; supplemental Figure 6C-D), where recurrent gain-of-function events affecting PRC1 suggest a pro-tumorigenic role for BMI1, whereas recurrent loss-of-function events affecting PRC2 suggest the opposite for EZH2.
We then compared the combination of DAC and PTC209 treatment in both primary BC CD34+ and CD34+ normal bone marrow (NBM) cells. We found that both DAC and PTC209 had single-agent activity against BC, and that the combination significantly reduced BC colony formation by 90% (P = .0018), whereas NBM colonies were not significantly affected (P = .14; Figure 5E). Next, we used the serial replating assay to examine whether the drugs were able to extinguish the BC self-renewal function, a cardinal feature of BC cells.10,91 We found that each drug was effective in decreasing serial replating efficiency, and the combination was more effective than either agent alone (Figure 5F). To understand how DAC and PTC209 are able to reduce BC cell viabilities, we performed GO analysis on the transcriptomic changes in BC cells after drug treatment. In upregulated genes, we found that PTC209 and DAC induced overlapping and related processes, including programmed cell death, immune function, cellular stress, and cytokine responses (Figure 5H; supplemental Tables 36-38). In downregulated genes, PTC209 alone inhibited genes involved in cell cycle and DNA replication (Figure 5H; supplemental Table 37). Importantly, we found that the combination resulted in gene expression changes for an additional 1,055 genes compared with either PTC209 or DAC alone, including those involved in programmed cell death, immune function, cellular stress, and cytokine responses (Figure 5G-H).
Finally, to identify putative BMI1-silenced BC tumor suppressor genes, we reexpressed a panel of BMI1-bound genes that were repressed in BC but upregulated by PTC209 exposure in primary CD34+ BC cells (supplemental Figure 10A). Among these, we confirmed the growth-inhibiting properties of a previously described BC tumor suppressor gene, EGR192,93 (Figure 6A-B). Among 5 novel candidate genes, we found that NR4A2, a nuclear receptor transcription factor with no known role in leukemia,94 was able to inhibit colony formation in BC cell lines (Figure 6C-D). Importantly, an inactive point mutant form of NR4A2 (NR4A2-C283G) incapable of DNA binding and gene transactivation,95 was unable to suppress BC cell line growth (Figure 6E-F). We confirmed the tumor suppressor function of NR4A2 in primary BC CD34+ cells and found that overexpression of only wild-type NR4A2 was effective in inhibiting BC colony formation (Figure 6G-H). Together, our data support critical roles both for DNA methylation, directed by PRC2, in permanently silenced genes involved in differentiation, and for PRC1 actively maintaining repression of additional genes that regulate apoptosis, cell cycle progression, and inflammatory responses.
DNA methylation- and PRC-silenced genes in BC predict poor outcome in CP patients
It is possible to identify patients with CP who are destined to develop TKI resistance and BC progression by gene expression changes in CD34+ cells at the time of presentation.96,97 We reasoned that PRC-directed gene silencing might already be at play in progenitors from poor-prognosis patients with CP, thereby inducing a TKI-resistant state poised for transformation. Using our data sets, we examined whether genes predicting TKI resistance96 and either early (<3 years from CP diagnosis) or late (≥7 years) BC transformation97 were enriched for methylation and PRC binding. We interrogated the McWeeney and Yong data sets by first categorizing our BC gene sets according to their methylation status (hyper-/hypomethylated) and PRC state (PRC-/non–PRC-bound). Genes in each category were then analyzed with GSEA to determine whether they were enriched for prognostic genes. We found that only hypermethylated and downregulated genes were enriched (false discovery rate [FDR] < 0.05), including genes that were bound by PRC and were common to both data sets (MBC, Figure 7A; LBC, supplemental Figure 13A; supplemental Tables 39-41). GO analysis of these genes revealed pathways that are associated with myeloid and leukocyte-mediated immune activation and degranulation (MBC, Figure 7B; LBC, supplemental Figure 13B), suggesting that, in poor prognosis CP samples, processes associated with PRC-binding and DNA methylation silence the expression of genes regulating lineage specification.
Discussion
We have developed a clinically informative molecular model of BC progression by integrating multiomics data sets from primary patient material (Figure 7C). In doing so, we determine that leukemia stem cell and PRC-related gene expression signatures are prevalent features of the BC transcriptome that transcend genetics (Figures 2A and 3A). Our findings are indicative of strong selective pressures for the emergence of TKI-resistant clones with perturbations in PRC-related pathways (Figures 1E, 2D-E, 3B-C, 4, 5, and 6). Furthermore, given that BC progenitors possess a long tail of diverse leukemia-initiating genes,4,11,12 our integrated data suggest that genetic contributors of transformation may be decoupled from PRC-driven maintenance programs in BC. Because we find combined PRC1 and DNMT inhibitors functionally dismantle these programs, it may be possible to treat the majority of patients with BC with this combination regardless of their underlying genetic events.
Although our data describe specific genetic alterations that may contribute to the gain- and loss-of-function of PRC1 and PRC2, respectively (Figure 1E-F), it is likely that additional mechanisms contribute to changes in PRC1/2 activity, as highlighted by recent reviews.23,98 Here, it is interesting to note that investigators employing an inducible mouse model of CML found that BCR-ABL1 per se can induce changes in DNA hypermethylation.99 It is therefore tempting to speculate that prolonged, unopposed BCR-ABL1 activity leads to epigenetic reprogramming of BC progenitors, and that this proceeds via as-yet-undiscovered connections between BCR-ABL1 and mediators of PRC activity. Relatedly, it would be important to determine whether PRC-driven reprogramming contributes to TKI resistance itself. This is difficult to investigate in BC, as the majority of BC samples harbor TKI resistance-conferring mutations in BCR-ABL1. However, it may be possible to address this issue in CP, where kinase domain mutations are rare, even among those who develop clinical TKI resistance. In these patients, it may be possible with single cell-based analyses to determine whether PRC-driven reprogramming occurs in clonal populations that emerge during or before the development of full-blown clinical TKI resistance.
Our work also highlights differential contributions of PRC1 and PRC2 to transformation at different stages. EZH2, the central component of PRC2, is known to regulate reprogramming of CP LSCs.14,15 We delineate EZH2’s association with genes that eventually undergo DNA methylation from CP to BC, suggesting a role in specifying sites for methylation. This process of epigenetic switching was proposed a decade ago, in which poised PRC-bound genes are methylated in cancers, thereby inducing a more permanent state of self-renewal.85-87,100 Supporting the hypothesis that persistent PRC2/EZH2 binding predisposes normal cells to transformation, we also demonstrated that CP prognostic genes were enriched for known PRC-bound and methylation-prone genes in BC. This suggests the possibility of reverting poor prognostic patients to a lower risk category by inducing re-expression of these genes with suitable drugs. Because we observed similar alterations in PRC1 and PRC2 in both MBC and LBC (Figure 2D-E; supplemental Figure 6C-D), it is perhaps not surprising that we found that both MBC and LBC transcriptomes and DNA methylomes were remarkably similar (supplemental Figure 4A; Figure 3A), despite maintaining distinct myeloid and lymphoid expression profiles (supplemental Figure 5). Indeed, as we also observed a high degree of overlap between genes that were prognostic in CP for both MBC and LBC transformation (Figure 7A; supplemental Figure 13A), it is possible that mechanisms mediating MBC and LBC transformation are common to both.
We also determine that ongoing BMI1 activity is important in maintaining the BC transcriptome. In contrast to DAC exposure, BMI1 inhibitors de-repress a large set of genes involved in apoptosis, proliferation, and differentiation, including established (EGR1) and novel (NR4A2) BC tumor suppressor genes. Although NR4A2 is known to restrict proliferation in normal HSCs,101 it has not been reported to play a role in leukemia, although other NR4A family members, NR4A1 and NR4A3, are known myeloid tumor suppressors.102,103 Interestingly, HSCs that are deficient in NR4A1 and NR4A3 exhibit increased inflammation and aberrant activation of interferon and NF-κB signaling, features we observed in BC transcriptomes (Figure 2B).104 We therefore speculate that BMI1-mediated NR4A2 silencing contributes to the inflammatory features of BC we describe. When combined with DAC, BMI1 inhibitors exert additional specific and potent effects on BC progenitors, including suppression of their self-renewal ability while leaving NBM untouched (Figure 5). Of note, early results of an orally bioavailable BMI1 inhibitor, PTC596,105 suggest that BMI1 inhibitors are clinically tolerable and could be combined with DAC, a drug approved by the US Food and Drug Administration. With regard to the role of BCR-ABL1 in promoting genomic instability via enhancing ROS,3 we saw little evidence for either ROS- or APOBEC-mediated mutational signatures during progression, but instead, found that the mutational load in BC was modest compared with solid tumors and similar to other acute leukemias. The relatively quiet progression genome led us to focus on epigenetic factors in BC transformation. We identified PRC-driven events that could be pharmacologically dismantled to extinguish BC cells and their self-renewal activity (Figure 5), and at the same time, gained mechanistic insights into how prognostic genes in CP are silenced (Figure 7A-B; supplemental Figure 13A-B). Combined, our data suggest a model of BC progression consistent with strong selective pressures for PRC-driven events (Figure 7C) occurring against a background of heterogeneous leukemia-associated mutations.
The WGS, WES, DNA methylation, expression, and ChIP-seq data are provided under the European Genome-phenome Archive, accession number EGAS00001001751. The code for the analysis will be made available on reasonable request to the corresponding authors.
The online version of this article contains a data supplement.
The publication costs of this article were defrayed in part by page charge payment. Therefore, and solely to indicate this fact, this article is hereby marked “advertisement” in accordance with 18 USC section 1734.
Acknowledgments
The authors thank Ming Lai I. Chua, Changyuan G. Chen, and Yen Ling Lee for Illumina sequencing; Chee Seng Chan and Lavanya Veeravalli for first-pass sequencing data processing; Chandana Tennakoon, Peiyong Guan, and Wing Kin Sung for initial copy number analysis of the WGS data; Shivaji Rikka and Giridharan Periyasamy for help on tissue culture work; Vibhor Kumar for help on ChIP-seq data analysis; Willie Yu for advice on mutation signature analysis; and Shyam Prabhakar and Ramanuj DasGupta for useful discussions. The authors are indebted to Deborah White (the South Australian Health and Medical Research Institute) for kindly providing the mesenchymal stromal cell isolation protocol. Finally, the authors are grateful to the patients and physicians at the Department of Haematology, Singapore General Hospital; Department of Hematology-Oncology, Akita University Hospital, Japan; Division of Hematology-Oncology, Department of Medicine, University of Alabama Birmingham; and University of California at Irvine, who contributed patient material.
This study was supported by grants from the National Medical Research Council of Singapore and the Biomedical Research Council of the Agency for Science, Technology and Research, Singapore. Additional support was also provided by the Genome Institute of Singapore internal research funds from the Biomedical Research Council.
Authorship
Contribution: T.K.K., T.N.P., A.M.H. and S.T.O. coordinated the study; T.K.K. performed drug treatments, extracted RNA and DNA from drug-treated samples, performed knockdown/overexpression experiments, performed viability and colony formation assays, performed serial replating assays, performed western blotting, performed LSC correlation with methylation/expression, performed functional annotations of differentially expressed genes from drug-treated samples, performed identification of putative BC tumor suppressor genes for biological validation, and performed analysis of the correlation of DNA methylated and PRC-bound genes with the McWeeney and Yong data sets; A.J. performed WGS and WES data analysis, including MutSigCV, GISTIC, mutation signature analysis, and genomic enrichment statistical tests; conducted downstream ChIP-seq analysis using HOMER and GREAT; initiated, designed, and conducted statistical tests linking DNA methylation and genomic breakpoints to PRC bound genes; analyzed patient transcriptome using limma and DAVID; analyzed transcriptome and methylome of drug-treated samples using limma, DAVID, and IPA; determined the set of PRC-bound genes in BC with the help of X.L., X.T.H., O.V.C., and Q.H.; K.L.L. performed CP/BC transcriptomic and NBM/CP/BC DNA methylation analysis, promoter/gene body analysis, GSEAs, DAC and PTC209 gene expression analyses, starburst plots, pie charts UpSets, and DAVID analysis; T.N.P. coordinated WGS, WES, and methylation studies; performed SNV validation, expression arrays, pathway analysis, and progression gene characterization; examined genomics impact on PRC; and performed ChIP-seq with support from A.J.K., Y.Y.S., C.X.C., A.S.M.T., and J.H.J.T.; X.L. performed CP/BC transcriptomic and CP/BC DNA methylation analysis, promotor/gene body analysis, DAVID and starburst plots, and ChIP-Seq concordance analysis using IDR, peak calling using DFilter, and differential peak calling using DESeq2 under the supervision of A.J.; S.M. performed DNA methylation analysis under the guidance of P.T.; S.X.S. and K.P.N. performed sample preparation, CD34+ sorting, and mesenchymal stem cell culturing; N.T., R.B., W.-J.C., D.A.F., C.C., and S.T.O. contributed clinical samples and information; A.J.K., Y.Y.S., and C.X.C. constructed WGS and WES libraries; Z.E.C. and K.J.X. assisted T.K.K. with knockdown/overexpression experiments and western blotting; O.V.C. plotted ChIP-seq and related expression heat maps; W.Y.M. processed DNA methylation arrays under the guidance of C.C.K.; C.T.J.O. and W.J.W.S. performed Illumina sequencing; T.K.K., A.J., K.L.L., T.N.P., S.M., S.X.S., K.P.N., P.C.N., A.M.H., and S.T.O. interpreted the data; S.T.O. wrote the draft of the manuscript, with contributions from T.K.K., A.J., K.L.L., and A.M.H., which was approved by all authors; and A.M.H. and S.T.O. conceived and directed the study.
Conflict-of-interest disclosure: C.C. reports receiving honorarium from Bristol-Myers Squibb, Novartis, and Korea Otsuka Pharmaceutical and research funding from Bristol-Myers Squibb. The remaining authors declare no competing financial interests.
Correspondence: Asif Javed, School of Biomedical Sciences, The University of Hong Kong, 5 Sassoon Rd, Hong Kong; e-mail: javed@hku.hk; S. Tiong Ong, Cancer & Stem Cell Biology Programme, Duke-NUS Medical School, 8 College Rd, Singapore 169857; e-mail: sintiong.ong@duke-nus.edu.sg; Axel M. Hillmer, Institute of Pathology, University Hospital Cologne, Kerpener Str 62, 50937 Cologne, Germany; e-mail: ahillmer@uni-koeln.de.

This feature is available to Subscribers Only
Sign In or Create an Account Close Modal