

Key Points
A high-throughput screen identified hypomethylating agents as inducers of latency III viral antigens in latency I EBV+ BL.
Induction of latency III antigens in BL sensitizes resistant tumors to T-cell–mediated lysis with EBV-specific cytotoxic T lymphocytes.

Abstract
Despite advances in T-cell immunotherapy against Epstein-Barr virus (EBV)-infected lymphomas that express the full EBV latency III program, a critical barrier has been that most EBV+ lymphomas express the latency I program, in which the single Epstein-Barr nuclear antigen (EBNA1) is produced. EBNA1 is poorly immunogenic, enabling tumors to evade immune responses. Using a high-throughput screen, we identified decitabine as a potent inducer of immunogenic EBV antigens, including LMP1, EBNA2, and EBNA3C. Induction occurs at low doses and persists after removal of decitabine. Decitabine treatment of latency I EBV+ Burkitt lymphoma (BL) sensitized cells to lysis by EBV-specific cytotoxic T cells (EBV-CTLs). In latency I BL xenografts, decitabine followed by EBV-CTLs results in T-cell homing to tumors and inhibition of tumor growth. Collectively, these results identify key epigenetic factors required for latency restriction and highlight a novel therapeutic approach to sensitize EBV+ lymphomas to immunotherapy.
Introduction
The gammaherpesvirus Epstein-Barr virus (EBV) is implicated in a variety of malignancies, including aggressive B-cell lymphomas.1 Three main latency patterns have been described for EBV, which correlate with immune status of the patient and expression of EBV proteins.2 In latency I, the single Epstein-Barr nuclear antigen (EBNA1), EBV-encoded small RNAs, and some microRNAs are expressed. In contrast, latency III tumors express all EBV-encoded latent nuclear antigens (EBNA1, EBNA2, EBNA3A-C, and LP) and latent membrane proteins (LMP1, LMP2A, and LMP2B). Because latency III proteins are highly immunogenic, this program only persists in severely immunocompromised hosts. Latency II is intermediate with expression of EBNA1 and the latent membrane proteins.
EBV-associated lymphomas include Burkitt lymphoma (BL) and HIV-associated diffuse large B-cell lymphoma (HIV-DLBCL). In EBV+ BL and HIV-DLBCL, EBV exists in a latency I pattern, thereby evading immune responses to EBV.3,4 In contrast, EBV+ posttransplant lymphoproliferative disorder (PTLD) exhibits a latency III profile, reflecting the severity of immunosuppression after solid organ or hematopoietic stem cell transplant.5 Since the latency III program is highly immunogenic, PTLD can often be eradicated with restoration of the host immune response through reduction of immunosuppressive therapy.6 PTLD has also been successfully treated with ex vivo–derived EBV-specific cytotoxic T lymphocytes (EBV-CTLs).7-11 Similarly, latency II tumors have been successfully treated with EBV-CTLs directed against the latency II/III antigen LMP1.12 This therapeutic approach fails in latency I tumors due to restricted viral antigen expression.
We hypothesized that pharmacologic modulation of latency I tumors could induce immunogenic latent viral antigen expression and that this would sensitize resistant tumors to EBV-directed immunotherapy. We identified the hypomethylating agent decitabine as a potent inducer of the immunogenic EBV proteins LMP1, EBNA2, EBNA3A, and EBNA3C in BL. Induction of these antigens resulted in homing of EBV-specific T cells to tumors and sensitized tumor cells to T-cell lysis, suggesting that hypomethylating agents followed by EBV-CTLs could be used as a novel therapeutic approach in latency I EBV+ lymphomas.
Methods
Cell culture, immunoblot, immunohistochemistry (IHC), qRT-PCR, and reagents
Cell viability was determined using CellTiter-Glo (Promega) and the GloMax Multi+ detection system (Promega). The 50% inhibitory concentration (IC50) was calculated using Prism6 software. Quantitative reverse transcription polymerase chain reaction (qRT-PCR) was performed on the ABI 7500 Fast PCR system (Thermo Fisher Scientific) using TaqMan primers and probes for BZLF1, LMP1, Cp, and GAPDH as previously described.13 Further details are outlined in supplemental Methods (available on the Blood Web site).
Xenograft models
Nonobese diabetic-severe combined immunodeficiency and NOD scid gamma (NSG) mice were obtained from Jackson Laboratories. Six to 8-week-old mice were injected subcutaneously in the flank with 1 × 10⁷ BL cells in PBS with Matrigel (Corning). Tumors were measured by bioluminescent imaging performed using the IVIS Spectrum, with retroorbital luciferin injections. At sacrifice, tumors were harvested for RNA, DNA, and protein and sectioned for IHC.
EBV-CTLs and chromium release assay
EBV-CTLs were generated from peripheral blood mononuclear cells separated by low-density separation from peripheral blood of normal consented donors by stimulation with autologous B cells transformed with B95.8 EBV as previously described.7,14 Additional details can be found in supplemental Methods.
DNA methylation analysis using MassARRAY and Methyl Capture
Details are described in supplemental Methods. PCR primers specific for EBV are listed in supplemental Table 4.
Statistics
A 2-tailed, unpaired Student t test was used unless otherwise specified. All statistical analyses were performed using Prism software (GraphPad).
Study approval
The research and animal resource center of Weill Cornell Medical College and Memorial Sloan-Kettering Cancer Center approved all murine studies.
Results
High-throughput screen identifies small molecules that induce expression of latency III viral genes in EBV+ BL
To identify small molecules that convert a latency I EBV+ lymphoma to the latency II or III program, we optimized conditions for a high-throughput pharmacologic screen using latency I EBV+ BL cells. To select an appropriate cell line for our screen, we characterized latency in a panel of EBV+ BL cell lines. Mutu I, Kem I, Rael, Daudi, Raji, and Jiyoye BL cells were probed by immunoblot for EBNA1, LMP1, and EBNA3C. Kem I, Mutu I, and Rael expressed EBNA1 alone, indicative of latency I pattern. Raji and Jiyoye expressed high levels of LMP1 and Daudi expressed low levels of EBNA3C, likely due to a latency switch in culture (Figure 1A). Based on this, we selected Kem I for the screen and Rael and Mutu I for validation. LMP1 transcript level, as measured by qRT-PCR, served as the readout for the screen, since this would identify cells converting to latency II or III. Since LMP1 is also expressed in lytic viral replication, we evaluated the early lytic gene BZLF1 to characterize induction of lytic virus.
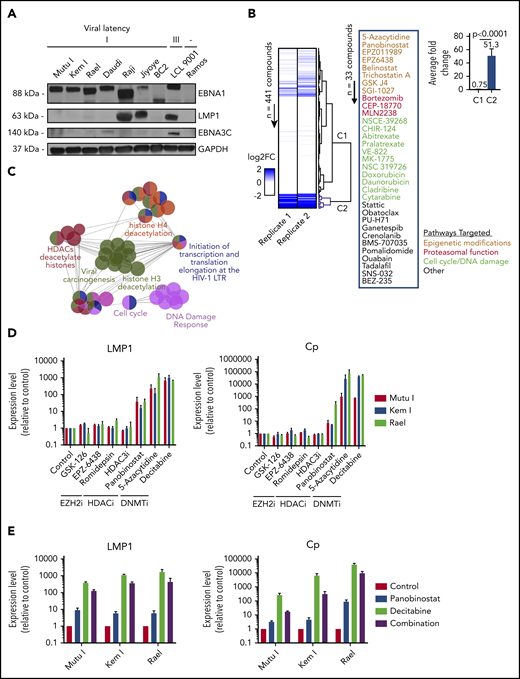
High-throughput drug screen identifies pharmacologic agents that induce latency III antigen expression. (A) Immunoblot of BL cell lines to characterize latency. BC2, latency I control; LCL 9001, latency III control; Ramos, EBV− control. (B) Heatmap showing the fold change in LMP1 for 2 replicates across 441 compounds. Dendrogram branches on the right illustrate groupings based on unsupervised clustering, highlighting a cluster of 33 compounds inducing a greater than twofold change in both replicates (blue branches). Inset shows the list of 33 compounds grouped based on similarity of pathway targets. (C) Network plot showing the pathway enrichments based on drug targets. Each node denotes a subpathway, with colors delineating pathway groupings (see table). Nodes with multiple colors denote shared pathway groupings. (D) Focused screen of epigenetic modifying agents. qRT-PCR for LMP1 and Cp promoter transcripts in cells treated with drug vs vehicle control for 48 hours. Data are shown as fold change in treated cells compared with vehicle control. Experiments were performed in duplicate. Drug doses were as follows: GSK-126, 5 μM; EPZ-6438, 5 μM; romidepsin, 0.25 nM; HDAC3i, 5 μM; panobinostat, 100 nM; 5-azacytidine, 4 μM; and decitabine, 1 μM. (E) Combination treatment with panobinostat and decitabine. qRT-PCR for LMP1 and Cp transcripts in cells treated with vehicle, panobinostat alone (100 nM), decitabine alone (1 μM), or combination. Experiments were performed in triplicate. Error bars represent standard error of the mean (SEM). DNMTi, DNA methyltransferase inhibitor; EZH2i, EZH2 inhibitor; FC, fold change; HDAC, histone deacetylase; HDACi, histone deacetylase inhibitor; LTR, long terminal repeat.
High-throughput drug screen identifies pharmacologic agents that induce latency III antigen expression. (A) Immunoblot of BL cell lines to characterize latency. BC2, latency I control; LCL 9001, latency III control; Ramos, EBV− control. (B) Heatmap showing the fold change in LMP1 for 2 replicates across 441 compounds. Dendrogram branches on the right illustrate groupings based on unsupervised clustering, highlighting a cluster of 33 compounds inducing a greater than twofold change in both replicates (blue branches). Inset shows the list of 33 compounds grouped based on similarity of pathway targets. (C) Network plot showing the pathway enrichments based on drug targets. Each node denotes a subpathway, with colors delineating pathway groupings (see table). Nodes with multiple colors denote shared pathway groupings. (D) Focused screen of epigenetic modifying agents. qRT-PCR for LMP1 and Cp promoter transcripts in cells treated with drug vs vehicle control for 48 hours. Data are shown as fold change in treated cells compared with vehicle control. Experiments were performed in duplicate. Drug doses were as follows: GSK-126, 5 μM; EPZ-6438, 5 μM; romidepsin, 0.25 nM; HDAC3i, 5 μM; panobinostat, 100 nM; 5-azacytidine, 4 μM; and decitabine, 1 μM. (E) Combination treatment with panobinostat and decitabine. qRT-PCR for LMP1 and Cp transcripts in cells treated with vehicle, panobinostat alone (100 nM), decitabine alone (1 μM), or combination. Experiments were performed in triplicate. Error bars represent standard error of the mean (SEM). DNMTi, DNA methyltransferase inhibitor; EZH2i, EZH2 inhibitor; FC, fold change; HDAC, histone deacetylase; HDACi, histone deacetylase inhibitor; LTR, long terminal repeat.
Kem I cells were incubated with small molecules using drug plates containing 441 validated cancer compounds (supplemental Table 1; adapted from Selleckchem catalog #L3500). This library was selected to include structurally diverse compounds covering >200 targets, including drugs targeting apoptosis, proteasome function, and epigenetic targets, as well as phosphatidylinositol 3-kinase (PI3K)/AKT, MAPK, JAK, and others. Cells were exposed to agents at 1 or 2.5 µM for 48 hours. We selected this dose range because we were interested in doses high enough to induce latency switch, but not cell death. LMP1 and BZLF1 expression were quantified by in-well qRT-PCR. The screen was performed twice. A compound was considered a hit if it induced a twofold or greater change in LMP1 expression. Unsupervised clustering analysis of fold change in LMP1 revealed a group of 33 compounds inducing a two-fold or greater change in both replicates (Figure 1B). A Student t test comparing the fold changes of the nonhits (C1) vs hits (C2) yielded a a value of P < .0001. The list of hits included epigenetic modifiers, proteasome inhibitors, modulators of cell cycle, or DNA damage response, among others.
To characterize common pathways of our screen hits, targets of the 33 compounds were imported into ClueGo, and pathway enrichments were assessed based on Gene Ontology biological processes, Kyoto Encyclopedia of Genes and Genomes, Reactome pathways, and Wikipathways. Key relevant pathways included “viral carcinogenesis,” histone H4 deacetylation, histone deacetylases, cell cycle, and DNA damage response (Figure 1C; supplemental Table 2).
Since epigenetic modifiers were among the top hits in both our screen and pathway analyses, we performed a focused screen of epigenetic modifying agents in Kem I, Mutu I, and Rael cell lines (Figure 1D). For this screen, we designed a custom drug plate with agents chosen to encompass different categories of epigenetic modifying agents, including histone deacetylase inhibitors, EZH2 inhibitors, and hypomethylating agents. Drugs were selected based on clinical relevance, with preference for agents currently in clinical use. To evaluate induction of latency II/III programming, we performed qRT-PCR for LMP1 and Cp, the promoter for latency III EBNA expression. Robust induction was observed with hypomethylating agents 5-azacytidine and decitabine, which induced LMP1 and Cp >100-fold and >1000-fold, respectively, in all 3 cell lines. Modest induction was also observed with the histone deacetylase inhibitor panobinostat. We next evaluated the combination of panobinostat and decitabine to determine if combining these agents would result in greater induction than either drug alone. The combination did not enhance LMP1 or Cp induction beyond decitabine alone (Figure 1E). Based on this, we decided to focus on hypomethylating agents.
Decitabine treatment induces expression of EBV latency III antigens
Since 5-azacytidine and decitabine were the top hits on our high-throughput and epigenetic screens, respectively, we validated the effect of these agents on latency II/III transcript and protein expression as well as characterized dose-response in a panel of BL cell lines. BL cells were treated with decitabine or 5-azacytidine over a range of doses. Viral antigen expression was evaluated by qRT-PCR, immunoblot, and IHC. Decitabine treatment resulted in dose-dependent induction of LMP1 and Cp transcripts at doses as low as 25 nM (Figure 2A). This was associated with upregulation of LMP1 and EBNA3C proteins (Figure 2B). In contrast, with 5-azacytidine, induction of LMP1 and Cp was minimal at doses <1 µM and was not associated with significant induction of LMP1 or EBNA3C proteins (Figure 2C-D).
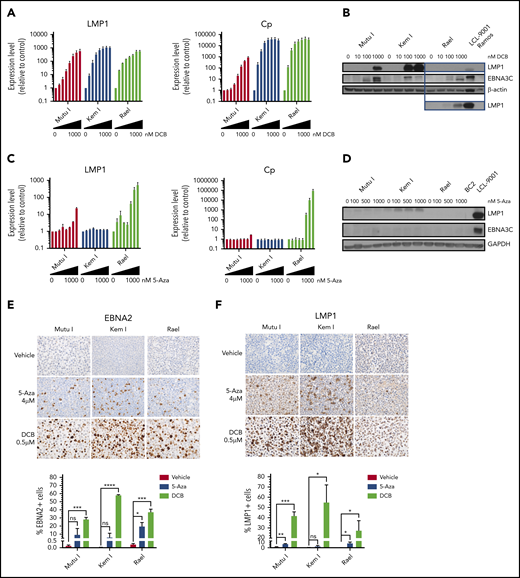
Hypomethylating agents induce immunogenic EBV antigens. (A,C) qRT-PCR for LMP1 and Cp promoter in cells treated with drug (decitabine or 5-azacytidine) vs vehicle control for 48 hours at the following doses listed from left to right: vehicle, 10, 25, 50, 100, 250, 500, and 1000 nM. Data are shown as fold change in treated cells compared with vehicle control. Experiments were performed in triplicate. Error bars represent SEM. (B,D) Immunoblot for viral proteins as indicated. BL cells were incubated with drug at the indicated doses for 48 hours. LCL-9001 is a latency III positive control. BC2 is a latency I control. Ramos is an EBV− BL used as a negative control. Lower panel in B represents a longer exposure time for LMP1. (E-F) Immunohistochemistry for EBNA2 and LMP1 in cell blocks generated from Mutu I, Kem I, and Rael cells treated as indicated. Cells were exposed to 5-azacytidine at 4 µM, decitabine at 500 nM, or vehicle control for 48 hours. Experiments were performed in triplicate. Representative images were obtained on an Olympus BX 43 microscope (Camera, Jenoptik ProgResCF; software, ProgRes Mac Capture Pro, 2013. Original magnification ×600 with a 60/0.80 objective lens). (G-F) Image quantification using HALO (Indica labs). Error bars represent SEM. *P < .05, **P < .01, ***P < .001, ****P < .0001. 5-Aza, 5-azacytidine; DCB, decitabine; ns, not significant.
Hypomethylating agents induce immunogenic EBV antigens. (A,C) qRT-PCR for LMP1 and Cp promoter in cells treated with drug (decitabine or 5-azacytidine) vs vehicle control for 48 hours at the following doses listed from left to right: vehicle, 10, 25, 50, 100, 250, 500, and 1000 nM. Data are shown as fold change in treated cells compared with vehicle control. Experiments were performed in triplicate. Error bars represent SEM. (B,D) Immunoblot for viral proteins as indicated. BL cells were incubated with drug at the indicated doses for 48 hours. LCL-9001 is a latency III positive control. BC2 is a latency I control. Ramos is an EBV− BL used as a negative control. Lower panel in B represents a longer exposure time for LMP1. (E-F) Immunohistochemistry for EBNA2 and LMP1 in cell blocks generated from Mutu I, Kem I, and Rael cells treated as indicated. Cells were exposed to 5-azacytidine at 4 µM, decitabine at 500 nM, or vehicle control for 48 hours. Experiments were performed in triplicate. Representative images were obtained on an Olympus BX 43 microscope (Camera, Jenoptik ProgResCF; software, ProgRes Mac Capture Pro, 2013. Original magnification ×600 with a 60/0.80 objective lens). (G-F) Image quantification using HALO (Indica labs). Error bars represent SEM. *P < .05, **P < .01, ***P < .001, ****P < .0001. 5-Aza, 5-azacytidine; DCB, decitabine; ns, not significant.
To determine if induction of LMP1 and EBNA3 were linked to hypomethylating agent–induced cell death, we exposed cells to decitabine or 5-azacytidine over a range of doses and evaluated cell viability. The decitabine dose that induced maximal latency II/III antigen expression was 25 to 500 nM, which was far below the IC50 of the drug (>5 μM) (supplemental Table 3). The viability relative to untreated cells in Mutu I, Kem I, and Rael cells treated with decitabine at the optimal induction dose was 62%, 128%, and 102%, respectively (supplemental Figure 1). For 5-azacytidine, the optimal dose for induction (1-4 μM) was closer to the IC50 (2.2 μM to >5 μM); however, there was minimal change in cell viability at the optimal dose for induction (supplemental Figure 1 and supplemental Table 3). This suggests that the escape from latency I in response to hypomethylating agents is not due to cell death.
We next determined the percentage of cells that express latency II/III antigens after treatment with decitabine or 5-azacytidine. To do this, we evaluated LMP1 and EBNA2 expression at the single-cell level by IHC in cell blocks. The percentage of positive cells was quantified with HALO image analysis. Decitabine treatment increased EBNA2 expression in all 3 cell lines (Figure 2E). The percentage of EBNA2-positive cells increased from 0.13% to 28.3% in Mutu I, t (P = .0004), 0.03% to 57.8% in in Kem I (P < .0001), and 0.24% to 37.2% in Rael (P = .0005). The percentage of LMP1-positive cells also increased with decitabine treatment, from 1.04% to 41.8% (P = .0005), 0.31% to 54.9% (P = .034), and 0.04% to 27.4% (P = .048) in Mutu I, Kem I, and Rael, respectively (Figure 2F). 5-Azacytidine induced a more modest expression of EBNA2 and LMP1 across the 3 cell lines (Figure 2E-F). Since decitabine induced latency II/III antigen expression in a higher percentage of cells than 5-azacytidine and did so at lower concentrations, we elected to focus on decitabine as a potential agent to induce expression of immunogenic viral antigens in latency I tumors.
Decitabine induces latency III antigen expression in vivo
To evaluate the effect of decitabine on viral antigen expression in vivo, we generated Mutu I, Kem I, and Rael xenografts. Upon engraftment, mice were treated with a 7-day course of decitabine (0.5 or 1 mg/kg daily) or vehicle control. After treatment, tumors were evaluated by immunohistochemistry. In decitabine-treated mice, we observed a dose dependent increase in EBNA2 expression in all 3 xenografts (P = .002, P = .014, and P < .0001 in Mutu I, Kem I, and Rael, respectively; Figure 3A). Dose-dependent increase in LMP1 expression was observed in Mutu I and Kem I xenografts (P < .001 and P < .014, respectively; Figure 3B). Induction of LMP1 in Rael xenografts was not statistically significant despite robust induction of EBNA2. Possible explanations for this include genomic alterations affecting the epigenetic state of the LMP1 promoter in Rael such that EBNA2 derepression occurs but with less EBNA2-induced LMP1 activity, baseline differences in Rael methylation that impact the threshold for epigenetic derepression of LMP1, and limited lytic induction in Rael resulting in minimal lytic LMP1.
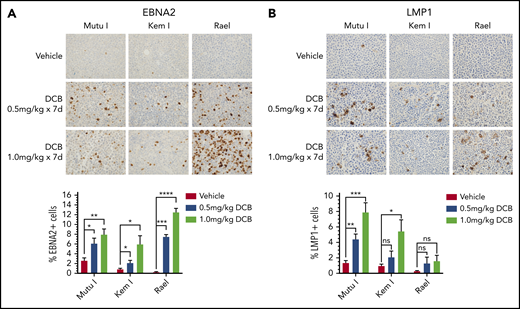
Decitabine induces expression of viral antigens in BL xenograft models. (A-B) Immunohistochemistry for EBNA2 and LMP1 in tumors obtained from Mutu I, Kem I, or Rael xenograft mice as indicated. Experiments were performed with 6 mice per condition per cell line for each of the following conditions: vehicle treatment, decitabine 0.5 mg/kg intraperitoneally daily, and decitabine 1 mg/kg intraperitoneally daily. Representative images were obtained on an Olympus BX 43 microscope (Camera, Jenoptik ProgResCF; software, ProgRes Mac Capture Pro, 2013). Original magnification ×600 with a 60/0.80 objective lens. (C-D) Image quantification using HALO (Indica labs). Error bars represent SEM. *P < .05, ** P < .01, ***P < .001, ****P < .0001.
Decitabine induces expression of viral antigens in BL xenograft models. (A-B) Immunohistochemistry for EBNA2 and LMP1 in tumors obtained from Mutu I, Kem I, or Rael xenograft mice as indicated. Experiments were performed with 6 mice per condition per cell line for each of the following conditions: vehicle treatment, decitabine 0.5 mg/kg intraperitoneally daily, and decitabine 1 mg/kg intraperitoneally daily. Representative images were obtained on an Olympus BX 43 microscope (Camera, Jenoptik ProgResCF; software, ProgRes Mac Capture Pro, 2013). Original magnification ×600 with a 60/0.80 objective lens. (C-D) Image quantification using HALO (Indica labs). Error bars represent SEM. *P < .05, ** P < .01, ***P < .001, ****P < .0001.
Induction of latency III antigens with decitabine persists after removal of drug
If induction of immunogenic antigens were to be used as therapeutic approach in EBV+ lymphomas, then it would be important to ensure that the induction persists after removal of drug to allow time for an adequate T-cell response. We evaluated the durability of latency III induction by treating cell lines with decitabine for 3 days and then evaluating LMP1 and Cp promoter expression after washout of the drug. LMP1 and Cp expression by qRT-PCR persists with minimal decrement at 1, 3, 5, and 7 days after washout of decitabine (Figure 4A). We also evaluated Rael xenografts for durability of induction in vivo. Tumors evaluated by immunohistochemistry 4 days after a 7-day course of decitabine demonstrated persistent induction with no decrement in the percentage of EBNA2+ cells (Figure 4B). Mice observed at later time points continued to express EBNA2, with some areas of tumor remaining EBNA2+ as late as 63 days after treatment (Figure 4C). This suggests that epigenetic induction of latency III proteins is durable long after discontinuation of hypomethylating agents.
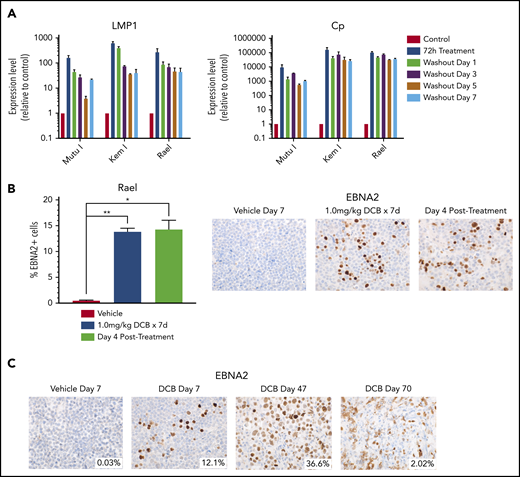
Decitabine induction of viral antigens persists after removal of drug. (A) qRT-PCR for LMP1 and Cp in cells treated with 250 nM decitabine vs vehicle control for 72 hours and then evaluated after removal of drug at the indicated time points. Data are shown as fold change in treated cells compared with vehicle control. Experiments were performed in triplicate. Error bars represent SEM. (B) Quantification of EBNA2+ cells by IHC in Rael xenograft tumors as indicated. Error bars represent SEM. *P < .05, **P < .01. (C) IHC for EBNA2 on Rael xenograft tumors after treatment with decitabine or vehicle at the specified time points. Mice were treated with decitabine or vehicle control and then evaluated immediately after treatment (n = 4), 4 days after discontinuation of drug (n = 4), or at the time of sacrifice due to progressive tumor (n = 8). Microscope, Olympus BX 43 microscope; camera, Jenoptik ProgResCF; software, ProgRes Mac Capture Pro, 2013. Original magnification ×600 with a 60/0.80 objective lens.
Decitabine induction of viral antigens persists after removal of drug. (A) qRT-PCR for LMP1 and Cp in cells treated with 250 nM decitabine vs vehicle control for 72 hours and then evaluated after removal of drug at the indicated time points. Data are shown as fold change in treated cells compared with vehicle control. Experiments were performed in triplicate. Error bars represent SEM. (B) Quantification of EBNA2+ cells by IHC in Rael xenograft tumors as indicated. Error bars represent SEM. *P < .05, **P < .01. (C) IHC for EBNA2 on Rael xenograft tumors after treatment with decitabine or vehicle at the specified time points. Mice were treated with decitabine or vehicle control and then evaluated immediately after treatment (n = 4), 4 days after discontinuation of drug (n = 4), or at the time of sacrifice due to progressive tumor (n = 8). Microscope, Olympus BX 43 microscope; camera, Jenoptik ProgResCF; software, ProgRes Mac Capture Pro, 2013. Original magnification ×600 with a 60/0.80 objective lens.
In addition to modulating latent gene expression, 5-azacytidine is known to activate lytic programming in EBV.15-20 To determine if the lytic program was being activated by decitabine, we performed qRT-PCR for BZLF1 in Rael, Mutu I, and Kem I. We observed an increase in BZLF1; however, this decreased over time after removal of drug (supplemental Figure 2A), suggesting that the effect may be more transient than latent transcript activation. In our xenograft models, we evaluated BZLF1 by IHC. We observed BZLF1 induction in Mutu I but minimal (≤2%) or no induction in Kem I or Rael, despite strong expression of EBNA2 and/or LMP1 in both xenografts (supplemental Figure 2B). This suggests that separate lytic and latent populations are potentially being activated by decitabine, with the lytic population being more transient.
Decitabine induces hypomethylation at key viral promoters
The effect of decitabine across the EBV genome is not fully characterized.21-23 To better understand the key regions of the EBV viral genome affected by decitabine treatment, we performed targeted DNA methylation analyses of key regions across the EBV genome using EpiTYPER MassARRAY methylation analysis. We specifically evaluated DNA methylation levels of 131 cytosine guanine dinucleotides (CpGs) in 28 EBV regions (1-13 CpGs per region), including EBV gene promoters, gene bodies, and introns. Regions covered include Cp, LMP1, and LMP2A (Figure 5A; primers are listed in supplemental Table 4). Kem I, Rael, and Mutu I cells were analyzed after treatment with decitabine or vehicle for 48 hours. In vehicle-treated cells, we observed a high degree of DNA methylation across the EBV genome in Rael and intermediate levels in Kem I and Mutu I (Figure 5B). Following decitabine treatment, we observed loss of methylation across the EBV viral genome in all 3 cell lines, including the Cp promoter and LMP1/2 loci, consistent with upregulation of these promoters.
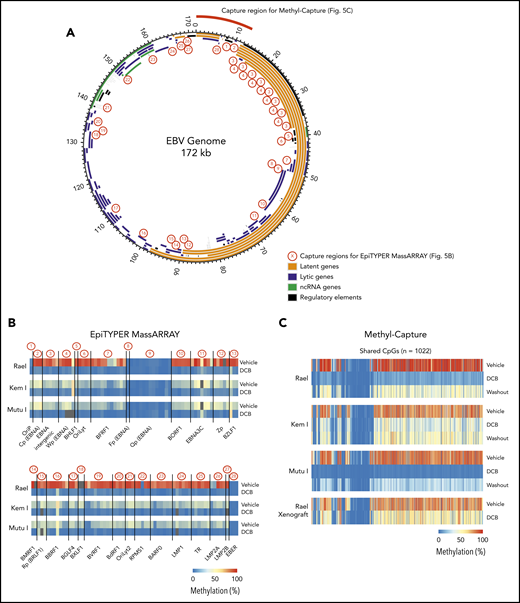
Global EBV DNA hypomethylation is observed after decitabine treatment in latency I EBV+ BL. (A) EBV genome plot. Latent, lytic, noncoding RNA genes and regulatory regions are color coded as indicated. Capture regions for EpiTYPER MassARRAY methylation analysis are indicated with red numbers. Twenty-eight regions were selected across the genome (1-13 CpGs per region) representing primarily EBV gene promoters. Capture region for Methyl-Capture sequencing is also depicted. (B) Heatmap of quantitative DNA methylation levels as analyzed by EpiTYPER MassARRAY in vehicle- and decitabine-treated cells. (C) Heatmap of methylation of CpGs, n = 1022 from methyl-capture sequencing. Washout, cells treated with drug × 48 hours followed by 7 days of incubation in media without drug.
Global EBV DNA hypomethylation is observed after decitabine treatment in latency I EBV+ BL. (A) EBV genome plot. Latent, lytic, noncoding RNA genes and regulatory regions are color coded as indicated. Capture regions for EpiTYPER MassARRAY methylation analysis are indicated with red numbers. Twenty-eight regions were selected across the genome (1-13 CpGs per region) representing primarily EBV gene promoters. Capture region for Methyl-Capture sequencing is also depicted. (B) Heatmap of quantitative DNA methylation levels as analyzed by EpiTYPER MassARRAY in vehicle- and decitabine-treated cells. (C) Heatmap of methylation of CpGs, n = 1022 from methyl-capture sequencing. Washout, cells treated with drug × 48 hours followed by 7 days of incubation in media without drug.
To evaluate methylation with increased breadth across a focused area of the viral genome, we performed Methyl-Capture sequencing using a custom probe set designed to cover the first 13 kb of the EBV genome, including the OriP, EBERs, and regions upstream of Cp and EBNAs (Figure 5A, “capture region for Methyl-Capture”). Kem I, Rael, and Mutu I cells were analyzed after treatment with decitabine or vehicle as well as after decitabine followed by a 7-day washout. We also assessed DNA methylation in vivo using tumors from Rael xenografts treated with decitabine or vehicle control.
The analysis of bisulfite-treated sequence reads was carried out as previously described24 with alignment to the EBV genome. Consistent with our MassARRAY data, we observed global hypomethylation after treatment with decitabine (Figure 5C). After removal of drug, we observed a modest increase in methylation; however, the genome remained hypomethylated relative to vehicle-treated cells (Figure 5C). Tumors from our xenograft displayed similar global hypomethylation after treatment with decitabine, consistent with the induction of antigens observed in these models. To evaluate the location of differentially methylated regions, we mapped differentially methylated areas to the EBV genome using Integrative Genomics Viewer (Figure 6). Areas of differentially methylated cytosines included Cp and LMP2A/B.
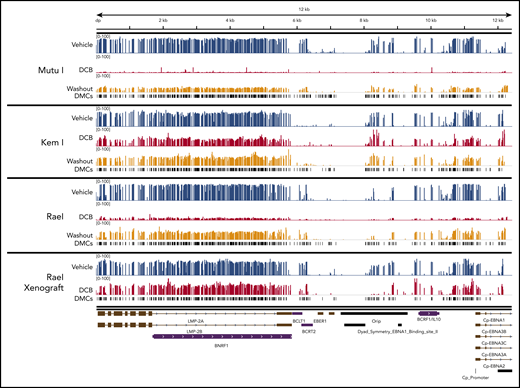
Localization of differentially methylated CpGs in decitabine-treated BL cell lines and xenografts. Decitabine- and vehicle-treated cells and xenograft tumors were evaluated with Methyl-Capture sequencing as described above. Differentially methylated areas were mapped to the EBV genome using Integrative Genomics Viewer (Broad Institute; https://software.broadinstitute.org/software/igv). DMCs, differentially methylated cytosines.
Localization of differentially methylated CpGs in decitabine-treated BL cell lines and xenografts. Decitabine- and vehicle-treated cells and xenograft tumors were evaluated with Methyl-Capture sequencing as described above. Differentially methylated areas were mapped to the EBV genome using Integrative Genomics Viewer (Broad Institute; https://software.broadinstitute.org/software/igv). DMCs, differentially methylated cytosines.
Induction of latency III antigens sensitizes tumors to T-cell–mediated lysis
The induction of highly immunogenic EBV antigens such as LMP1, EBNA3A, and EBNA3C may sensitize tumors to autologous T-cell–mediated lysis and/or killing with allogeneic EBV-CTLs. EBV-CTLs are generated in response to autologous B cells transformed with EBV and principally recognize EBNA3 or LMP1. In latency III EBV+ PTLDs, adoptive transfer of ex vivo–generated EBV-CTLs can induce durable remissions.8-11
We hypothesized that induction of LMP1 and/or EBNA3 with decitabine treatment would sensitize resistant latency I EBV+ BL tumors to allogeneic EBV-CTLs. To identify appropriately HLA-restricted EBV-CTLs, we performed high-resolution HLA typing on Kem I, Mutu I, and Rael (supplemental Table 5). We then searched our bank of >330 GMP-grade alloreactive T-celldepleted, EBV-specific T-cell lines7 and identified appropriately HLA-restricted EBV-CTLs specific for the latency II/III antigens EBNA3C, EBNA3A, or LMP1 for Mutu I and Rael.
EBNA3C- and EBNA3A-reactive T cells were tested for cytotoxicity against Rael and Mutu I, respectively, using a standard chromium-51 release assay (Figure 7A-B). A significant increase in T-cell–mediated lysis was observed in response to Rael and Mutu I after decitabine treatment across a range of effector-to-target (E:T) ratios. For example, at a 25:1 E:T ratio, we observed 26.07% lysis of Rael treated with decitabine vs 6.08% with vehicle (P = .0026; Figure 7A). Similarly, 16.17% of Mutu I cells treated with decitabine were lysed compared with 0.33% of vehicle-treated cells (P = .0018; Figure 7B). The degree of cell lysis against decitabine-treated cells was comparable to that observed against autologous EBV-positive B-lymphoblastoid cell lines (Figure 7A-B). To confirm these findings with a third antigen, we evaluated EBV-CTLs that recognize LMP1. These cells were tested against Mutu I, which upregulated LMP1 upon exposure to decitabine (Figures 2D,F and 3B). LMP1-reactive EBV-CTLs were highly cytotoxic against decitabine-treated Mutu I, but not vehicle-treated Mutu I, at all 3 E:T ratios. For example, at a 25:1 E:T ratio, we observed 74.11% lysis of decitabine-treated Mutu I compared with 0.67% of vehicle treated Mutu I (P < .0001; Figure 7C).
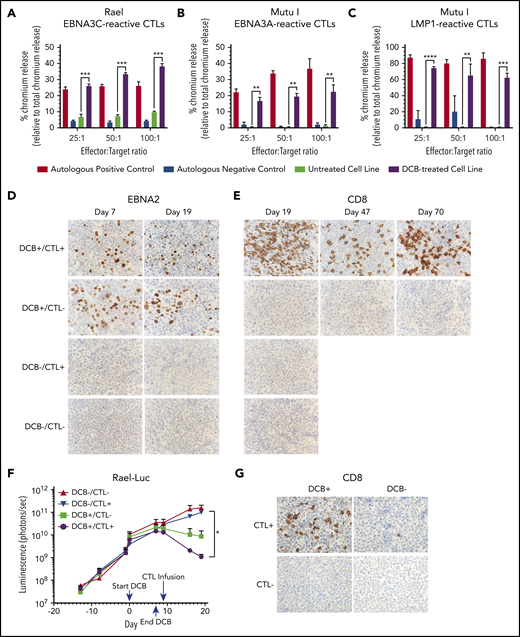
Decitabine treatment results in T-cell–mediated lysis in vitro and T-cell trafficking to tumors in vivo. (A-C) Chromium-release assay in the indicated cell lines incubated with EBV-CTLs reactive to EBNA3C, EBNA3A, or LMP1 as labeled. BL cells were treated with decitabine at 50 nM (Rael) or 250 nM (Mutu I) or vehicle control for 72 hours. Controls are as follows: (A) autologous dendritic cells with A0201 HLA loaded with EBNA3C peptide (positive control) and autologous dendritic cells with A0201 HLA alone (negative control), (B) EBV-transformed autologous BLCL (positive control) and autologous dendritic cells (negative control), and (C) EBV-transformed autologous BLCL (positive control) and autologous phytohemagglutinin-activated blasts (negative control). ** P < .01, ***P < .001, ****P < .0001. (D-E) IHC for EBNA2 and CD8 in xenograft tumors as indicated. Microscope, Olympus BX 43 microscope; camera, Jenoptik ProgResCF; software, ProgRes Mac Capture Pro, 2013. Original magnification ×600 with a 60/0.80 objective lens. (F) Bioluminescence in Rael-luciferase xenografts. *P < .05. (G) IHC for CD8 in Mutu I xenografts in the indicated treatment cohorts. Upon engraftment, Mutu I xenograft mice were randomized to treatment with decitabine at 1 mg/kg daily × 3 days or vehicle control followed by EBV-CTLs twice weekly vs control with 4 mice in each cohort. Mice were humanely sacrificed at the time of tumor growth >2000 mm3 or at day 18 to evaluate for T-cell trafficking to tumor.
Decitabine treatment results in T-cell–mediated lysis in vitro and T-cell trafficking to tumors in vivo. (A-C) Chromium-release assay in the indicated cell lines incubated with EBV-CTLs reactive to EBNA3C, EBNA3A, or LMP1 as labeled. BL cells were treated with decitabine at 50 nM (Rael) or 250 nM (Mutu I) or vehicle control for 72 hours. Controls are as follows: (A) autologous dendritic cells with A0201 HLA loaded with EBNA3C peptide (positive control) and autologous dendritic cells with A0201 HLA alone (negative control), (B) EBV-transformed autologous BLCL (positive control) and autologous dendritic cells (negative control), and (C) EBV-transformed autologous BLCL (positive control) and autologous phytohemagglutinin-activated blasts (negative control). ** P < .01, ***P < .001, ****P < .0001. (D-E) IHC for EBNA2 and CD8 in xenograft tumors as indicated. Microscope, Olympus BX 43 microscope; camera, Jenoptik ProgResCF; software, ProgRes Mac Capture Pro, 2013. Original magnification ×600 with a 60/0.80 objective lens. (F) Bioluminescence in Rael-luciferase xenografts. *P < .05. (G) IHC for CD8 in Mutu I xenografts in the indicated treatment cohorts. Upon engraftment, Mutu I xenograft mice were randomized to treatment with decitabine at 1 mg/kg daily × 3 days or vehicle control followed by EBV-CTLs twice weekly vs control with 4 mice in each cohort. Mice were humanely sacrificed at the time of tumor growth >2000 mm3 or at day 18 to evaluate for T-cell trafficking to tumor.
Decitabine pretreatment of EBV+ tumors results in T-cell homing and inhibition of tumor growth in vivo
We hypothesized that a short course of decitabine might render latency I EBV+ B-cell lymphomas sensitive to appropriately HLA-restricted allogeneic EBV-CTLs specific for latency II/III antigens in vivo. To test this approach, we first evaluated EBNA3C-reactive EBV-CTL responses against subcutaneous xenografts of Rael cells in NSG mice. To quantitate responses we used Rael cells transduced to express luciferase (supplemental Figure 3A). Once engrafted, mice were assigned to 1 of 4 cohorts to receive decitabine vs vehicle followed by EBV-CTLs vs vehicle. Assignment was balanced based on BLI signal. Decitabine was administered daily for 7 days (days 1-7) followed by 2 days of rest to allow drug clearance and reduce any interference between decitabine and CTLs. EBV-CTLs were then infused on day 9.
Consistent with our prior experiments, treatment with decitabine resulted in induction of latent antigens EBNA2 and LMP1, with minimal change in the lytic protein BZLF1 (Figure 7D; supplemental Figure 3B). To evaluate tumors for T-cell trafficking, we performed IHC for CD8 on tumors at days 19, 47, and 70. A robust T-cell infiltrate was observed in mice that received decitabine followed by EBV-CTLs, but not in mice that received vehicle followed by EBV-CTLs or any other condition (Figure 7E). We also observed inhibition of tumor growth as measured by in vivo bioluminescence in mice that received decitabine followed by EBV-CTLs when compared with mice that received EBV-CTLs without decitabine (P = .03; Figure 7F; supplemental Figure 3C). Notably, decitabine treatment did not increase PD-L1 expression (supplemental Figure 3D), suggesting that this approach can be used without derepressing PD-L1 in these tumors.
In a second xenograft model, we evaluated LMP1-reactive EBV-CTLs in Mutu I xenografts. Upon engraftment, mice were assigned to receive decitabine vs vehicle followed by EBV-CTLs vs vehicle as above. Mice were treated with decitabine at 1 mg/kg per day or vehicle for 3 days followed by EBV-CTLs vs vehicle. Mutu I tumors grow rapidly in immunocompromised mice, which does not allow mice to be followed over the time course needed to observe for antitumor effect. In this experiment, all mice were humanely sacrificed by day 18 to evaluate for T-cell homing. T-cell infiltrates were observed in the tumors of mice treated with decitabine followed by EBV-CTLs, but not in the mice that received CTLs without decitabine (2.6% vs 0.08%, P = .03; Figure 7G; supplemental Figure 4). These experiments demonstrate that decitabine treatment induces T-cell recognition in vivo in latency I tumors that otherwise would not elicit a T-cell response.
Discussion
EBV is present in nearly all cases of endemic BL in sub-Saharan Africa and approximately 30% of sporadic BL cases throughout other regions of the world.25 EBV is also associated with subsets of DLBCL and classical Hodgkin lymphoma. In these tumors, the virus evades immune surveillance through restricted expression of viral antigens. Therapeutic approaches that target EBV are particularly attractive in these tumors, which arise in settings where high-dose chemotherapy may not be feasible. One approach to EBV-directed therapy is to induce lytic viral replication and then target lytic virus with antiherpesvirus agents such as ganciclovir.19,26 Attempts to sensitize tumors to ganciclovir have been limited by the strong EBV propensity to remain latent.27-31 Our work explored a different approach: shifting latency to generate a more immunogenic tumor which could then be targeted by ex vivo–generated EBV-specific cytotoxic T lymphocytes or, perhaps, the host immune response.
The mechanisms by which EBV maintains restricted latency are not well understood; however, epigenetic modulation is likely important.32-35 Our high-throughput pharmacologic screen identified the hypomethylating agent 5-azacytidine as a potent inducer of LMP1. In a focused epigenetic screen, which included hypomethylating agents, histone deacetylase inhibitors, and histone methyltransferase inhibitors, we found the hypomethylating agents 5-azacytidine and decitabine to induce LMP1 and Cp at levels that could not be achieved with any other epigenetic agent. EBV methylation analysis performed in vitro and in vivo demonstrated that decitabine results in global hypomethylation across key latency promoters, including LMP1 and Cp, the promoter responsible for latency III EBNA expression, suggesting that hypomethylation of these promoters can release cells from latency I. Collectively, this work demonstrates a crucial role for viral methylation in maintenance of latency in BL. Prior studies have evaluated 5-azacytidine in the Rael cell line and observed expression of Cp promoter transcripts.20,36 Here, we show that short-course, low-dose decitabine can derepress the latency I pattern across a panel of BL cells in vitro and in vivo and that the effect is durable long after removal of drug, suggesting that this could be a rational therapeutic modality to induce latency III.
A crucial unanswered question is why only a portion of EBV-infected cells convert to latency III after treatment with hypomethylating agents. One possibility is that cells must be exposed to drug at a specific point in the cell cycle to allow integration of decitabine into viral DNA. Another is that some virions are inherently resistant to latency switch or activate compensatory mechanisms to maintain the restricted state. Since partial induction of latency II/III may select for resistant latency I cells, it will be important to understand the percentage induction in patient tumors. In addition, further studies are needed to identify genetic or epigenetic factors required for sustaining deep latency across cell populations, as this may provide additional or alternative approaches whereby these tumors can be rendered targetable by the immune system. Despite partial induction, our work provides proof-of-principle that activation of immunogenic viral antigens can render tumor cells sensitive to T-cell lysis in vitro and result in T-cell homing to the tumor in vivo.
We observed trafficking of EBV-CTLs to latency I BL tumors in vivo, which only occurred in the setting of pretreatment with decitabine. In previous studies, we have demonstrated that HLA A0201–restricted EBV-CTLs selectively migrate to, expanded in, and induce regressions of only tumors that are EBV+ and coexpress HLA A0201.37 Given these prior findings, our experiments demonstrating selective infiltrations of adoptively transferred HLA A0201–restricted EBNA3C or LMP1-specific T cells into decitabine-treated, but not vehicle-treated, HLA A0201+ BL xenografts provide evidence that the EBNA3C and LMP1 proteins induced by decitabine can be processed and their immunogenic peptides presented by HLA A0201 in BL at levels permitting in vivo recognition of these tumors by antigen-specific T cells. This results in T-cell accumulation at tumor sites and the engagement and lysis of tumor cells expressing latency II/III antigens.
Hypomethylation with decitabine may also induce nonviral tumor-associated antigens in lymphomas, which could be targeted by cytotoxic T lymphocytes.38-40 Additional studies are needed to fully understand the spectrum of viral and nonviral antigens that can exploited for therapeutic targeting through induction with decitabine.
In summary, our work demonstrates that hypomethylation of EBV+ BL induces expression of immunogenic viral antigens that sensitizes tumors to T-cell–mediated killing. Since the induction of latency II/III antigens occurs after low-dose, short-course therapy with decitabine, this treatment approach followed by EBV-specific CTLs is not likely to add significant toxicity and has the potential to expand the spectrum of diseases that can be treated with third-party EBV-specific cytotoxic T cells. This therapeutic approach has implications beyond lymphomas and could potentially be applied to other EBV-driven malignancies with restricted latency.
The online version of this article contains a data supplement.
The publication costs of this article were defrayed in part by page charge payment. Therefore, and solely to indicate this fact, this article is hereby marked “advertisement” in accordance with 18 USC section 1734.
Datasets and protocols will be made available by emailing the corresponding author.
Acknowledgments
The authors thank the Memorial Sloan Kettering Cancer Center Small-Animal Imaging Core Facility.
Funding was provided by the National Institutes of Health/National Cancer Institute (K08 CA219473), the Starr Cancer Consortium (I11-0043), and the Leukemia and Lymphoma Society.
Authorship
Contribution: T.D. and E.D. designed research, performed research, analyzed data, and wrote the paper; D.P., C.W., C.C.O., A.A., and O.E. designed research, performed researched, and analyzed data; R.R., A.S., T.V., B.S., V.D., and H.S. performed research; H.P. and J.M.P. analyzed data; R.J.O., B.E.G., and E.C. designed research and analyzed data; and L.G.-R. designed research, analyzed research, and wrote the paper.
Conflict-of-interest disclosure: L.G.-R. is a consultant for Janssen and ADC Therapeutics. D.P. was at Memorial Sloan Kettering Cancer Center while engaged in this project but is currently employed at GlaxoSmithKline. R.J.O. and E.D. received royalties following licensure of the EBV-specific T-cell bank by Atara Biotherapeutics and have subsequently received research support and consultant fees from Atara Biotherapeutics. The remaining authors declare no competing financial interests.
The current affiliation for D.P. is GlaxoSmithKline, Collegeville, PA.
Correspondence: Lisa Giulino-Roth, 525 E 68th St, Payson 695, New York, NY 10065; e-mail: lgr2002@med.cornell.edu.

This feature is available to Subscribers Only
Sign In or Create an Account Close Modal