

Key Points
The mTOR pathway is hyperactivated in iMCD and a candidate novel therapeutic target.
mTOR activation is increased in iMCD to a similar extent as the mTOR-driven autoimmune lymphoproliferative syndrome.

Abstract
Idiopathic multicentric Castleman disease (iMCD) is a rare and poorly understood hematologic disorder characterized by lymphadenopathy, systemic inflammation, cytopenias, and life-threatening multiorgan dysfunction. Interleukin-6 (IL-6) inhibition effectively treats approximately one-third of patients. Limited options exist for nonresponders, because the etiology, dysregulated cell types, and signaling pathways are unknown. We previously reported 3 anti-IL-6 nonresponders with increased mTOR activation who responded to mTOR inhibition with sirolimus. We investigated mTOR signaling in tissue and serum proteomes from iMCD patients and controls. mTOR activation was increased in the interfollicular space of iMCD lymph nodes (N = 26) compared with control lymph nodes by immunohistochemistry (IHC) for pS6, p4EBP1, and p70S6K, known effectors and readouts of mTORC1 activation. IHC for pS6 also revealed increased mTOR activation in iMCD compared with Hodgkin lymphoma, systemic lupus erythematosus, and reactive lymph nodes, suggesting that the mTOR activation in iMCD is not just a product of lymphoproliferation/inflammatory lymphadenopathy. Further, the degree of mTOR activation in iMCD was comparable to autoimmune lymphoproliferative syndrome, a disease driven by mTOR hyperactivation that responds to sirolimus treatment. Gene set enrichment analysis of serum proteomic data from iMCD patients (n = 88) and controls (n = 42) showed significantly enriched mTORC1 signaling. Finally, functional studies revealed increased baseline mTOR pathway activation in peripheral monocytes and T cells from iMCD remission samples compared with healthy controls. IL-6 stimulation augmented mTOR activation in iMCD patients, which was abrogated with JAK1/2 inhibition. These findings support mTOR activation as a novel therapeutic target for iMCD, which is being investigated through a trial of sirolimus (NCT03933904).
Introduction
Idiopathic multicentric Castleman disease (iMCD) is a rare and deadly hematologic disease involving episodic cytokine-induced lymphoproliferation.1 It is characterized by a diverse and debilitating constellation of clinical and laboratory abnormalities, including systemic inflammation, cytopenias, and multiorgan dysfunction. Some patients present with thrombocytopenia, anasarca, fever, fibrosis of bone marrow, renal dysfunction, organomegaly, and normal immunoglobulin levels, which fulfill TAFRO (thrombocytopenia, anasarca, fever/elevated C-reactive protein, reticulin myelofibrosis, renal dysfunction, and organomegaly) clinical subtype criteria (iMCD-TAFRO). Others demonstrate a milder phenotype, thrombocytosis, and hypergammaglobulinemia and are referred to as iMCD not otherwise specified (iMCD-NOS).1 The heterogeneous presentation and clinicopathological overlap with cancers and autoimmune disorders present diagnostic and therapeutic challenges.
iMCD is one of the 3 subtypes of Castleman disease (CD) that demonstrate characteristic lymph node histopathology, including dysmorphic germinal centers, expanded mantle zones, hypervascularity, and interfollicular plasmacytosis.1 The other 2 subtypes include unicentric CD (UCD), which is often cured with surgery,2,3 and another multicentric subtype caused by uncontrolled human herpes virus-8 (HHV-8) infection (HHV-8–associated MCD), which is well controlled with rituximab.4-6
Interleukin-6 (IL-6) is the established pathogenic driver in some cases of iMCD,7 and siltuximab, an anti-IL-6 monoclonal antibody, is the only US Food and Drug Administration–approved treatment of iMCD.8,9 Unfortunately, 50% to 66% of patients do not respond to siltuximab.10 The limited understanding of iMCD etiology, dysregulated cell types, signaling pathways, and other key cytokines has slowed development of novel therapeutics for anti-IL-6 nonresponders.
Recently, preliminary data investigating cytokine levels, peripheral blood mononuclear cells, and serum proteomics in 3 anti-IL-6-refractory iMCD patients identified the phosphatidylinositol 3-kinase (PI3K)/Akt/mTOR signaling pathway as a candidate therapeutic target.11 Immunohistochemistry (IHC) of lymph node tissue revealed increased mTOR activation in this small series of highly treatment refractory patients, and treatment with the mTOR inhibitor (mTOR-I), sirolimus induced clinically beneficial responses. While these data are promising, a larger more comprehensive evaluation of mTOR activation in iMCD is needed in order to translate mTOR-Is into the clinic.
PI3K/Akt/mTOR is a signaling pathway central to protein synthesis, cellular proliferation, and metabolism.12 mTOR is a serine-threonine kinase that functions through 2 protein complexes, mTORC1 and mTORC2. mTORC1 regulates protein synthesis and cell growth through multiple pathways, including 2 well-characterized downstream molecules, 4E-BP1 and ribosomal protein 70S6 kinase (70S6K).13 Upon activation, mTORC1 phosphorylates 4E-BP1 (p4EBP1) and 70S6K (p70S6K), which subsequently phosphorylates ribosomal protein S6 (pS6).14-16 Expression of pS6, p70S6K, and p4EBP1 are well-established readouts of mTOR activation. mTORC1 function is tightly regulated by PI3K/Akt and amino acid availability and is sensitive to sirolimus, whereas mTORC2 is sensitive to growth factors but acutely refractory to sirolimus and partially sensitive to chronic administration.17 mTOR is activated during a number of cellular processes, including proliferation, angiogenesis, and T/B-cell activation.18-20
mTOR-Is have been used successfully in treatment-refractory malignancies and autoimmune syndromes that demonstrate clinicopathological overlap with iMCD, including Hodgkin lymphoma (HL), systemic lupus erythematosus (SLE), and autoimmune lymphoproliferative syndrome (ALPS). mTOR-Is are effective at inhibiting lymphoproliferation, vascular endothelial growth factor production, and disease symptoms.21-23 Based on our preliminary data in 3 patients11 and mTOR’s role in other lymphoproliferative diseases,24-32 we hypothesized that mTOR signaling is dysregulated in iMCD and a candidate drug target.
To test our hypothesis, we investigated mTOR signaling in iMCD. Our results demonstrated increased mTOR activation in iMCD lymph node tissue compared with controls. Although HHV-8 is known to be able to directly activate mTOR in other diseases,33 this is the first study to quantify mTOR activation in HHV-8–associated MCD. mTOR activation was similar across HHV-8–associated MCD and both clinical subtypes of iMCD. However, the iMCD cases trended toward being greater than in UCD. mTOR activation in iMCD was also increased compared with reactive lymph nodes as well as lymph nodes from HL and SLE, 2 diseases that can involve lymphadenopathy and are sensitive to mTOR-Is.22,23,34,35 Furthermore, the degree of mTOR activation in iMCD was similar to ALPS, a disease known to be driven by mTOR hyperactivation and successfully treated with mTOR-Is.21 These results support mTOR as a therapeutic target in iMCD, which has led us to develop a clinical trial using sirolimus in iMCD (NCT03933904), and reveal a path for personalized medicine discoveries in other lymphoproliferative and orphan diseases.
Methods
Patient samples
Lymph node tissue samples were collected from patients with CD as part of the University of Pennsylvania’s ACCELERATE Natural History Registry (NCT02817997) and CD biobank. All subjects gave written informed consent, and the studies were approved by local institutional review boards in accordance with the provision of the Declaration of Helsinki and Good Clinical Practice Guidelines. The samples were taken from the diagnostic lymph node biopsy and procured following formalin-fixation paraffin embedding (FFPE). Correlative clinical data associated with each FFPE sample were retrieved. Review of clinical data and histopathological reports was consistent with CD.1
Lymph node tissue resected from breast cancer patients negative for metastasis were chosen to represent normal controls (sentinels). Sentinel, SLE, ALPS, HL, and reactive lymph node samples were procured from the University of Pennsylvania pathology department.
IHC
IHC staining of 5-µm-thick FFPE lymph node slides was performed at the Pathology Core at the Children’s Hospital of Philadelphia on a Leica Bond Max automated staining system (Leica Biosystems) using the Bond Intense R staining kit (Leica Biosystems DS9263). Specific information for each antibody (pS6, p6EBP1, and p70S6K) is provided in supplemental Methods S1.1 (available on the Blood Web site). Slides were digitally scanned at ×20 magnification on an Aperio ScanSope CS-O slide scanner (Leica Biosystems).
The regions of each secondary follicle, including the germinal center and mantle zone, and interfollicular space were annotated using Aperio ImageScope in a blinded fashion. Annotations were subsequently audited and verified by a second researcher. For each IHC stain, Image Analysis Toolkit software (color deconvolution v9 algorithm) was used to estimate the staining strength of pixels. The percentage of areas with none, weak, medium, and strong staining was retrieved for each region.
Statistical analysis
Compositional analysis was performed to statistically compare IHC staining proportions between subjects and controls. Proportion data were converted using the centrometric log-ratio transformation. Compositional analysis is optimal when comparing multiple proportions, which are bounded from 0 to 1 and sum to 1.36-39 Before transformation, 0 proportions were replaced by 1 μm2 divided by the annotated area (in units of μm2), because the maximum resolution of the measurements is ∼1 μm due to the probing light’s wavelength.
First, a simple comparison, ignoring staining strength, between positively stained and nonstained areas was performed (“2-compositional” analysis). Second, for comparisons with significant differences in total stained proportions, we explored the difference in negative, weak, medium, and strong staining (“4-compositional” analysis). The nonparametric Mann-Whitney U test was used to compare subjects and controls.40-42 For all comparisons, statistical significance was set at P < .05. We used a 1-sided U test for experiments where we hypothesized a priori that there would be increased expression; this was the case for each experiment comparing iMCD to sentinel and reactive controls. For all other comparisons, we used a 2-sided test to evaluate for significant differences. Effect size methodology is presented in supplemental Methods S1.4.
Immunofluorescence and proteomics analysis
Methodological details for coimmunofluorescence (co-IF), proteomics, and phospho-flow cytometry are provided in supplemental Methods S1.
Results
pS6-expression is significantly increased in the interfollicular space of iMCD-TAFRO
To investigate our hypothesis that mTOR activation is increased in iMCD lymph node tissue, we performed IHC for pS6 in lymph node tissue from iMCD-TAFRO patients, who exhibit the most severe clinical phenotype (Table 1).1 We chose iMCD-TAFRO cases for our first study because of their strong phenotype and our prior preliminary data.11 We compared pS6 staining in 10 iMCD-TAFRO samples (cohort 1) against 5 metastasis-free sentinel lymph nodes from breast cancer patients to represent normal controls.
Clinical characteristics of the iMCD cohorts
| iMCD-TAFRO, cohort 1 (N = 10) | iMCD-TAFRO, cohort 2 (N = 10) | iMCD-NOS (N = 6) | |
|---|---|---|---|
| Age, y; mean (range) | 30 (1-65) | 38 (17-67) | 46 (30-62) |
| Sex, female:male | 3:7 | 5:5 | 2:4 |
| TAFRO criteria, present/assessed | |||
| Thrombocytopenia | 10/10 | 10/10 | 0/6 |
| Anasarca or edema | 10/10 | 10/10 | 0/6 |
| Constitutional symptoms | 10/10 | 10/10 | 6/6 |
| Reticulin myelofibrosis | 7/8 | 4/5 | 3/3 |
| Renal dysfunction | 4/10 | 5/10 | 1/6 |
| Hepatomegaly and/or splenomegaly | 8/10 | 10/10 | 3/5 |
| Inflammation and organ dysfunction | |||
| CRP, mg/L | N = 7 | N = 8 | N = 3 |
| Mean (SD) | 140 (66) | 134 (123) | 89 (79) |
| IL-6/ULN | N = 7 | N = 3 | |
| Mean (SD) | 2.3 (1.29) | 7 (7) | N.A. |
| VEGF/ULN | N = 7 | N = 4 | N = 4 |
| Mean (SD) | 4 (2) | 8 (10) | 3 (4) |
| IgG, mg/dL | N = 9 | N = 7 | N = 4 |
| Mean (SD) | 1040 (571) | 1500 (820) | 3900 (2780) |
| Albumin, g/dL | N = 10 | N = 9 | N = 6 |
| Mean (SD) | 2.5 (0.5) | 2.2 (0.8) | 3.1 (0.8) |
| Creatinine, mg/dL | N = 10 | N = 10 | N = 6 |
| Mean (SD) | 1.3 (0.9) | 1.6 (1.3) | 0.9 (0.2) |
Not all symptoms and laboratory values were assessed for every patient; therefore, the ratios of symptoms present over those assessed are given for the TAFRO criteria, and the specific sample sizes are shown for each laboratory value provided.
IgG, immunoglobulin G; SD, standard deviation; ULN, upper limits of normal; VEGF, vascular endothelial growth factor.
Based on positively stained area, pS6 expression was significantly elevated in both the mantle zone (P = .038) and the interfollicular space of the iMCD-TAFRO lymph node tissue (P = .003). Nonsignificantly increased expression was observed in the follicles and germinal centers (Figure 1A). Next, we investigated whether there were differences in the various staining intensities between iMCD-TAFRO and sentinel nodes in the interfollicular space. The iMCD-TAFRO cases likewise had significantly higher medium and strong staining in the interfollicular space, demonstrating a shift toward increased mTOR activation (Figure 1B).
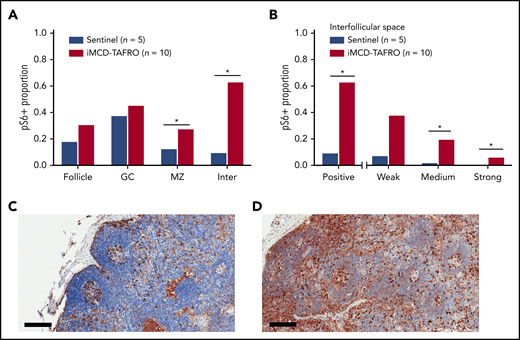
pS6 staining in lymph node tissue. (A) Stained pS6 area proportion at different lymph node structures for the first cohort of iMCD-TAFRO patients (cohort 1, n = 10) compared with a control group of sentinel lymph nodes (n = 5). Statistical significance, denoted by an asterisk, was calculated using 2-compositional analysis of the centrometric log-rate transformation of the proportions. There were significant increases in pS6 staining in the mantle zone (P = .038) and interfollicular space (P = 3.3 × 10⁻⁴), and nonsignificant increases for the entire follicle (P = .050) and germinal center (P = .19). (B) Comparison of various staining intensity proportions of the interfollicular space for cohort 1 and the control group. The results indicate that the iMCD-TAFRO cases had significantly higher medium (P = 3 × 10⁻⁴) and strong (P = 6 × 10⁻⁴) staining. (C-D) Representative images of pS6 (brown) staining for a sentinel lymph node (C) and an iMCD-TAFRO lymph node (D). Hematoxylin counterstain provides a blue nuclear stain to assess cell and tissue morphology. Scale bars, 200 µm. *P < .05, **P < .01. GC, germinal center; Inter, interfollicular space; MZ, mantle zone.
pS6 staining in lymph node tissue. (A) Stained pS6 area proportion at different lymph node structures for the first cohort of iMCD-TAFRO patients (cohort 1, n = 10) compared with a control group of sentinel lymph nodes (n = 5). Statistical significance, denoted by an asterisk, was calculated using 2-compositional analysis of the centrometric log-rate transformation of the proportions. There were significant increases in pS6 staining in the mantle zone (P = .038) and interfollicular space (P = 3.3 × 10⁻⁴), and nonsignificant increases for the entire follicle (P = .050) and germinal center (P = .19). (B) Comparison of various staining intensity proportions of the interfollicular space for cohort 1 and the control group. The results indicate that the iMCD-TAFRO cases had significantly higher medium (P = 3 × 10⁻⁴) and strong (P = 6 × 10⁻⁴) staining. (C-D) Representative images of pS6 (brown) staining for a sentinel lymph node (C) and an iMCD-TAFRO lymph node (D). Hematoxylin counterstain provides a blue nuclear stain to assess cell and tissue morphology. Scale bars, 200 µm. *P < .05, **P < .01. GC, germinal center; Inter, interfollicular space; MZ, mantle zone.
pS6 expression is consistent across subtypes of iMCD and trends toward being increased compared with UCD
After demonstrating increased mTOR activation in the first iMCD-TAFRO cohort (cohort 1), we studied pS6 expression across all CD subtypes. We compared lymph node tissue expression of pS6 in a second cohort of 10 iMCD-TAFRO cases (cohort 2), 6 iMCD-NOS, 4 HHV-8–associated MCD, and 7 UCD cases. There was similar expression of pS6 across both clinical subtypes of iMCD, as well as HHV-8–associated MCD (Figure 2A). In the UCD cases, there was a trend toward decreased pS6 staining in the mantle zone (P = .065) and interfollicular space (P = .089) compared with the combined iMCD-TAFRO and iMCD-NOS subgroup. Of note, the stained area proportion from this separate cohort of iMCD-TAFRO cases (cohort 2) was similar to that of cohort 1 in the experiment comparing iMCD-TAFRO and sentinel lymph nodes only, validating the increased mTOR activation observed in the previous cohort.
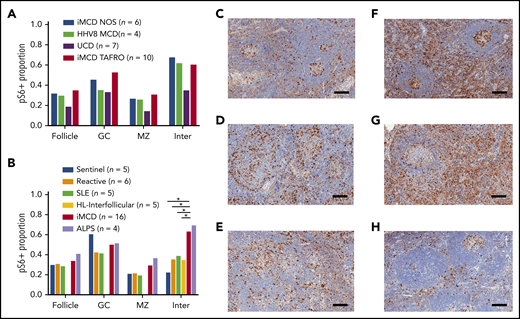
Comparison of pS6 staining across CD subtypes and other lymphoproliferative diseases. (A) pS6 across different CD subtypes. A second cohort of iMCD-TAFRO patients (cohort 2, n = 10) was compared with iMCD-NOS (n = 6), HHV-8–associated MCD (HHV8 MCD, n = 4), and UCD (n = 7). The proportion of pS6 staining was similar across both clinical subtypes of iMCD as well as HHV-8–associated MCD. Comparison between the combined iMCD cases (n = 16) and the UCD cases (n = 4) showed nonsignificant increase in pS6-staining of the germinal center (P = .17), mantle zone (P = .065), and interfollicular space (P = .089). Of note, a 1-tailed test comparing expression in the interfollicular space of iMCD to UCD would have been significant, but the a priori hypothesis involved testing for difference, not directional difference. (B) The second cohort of iMCD-TAFRO patients and the iMCD-NOS cases were combined and compared with a control group of sentinel lymph nodes, a second control group of reactive lymph nodes, and to 3 other diseases involving lymphoproliferation and inflammatory lymphadenopathy: SLE, HL, and ALPS. pS6 could only be assessed in the interfollicular space of the HL cases due to disruption of the remainder of lymph node architecture. ALPS and iMCD had similar pS6 staining; the iMCD group had significantly higher staining in the interfollicular space compared with SLE, HL, reactive nodes, and sentinel nodes (P = .001, .01, .032, and .019, respectively). (C-H) Representative images of pS6-stained (brown) lymph node tissue (with blue hematoxylin counterstain) for (C) reactive lymph nodes, (D) SLE, (E) HL, (F) iMCD-TAFRO, (G) ALPS, and (H) UCD. Scale bars, 200 µm. *P < .05, **P < .01.
Comparison of pS6 staining across CD subtypes and other lymphoproliferative diseases. (A) pS6 across different CD subtypes. A second cohort of iMCD-TAFRO patients (cohort 2, n = 10) was compared with iMCD-NOS (n = 6), HHV-8–associated MCD (HHV8 MCD, n = 4), and UCD (n = 7). The proportion of pS6 staining was similar across both clinical subtypes of iMCD as well as HHV-8–associated MCD. Comparison between the combined iMCD cases (n = 16) and the UCD cases (n = 4) showed nonsignificant increase in pS6-staining of the germinal center (P = .17), mantle zone (P = .065), and interfollicular space (P = .089). Of note, a 1-tailed test comparing expression in the interfollicular space of iMCD to UCD would have been significant, but the a priori hypothesis involved testing for difference, not directional difference. (B) The second cohort of iMCD-TAFRO patients and the iMCD-NOS cases were combined and compared with a control group of sentinel lymph nodes, a second control group of reactive lymph nodes, and to 3 other diseases involving lymphoproliferation and inflammatory lymphadenopathy: SLE, HL, and ALPS. pS6 could only be assessed in the interfollicular space of the HL cases due to disruption of the remainder of lymph node architecture. ALPS and iMCD had similar pS6 staining; the iMCD group had significantly higher staining in the interfollicular space compared with SLE, HL, reactive nodes, and sentinel nodes (P = .001, .01, .032, and .019, respectively). (C-H) Representative images of pS6-stained (brown) lymph node tissue (with blue hematoxylin counterstain) for (C) reactive lymph nodes, (D) SLE, (E) HL, (F) iMCD-TAFRO, (G) ALPS, and (H) UCD. Scale bars, 200 µm. *P < .05, **P < .01.
pS6-expression in iMCD is similar to ALPS and increased compared with other lymphoproliferative diseases
To assess whether the increased mTOR activation observed across these iMCD patients was a product of nonspecific lymphoproliferation, we compared pS6 expression in iMCD against reactive lymph nodes, lymph nodes from 2 diseases that demonstrate clinicopathological overlap with iMCD and involve lymphoproliferation (HL) and inflammatory lymphadenopathy (SLE), and 1 lymphoproliferative disease that is driven by mTOR hyperactivation and treated first line with mTOR-Is (ALPS).21,23 Based on the previous result demonstrating similar pS6 staining across iMCD-TAFRO (cohort 2) and iMCD-NOS, we combined the 16 iMCD cases in the previous experiment and compared them with 5 SLE, 5 HL, 4 ALPS, 6 reactive, and 5 sentinels. We hypothesized that iMCD lymph node tissue would have increased pS6 expression in the interfollicular space compared with reactive lymph nodes and similar expression to the other lymphoproliferative disorders. As expected, pS6 expression was increased in the interfollicular space of iMCD lymph nodes compared with reactive lymph nodes (P = .013). Surprisingly, iMCD patients had significantly increased interfollicular pS6 expression compared with HL (P =.019) and SLE (P =.032) (Figure 2B). Further, the level of pS6 expression in iMCD was similar to that in ALPS. To investigate a potential clinical correlate of these results, we compared pS6 expression in iMCD patients who were responsive (n = 11) and nonresponsive (n = 7) to anti-IL-6 therapy. There were no significant differences, but there was a nonsignificant trend toward increased pS6 staining in the follicles of nonresponders (P = .097) (supplemental Figure 1A). Together, these results suggest that the increased pS6 expression, and thus mTOR activation, in iMCD is not a product of nonspecific lymphoproliferation and may point to a pathogenic role for mTOR in iMCD.
Other mTOR effectors and readouts of mTOR activation, p4EBP1 and p70S6K, are also elevated in iMCD
To investigate mTOR activation in iMCD from an orthogonal direction, we studied expression of 2 other readouts of mTORC1 activation, p4EBP1 and p70S6K (Figure 3A). Investigation of other mTORC1 effectors was important, as there are reports of pathogens that can bypass mTORC1 and directly activate its effectors.44,45 In the first experiment, lymph node tissue from 10 iMCD-TAFRO patients in cohort 1, 5 sentinel nodes, and 4 reactive controls was stained for p4EBP1 (Figure 3B). Staining was significantly higher in the iMCD-TAFRO patients in the interfollicular space compared with sentinel and reactive control groups. p4EBP1 staining was also significantly increased in the mantle zones, germinal centers, and follicles compared with reactive lymph nodes. Increased p4EBP1, most notably in the interfollicular space, provides an orthogonal data set, indicating increased mTOR activation in iMCD.
![Investigation of other mTOR effectors. (A) Simplified diagram of 3 key effectors of mTORC1. (B) Stained p4EBP1 area proportion in different lymph node regions for the first cohort of iMCD-TAFRO patients compared with 2 control groups: reactive and sentinel lymph nodes. The stained area proportion at the interfollicular space was significantly higher than the reactive and sentinel lymph nodes (P = .0034 and .0013, respectively). (C) Comparison of p70S6K stained area proportions for iMCD (n = 6) vs reactive lymph nodes. There was a nonsignificant elevation for iMCD across the follicle, germinal center, and the interfollicular spaces (P = .17 for all 3 comparisons). (D) Effect size comparison among the 3 mTORC1 effectors. Hedges’ g, an effect size utilizing the mean difference standardized by the deviation, was calculated for the iMCD-TAFRO to reactive lymph node comparison for the 3 stains in the interfollicular space. The 3 results were combined by random effects (RE) model, as we are testing effects related to mTOR activation. Synthesis by RE model yielded a combined significant effect size of 1.68 [95% CI, 0.52-2.84, Q(df=2) = 4.7, I2 = 56%]. For comparison, the Hedges’ g for ALPS in the individual pS6 experiment was 1.64 [0.18, 3.09]. (E-F) Representative images are shown of p4EBP1 staining (brown) for reactive lymph node (E) and iMCD-TAFRO (F). (G-H) Representative images are provided for p70S6K staining (brown) for reactive lymph nodes (G) and iMCD-TAFRO (H). All representative images have hematoxylin counterstain (blue) as a nuclear stain. Bar = 200 µm. *P < .05, **P < .01.](https://ash.silverchair-cdn.com/ash/content_public/journal/blood/135/19/10.1182_blood.2019002792/1/m_bloodbld2019002792f3.png?Expires=1769530354&Signature=0PFykTZNe64YdDR8gswyIxDxAXYXu1EIt5E3HLRbThH4ubvfSZQKGFQl5hi9ZbNPusYg~mLr5G32vz9yTPyxWDdiaxnchosBY-RSwnt~sbzA4yP93R2BHoxYgOQiY7qORpbQZcsbAVje5UQAHJwbntXrweT7VSRRLn1whuFXI2Dzi1FeIXA3vBheVPaA3FEWmqyFBXISCWvz472qRom~po0aIdfOYo~Dd7IcCSZEhkmOk4YQzkM4P7TtIOUpXfqjjjdN5m9sfFbNOCNGWdW4V4ci4cJCEKzwa75pUhvqtJOfQRWsc18Qt4WauUs7kgHvLm0NkDuUN~CCGJKYKyWu4w__&Key-Pair-Id=APKAIE5G5CRDK6RD3PGA)
Investigation of other mTOR effectors. (A) Simplified diagram of 3 key effectors of mTORC1. (B) Stained p4EBP1 area proportion in different lymph node regions for the first cohort of iMCD-TAFRO patients compared with 2 control groups: reactive and sentinel lymph nodes. The stained area proportion at the interfollicular space was significantly higher than the reactive and sentinel lymph nodes (P = .0034 and .0013, respectively). (C) Comparison of p70S6K stained area proportions for iMCD (n = 6) vs reactive lymph nodes. There was a nonsignificant elevation for iMCD across the follicle, germinal center, and the interfollicular spaces (P = .17 for all 3 comparisons). (D) Effect size comparison among the 3 mTORC1 effectors. Hedges’ g, an effect size utilizing the mean difference standardized by the deviation, was calculated for the iMCD-TAFRO to reactive lymph node comparison for the 3 stains in the interfollicular space. The 3 results were combined by random effects (RE) model, as we are testing effects related to mTOR activation. Synthesis by RE model yielded a combined significant effect size of 1.68 [95% CI, 0.52-2.84, Q(df=2) = 4.7, I2 = 56%]. For comparison, the Hedges’ g for ALPS in the individual pS6 experiment was 1.64 [0.18, 3.09]. (E-F) Representative images are shown of p4EBP1 staining (brown) for reactive lymph node (E) and iMCD-TAFRO (F). (G-H) Representative images are provided for p70S6K staining (brown) for reactive lymph nodes (G) and iMCD-TAFRO (H). All representative images have hematoxylin counterstain (blue) as a nuclear stain. Bar = 200 µm. *P < .05, **P < .01.
Investigation of other mTOR effectors. (A) Simplified diagram of 3 key effectors of mTORC1. (B) Stained p4EBP1 area proportion in different lymph node regions for the first cohort of iMCD-TAFRO patients compared with 2 control groups: reactive and sentinel lymph nodes. The stained area proportion at the interfollicular space was significantly higher than the reactive and sentinel lymph nodes (P = .0034 and .0013, respectively). (C) Comparison of p70S6K stained area proportions for iMCD (n = 6) vs reactive lymph nodes. There was a nonsignificant elevation for iMCD across the follicle, germinal center, and the interfollicular spaces (P = .17 for all 3 comparisons). (D) Effect size comparison among the 3 mTORC1 effectors. Hedges’ g, an effect size utilizing the mean difference standardized by the deviation, was calculated for the iMCD-TAFRO to reactive lymph node comparison for the 3 stains in the interfollicular space. The 3 results were combined by random effects (RE) model, as we are testing effects related to mTOR activation. Synthesis by RE model yielded a combined significant effect size of 1.68 [95% CI, 0.52-2.84, Q(df=2) = 4.7, I2 = 56%]. For comparison, the Hedges’ g for ALPS in the individual pS6 experiment was 1.64 [0.18, 3.09]. (E-F) Representative images are shown of p4EBP1 staining (brown) for reactive lymph node (E) and iMCD-TAFRO (F). (G-H) Representative images are provided for p70S6K staining (brown) for reactive lymph nodes (G) and iMCD-TAFRO (H). All representative images have hematoxylin counterstain (blue) as a nuclear stain. Bar = 200 µm. *P < .05, **P < .01.
Next, we investigated p70S6K, another target of mTORC1 and readout of mTOR activation, which phosphorylates S6.15 p70S6K expression in 6 lymph node samples from iMCD-TAFRO patients (split between both cohorts 1 and 2) was compared with 6 reactive lymph nodes (Figure 3C). The p70S6K-stained area in the iMCD-TAFRO patients trended toward an increase compared with the controls, although the sample size was small, and it was not significant (P =.089). This result is supportive of increased mTOR activation in the context of separate experiments demonstrating increased pS6 expression in 2 independent cohorts as well as increased p4EBP1 expression. An effect size analysis of the 3 antibody stains shows comparable effects across all 3 and a combined effect size that is significant (Figure 3D).
Multiple cell populations in the interfollicular space express pS6
Once increased mTOR activation in the interfollicular space of iMCD lymph node tissue was clearly established, we sought to identify a cell type harboring the increased mTOR activation. We hypothesized that T cells would represent the largest proportion of pS6+ cells in the interfollicular space, given the location in the lymph node and reports of T-cell expansion and activation in iMCD.11 We performed co-IF for pS6 and key lineage markers on iMCD-TAFRO patients with sufficient unstained lymph node tissue available for serial co-IF experiments (n = 4). Despite the small sample size, we expected to be able to determine if a single cell type, such as T cells, was responsible for the increased pS6. Surprisingly, T cells accounted for 2% to 10% of the pS6+ cells in the interfollicular space of these four patients (Figure 4A). Most pS6+ cells were CD45+, indicating hematopoietic lineage. The combined proportions of the cell-specific stains performed (CD3, CD20, CD68, and CD138; Figure 4B) added up to the approximate proportion of CD45+ cells, providing an internal quality control. Furthermore, the transcription factor MUM1, which is expressed on activated T cells, B cells, and plasma cells, had approximately the same proportion of pS6+ cells as the T-cell, B-cell, and plasma-cell markers combined, providing another internal quality control. The proportions of both plasma cells (CD138; N = 4; P =.029) and macrophages (CD68; N = 4; P =.029) were higher than T cells, and they trended toward being increased compared with B cells (N = 3; P = .10). Though this sample size is too small to identify the cell type representing the most pS6+ cells, these results indicate that multiple cell populations are expressing pS6 in the interfollicular space of iMCD.
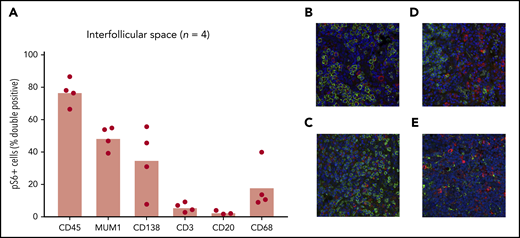
Identification of cell types with increased mTOR activation. (A) Co-IF for CD45, MUM1, CD138, CD3, CD20, and CD68 was performed to identify the cell types expressing pS6 in 4 iMCD-TAFRO cases (CD20 staining was only performed in 3 cases). Representative images (×20) are shown in panels B-E, where pS6 was stained red and the cell specific marker green: (B) CD138, (C) CD3, (D) CD20, (E) CD68. Labeled cells were manually counted to assess for percentage of pS6+ cells. A majority of pS6+ cells were of the hematopoietic lineage (CD45+). Only a small fraction (2% to 10%) of pS6+ cells were T cells (CD3+). A large proportion of cells expressed the transcription factor MUM1, which is expressed on activated B cells, T cells, and plasma cells. Plasma cells (CD138+) and macrophages (CD68+) also made up a large proportion of pS6+ cells.
Identification of cell types with increased mTOR activation. (A) Co-IF for CD45, MUM1, CD138, CD3, CD20, and CD68 was performed to identify the cell types expressing pS6 in 4 iMCD-TAFRO cases (CD20 staining was only performed in 3 cases). Representative images (×20) are shown in panels B-E, where pS6 was stained red and the cell specific marker green: (B) CD138, (C) CD3, (D) CD20, (E) CD68. Labeled cells were manually counted to assess for percentage of pS6+ cells. A majority of pS6+ cells were of the hematopoietic lineage (CD45+). Only a small fraction (2% to 10%) of pS6+ cells were T cells (CD3+). A large proportion of cells expressed the transcription factor MUM1, which is expressed on activated B cells, T cells, and plasma cells. Plasma cells (CD138+) and macrophages (CD68+) also made up a large proportion of pS6+ cells.
mTORC1 serum proteomic signature in iMCD
Next, we applied an orthogonal method to determine if there was a proteomic signature of increased mTORC1 signaling in serum from iMCD patients. Since iMCD is a systemic inflammatory disorder, we hypothesized that proteins associated with mTORC1 signaling would be enriched in the serum of iMCD patients in the midst of active disease compared with healthy controls. To test this hypothesis, we performed gene set enrichment analysis (GSEA) specifically for mTORC1 signaling on data from a proteomics study quantifying 1139 serum analytes in 88 iMCD patients and 42 healthy controls. A separate study (S.K.P. and D.C.F., manuscript submitted January 2020) comprehensively analyzed these proteomic data but did not include GSEA analysis comparing all iMCD patients to healthy controls for the mTORC1 signaling pathway or others. Genes involved in the mTORC1 signaling pathway were significantly enriched in iMCD compared with healthy donors (false discovery rate [FDR], 0.243) (Figure 5). These data support a role for mTOR activation in iMCD.
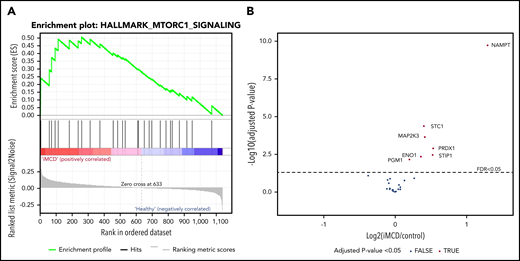
mTORC1 gene set enrichment in serum proteomics (A) GSEA of serum proteomic data from 88 iMCD patients compared with 42 healthy controls. In iMCD, genes involved in the mTORC1 signaling pathway were significantly enriched (FDR, 0.243) below the FDR set at 0.25. This targeted GSEA of mTORC1 signaling was performed in addition to and separately from a comprehensive proteomics analysis carried out by coauthors (S.K.P. and D.C.F., manuscript submitted January 2020) that did not include GSEA analysis comparing all iMCD patients to healthy controls for the mTORC1 signaling pathway or others. (B) Volcano plot for iMCD vs controls of the mTORC1 genes/proteins quantified with the SOMAscan platform. The cutoff for significance is indicated by the dotted line (FDR ≤0.05). The 7 significantly different genes are all labeled and increased in iMCD compared with healthy controls. All positive fold-change values belong to the proteins that are increased in the iMCD group compared with healthy controls.
mTORC1 gene set enrichment in serum proteomics (A) GSEA of serum proteomic data from 88 iMCD patients compared with 42 healthy controls. In iMCD, genes involved in the mTORC1 signaling pathway were significantly enriched (FDR, 0.243) below the FDR set at 0.25. This targeted GSEA of mTORC1 signaling was performed in addition to and separately from a comprehensive proteomics analysis carried out by coauthors (S.K.P. and D.C.F., manuscript submitted January 2020) that did not include GSEA analysis comparing all iMCD patients to healthy controls for the mTORC1 signaling pathway or others. (B) Volcano plot for iMCD vs controls of the mTORC1 genes/proteins quantified with the SOMAscan platform. The cutoff for significance is indicated by the dotted line (FDR ≤0.05). The 7 significantly different genes are all labeled and increased in iMCD compared with healthy controls. All positive fold-change values belong to the proteins that are increased in the iMCD group compared with healthy controls.
The proportions of pS6+ circulating monocytes and T cells are increased at baseline in iMCD and augmented upon IL-6 stimulation in a JAK1/2-dependent manner
To investigate a potential mechanism underlying the increased mTORC1 activation observed in iMCD, we performed functional studies on 8 peripheral blood mononuclear cell samples from iMCD-TAFRO patients in remission and 8 healthy controls. As IL-6 is the pathogenic driver in some iMCD patients and capable of inducing mTOR activation, we stimulated peripheral blood mononuclear cells with IL-6 and measured pS6 expression by phospho-flow cytometry in CD14+ monocytes, CD4+ T cells, and CD8+ T cells. At baseline, the proportion of pS6+ monocytes (P = .005) and CD4+ T cells (P = .014) was increased in iMCD patients compared with healthy controls; CD8+ T cells were not different (P = .32) (Figure 6A-C). Upon stimulation with IL-6, the proportions of pS6+ cells were significantly higher in iMCD at all time points. Two-way analysis of variance compositional analysis, using all time points and iMCD/healthy control membership as factors (Figure 6A-C), showed that there were significantly higher proportions of pS6+ cells in iMCD compared with healthy controls in all 3 cell populations: CD14+ monocytes (P = 5.8 × 10⁻⁸), CD4+ T cells (P = 4.6 × 10⁻⁷), and CD8+ T cells (P = 4.2 × 10⁻⁶). Paired analysis between baseline and 120 minutes of IL-6 stimulation revealed significantly increased proportions of pS6+ cells for CD4+ (P = .004) and CD8+ (P = .004) T cells in iMCD patients and not in healthy controls (Figure 6E-F). A similar trend was also seen in IL-6–stimulated monocytes from iMCD patients (P = .13) (Figure 6D). These results suggest that hyperresponsiveness to IL-6 may underlie the increased mTOR activation we observed in iMCD.
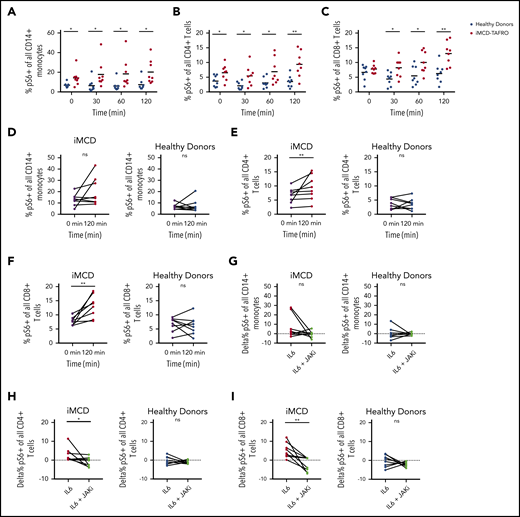
Increased mTOR signaling at baseline and upon stimulation with IL-6. PBMCs from 8 healthy donors and 8 iMCD-TAFRO patients in remission were left untreated, treated with 25 ng/mL IL-6, or treated with IL-6 and the JAK inhibitor ruxolitinib (1μM). (A-C) Kinetics of IL-6–mediated phosphorylation of S6 protein in CD14+ monocytes (A), CD4+ T cells (B), and CD8+ T cells (C) from healthy donors (blue) and iMCD patients in remission (red). Mixed analysis of variance analysis of the center-log-transformed proportions (compositional analysis) yielded that the proportion of pS6+ cells is higher for CD14+ monocytes (P = 6.0 × 10⁻⁸), CD4+ T cells (P = 4.6 × 10⁻⁷), and CD8+ T cells (P = 4.2 × 10⁻⁶) across the time measurements in iMCD compared with healthy controls. Compositional analysis specific to each time was also calculated using unpaired 1-tailed Mann-Whitney U tests, and the significance is denoted in panels A-C by asterisks. (D-F) Paired comparison of the frequency of pS6+ monocytes, CD4+ T cells, and CD8+ T cells at 0 minutes (black) and 120 minutes of stimulation with IL-6 for iMCD patient (red) and healthy donor samples (blue). P values from Wilcoxon signed-rank test on the transformed proportions. Since there is a <1% probability that 2 events with <.05 (individual type I error) occurs twice in only the subjects and not the controls, the results were considered statistically significant without a need for P-value adjustment approximations. (G-I) Paired comparison of the frequency of pS6+ monocytes (G), CD4+ T cells (H), and CD8+ T cells (I) following treatment with IL-6 alone or following treatment with IL-6 and the JAK inhibitor, ruxolitinib, for iMCD patient and healthy donor samples. *P < .05, **P < .01 by Wilcoxon signed-rank test. ns, not significant.
Increased mTOR signaling at baseline and upon stimulation with IL-6. PBMCs from 8 healthy donors and 8 iMCD-TAFRO patients in remission were left untreated, treated with 25 ng/mL IL-6, or treated with IL-6 and the JAK inhibitor ruxolitinib (1μM). (A-C) Kinetics of IL-6–mediated phosphorylation of S6 protein in CD14+ monocytes (A), CD4+ T cells (B), and CD8+ T cells (C) from healthy donors (blue) and iMCD patients in remission (red). Mixed analysis of variance analysis of the center-log-transformed proportions (compositional analysis) yielded that the proportion of pS6+ cells is higher for CD14+ monocytes (P = 6.0 × 10⁻⁸), CD4+ T cells (P = 4.6 × 10⁻⁷), and CD8+ T cells (P = 4.2 × 10⁻⁶) across the time measurements in iMCD compared with healthy controls. Compositional analysis specific to each time was also calculated using unpaired 1-tailed Mann-Whitney U tests, and the significance is denoted in panels A-C by asterisks. (D-F) Paired comparison of the frequency of pS6+ monocytes, CD4+ T cells, and CD8+ T cells at 0 minutes (black) and 120 minutes of stimulation with IL-6 for iMCD patient (red) and healthy donor samples (blue). P values from Wilcoxon signed-rank test on the transformed proportions. Since there is a <1% probability that 2 events with <.05 (individual type I error) occurs twice in only the subjects and not the controls, the results were considered statistically significant without a need for P-value adjustment approximations. (G-I) Paired comparison of the frequency of pS6+ monocytes (G), CD4+ T cells (H), and CD8+ T cells (I) following treatment with IL-6 alone or following treatment with IL-6 and the JAK inhibitor, ruxolitinib, for iMCD patient and healthy donor samples. *P < .05, **P < .01 by Wilcoxon signed-rank test. ns, not significant.
Having observed increased IL-6–mediated induction of pS6 in iMCD remission samples, we then asked whether this increased phosphorylation of S6 is dependent on JAK1/2 signaling, which is an established mediator of IL-6–driven STAT3 and mTOR signaling. We treated iMCD and healthy donor peripheral blood mononuclear cells (PBMCs) with the JAK1/2 inhibitor ruxolitinib. In iMCD, we observed a significant reduction in the frequency of pS6+ CD8+ (P = .004) and CD4+ (P = .039) T cells and a nonsignificant reduction in CD14+ (P = .13) monocytes (Figure 6G-I). No significant reductions were observed for the healthy donor PBMCs. Together, these data suggest that the increased mTOR signaling observed in iMCD patients could be driven by baseline hyperresponsiveness to JAK-dependent IL-6 signaling.
Discussion
This study represents the first systematic investigation of a candidate pathogenic signaling pathway in iMCD and the largest published sample of CD lymph node tissue. This is also the first published comparison of mTOR activation in lymph nodes across multiple lymphoproliferative diseases. Our results indicate that mTOR activation is increased in cells of the interfollicular space of iMCD lymph node tissue, as demonstrated by significantly elevated expression of 2 primary effectors of mTORC1 (pS6 and p4EBP1) compared with multiple control groups. Furthermore, a nonsignificant elevation (P = .08) of a third effector of mTORC1, p70S6K, was observed in a smaller sample set (n = 6). Similar analyses have been used to associate mTOR activation with disease pathogenesis in other diseases such as posttransplant lymphoproliferative disorders and low-grade gliomas.24,46 Importantly, pS6 expression was increased in iMCD patients, even when compared with reactive lymph nodes as well as lymph nodes from HL and SLE, 2 disorders with clinicopathological overlap with iMCD and known to involve mTOR activation and to be sensitive to mTOR-Is. These results indicate that the level of increased mTOR activation in iMCD is not simply a product of nonspecific lymphoproliferation or inflammation. However, our data also indicate that the mTOR activation is not specific to iMCD only. In fact, expression of pS6 was similar to ALPS, which is known to be driven by mTOR hyperactivation and is sensitive to mTOR-Is. These data support a similar pathogenic role for mTOR activation in iMCD, particularly given the recent clinical responses to mTOR inhibition observed in anti-IL-6–refractory iMCD. The increased enrichment of mTORC1 signaling based on serum proteomics data are further supportive of increased mTOR activation in iMCD.
To investigate a potential mechanism underlying the increased mTOR activation in iMCD, we assessed mTOR activation in response to IL-6. IL-6, a pleomorphic cytokine that signals through JAK/STAT3, mitogen-activated protein kinase, and PI3K/Akt/mTOR, is elevated in the serum of iMCD patients and is the well-established driver of iMCD in a portion of patients. However, the mechanism through which IL-6 leads to iMCD pathogenesis and the mechanism underlying the increased mTOR activation are both currently unknown. Functional studies revealed increased baseline mTOR activation and hyperresponsiveness to IL-6 stimulation in PBMCs from iMCD patients in remission. Interestingly, JAK1/2 inhibition was capable of abrogating the increased mTOR activation observed in iMCD samples upon IL-6 stimulation. Further research is needed into the role that JAK1/2 inhibitors may be able to play in iMCD.
There are several important clinical implications of this research. These data expand upon our preliminary data suggesting increased mTOR activation is common in iMCD and is a potential therapeutic target. These data led us to launch an ongoing clinical trial of sirolimus in anti-IL-6–refractory iMCD (NCT03933904). This is the first clinical trial to date of a treatment of anti-IL-6–refractory iMCD, a patient population with significant unmet need. Furthermore, elevated mTOR expression in the interfollicular space of iMCD tissue could serve as a diagnostic biomarker for iMCD. Currently, diagnosis is very challenging, as there are no positive diagnostic biomarkers. Additional work is needed to investigate pS6 expression as a potential differentiator between iMCD and other disorders demonstrating overlapping histopathology. Another important potential clinical implication of this research is that pS6 staining of lymph nodes could be used in the future as a predictive biomarker for response to sirolimus, and potentially anti-IL-6 therapy, if the clinical trial provides data consistent with our hypothesis. Lastly, the trend toward a difference in mTOR activation between UCD and iMCD, the first indicator of different potentially pathogenic intracellular signaling mechanisms that we are aware of between UCD and iMCD, supports considering UCD and iMCD as different diseases possibly requiring different treatment approaches. However, it is important to note that although iMCD and UCD groups trended toward a difference, the distribution of UCD and iMCD cases still slightly overlapped, and the UCD cases had similar pS6 expression as HL and SLE, which are both sensitive to mTOR-Is. Therefore, additional studies are needed to investigate mTOR inhibition in UCD, especially if mTOR-Is are demonstrated to be active in iMCD.
The similar levels of mTOR activation between the iMCD cases and HHV-8-associated MCD cases may also have therapeutic implications. mTOR is known to be hyperactivated in Kaposi sarcoma, an HHV-8–associated disease.47,48 Importantly, mTOR inhibition was effective in a series of Kaposi sarcoma cases.49 Recently, the mechanism underlying mTOR hyperactivation by HHV-8 was elucidated to occur via inhibition of CASTOR1, itself an inhibitor of mTORC1, by microRNAs.33 Our study is the first to quantify mTOR activation in HHV-8–associated MCD to our knowledge. The similar level of increased mTOR activation between HHV-8–associated MCD, iMCD, and ALPS is important for at least 3 reasons: (1) it inspires further study into the use of sirolimus in HHV-8–associated MCD patients who fail rituximab, (2) it provides the first shared intracellular signaling dysregulation and mechanistic link between HHV-8–associated MCD and iMCD, and (3) it identifies candidate genes and microRNAs for future investigation in iMCD.
These data also provide potential insights into iMCD pathophysiology. Specifically, the histopathological hallmark of iMCD is the presence of atrophic or regressed germinal centers, which are replete of B cells and are often surrounded by expanded mantle zones. Recent research has identified a critical role for mTOR in the formation and development of normal germinal centers.20 Abrogating mTOR signaling prevents formation of germinal centers. Conversely, increased mTOR expression is observed in diffuse large B-cell lymphomas arising from germinal center B cells compared with other forms of diffuse large B-cell lymphoma.50 Though sirolimus may exert its effect through inhibition of the increased mTOR activation observed in this study, sirolimus may alternatively be blocking the formation of germinal centers, which are dysmorphic and dysregulated in iMCD. It is also possible that both abrogation of germinal center formation and inhibition of highly mTOR-activated cells are contributing to its effectiveness. Further research is needed into mTOR activation and germinal center biology in iMCD.
The lack of a single lymph node cell type that is clearly harboring the increased mTOR activation was a surprising result. We hypothesized that T cells, which are the primary cell type in the interfollicular space, known to be activated in the circulation in iMCD, and dependent on mTOR for activation, would be the primary pS6+ cell type. Further, circulating T cells are the cell population with mTOR hyperactivation in ALPS. However, CD3+ T cells represented <10% of the pS6-+ cells in the interfollicular space in our small sample of iMCD cases; this proportion was significantly lower than CD138+ plasma cells and CD68+ macrophages. Due to the limited number of cases with sufficient tissue available for serial co-IF, we did not have a large enough sample to confidently identify the cell type with the most significant pS6+ costaining. CD138+ plasma cells, which likely also represent a large proportion of the MUM1+ pS6+ population, and CD68+ macrophages accounted for the 2 largest median percentage of pS6+ cells. It is possible that levels of mTOR activation in T cells below the threshold for them to be considered positive in this study could still be clinically meaningful, and mTOR inhibition could have a therapeutic effect on these T cells. Nevertheless, among cells with pS6 expression above the threshold, this study revealed that there are likely multiple pS6+ cell types in the interfollicular space of iMCD. Further research is needed.
The greatest limitation to this study is the relatively small sample size due to the difficulty in procuring samples in this rare disease and the need to preserve some patient tissue for potential future clinical care. Nevertheless, this is the largest published series systematically evaluating lymph nodes from iMCD patients. Access to high-quality, clinically annotated samples is one of the greatest challenges faced in rare disease research. The patient and physician network through the Castleman Disease Collaborative Network and the ACCELERATE Natural History registry enabled procurement of these samples and data. Another limitation is that sentinel lymph nodes from breast cancer patients were used as controls; these samples may not be truly representative of the healthy population, despite the fact that they did not demonstrate evidence of metastasis or abnormality. However, removal of lymph nodes from healthy individuals is not clinically recommended. Furthermore, if there is a bias from using these samples, then one would hypothesize that the sentinel nodes may have increased mTOR activation because of increased inflammatory cytokines present in breast cancer patients.51,52 Therefore, this control may have actually increased the bar to identify significant differences. On a related note, the sentinel nodes were all obtained from females, which could introduce a sex bias. However, we found no difference in pS6 expression between male and female iMCD patients (supplemental Figure 1B). Another related limitation is that iMCD is highly episodic, and lymph node samples were only available during active disease, because tissue is not resected from patients in remission. If future samples can be obtained, it would be informative to know if mTORC1 activation parallels disease activity or is a constitutive aspect of the condition. Future investigation is also needed into candidate upstream activators of the PI3K/Akt/mTOR pathway such as BAFF, JAK, tumor necrosis factor–type stimuli, and activation of the lymph node fibroblastic reticular cell network. Activation of the lymph node fibroblastic reticular cell conduit network and tumor necrosis factor–type stimuli of lymph nodes in experimental systems can produce a similar pattern as was observed in our study.53,54 This is interesting, as we have previously described a proteomic signature characterized by stromal cell–produced chemokines.55 Future investigation of possible dysregulation of CASTOR1, the mechanism responsible for increased mTOR activation in HHV-8 infection, is needed in both HHV-8–associated MCD and iMCD. However, investigation is currently limited by availability of tissue and reagents.33
Lastly, it is important to note that increased mTOR activation across the iMCD cases does not necessarily equate to broad efficacy of mTOR-Is in iMCD. Dysregulation of other upstream or downstream pathways may occur; currently, it is not known whether PI3K, Akt, PKA, or proteins in the amino acid sensing pathway are dysregulated upstream of mTOR. Moreover, cells in iMCD could upregulate or downregulate pathways bypassing PI3K/Akt/mTOR, leading to resistance to mTOR-Is. Our preliminary data in 3 patients demonstrating efficacy of mTOR-Is in iMCD suggest this is an actionable, pathogenic mechanism. Furthermore, the enrichment of the mTORC1 signaling gene set in the serum proteome from a large study of 88 iMCD patients is supportive of mTOR activation playing a role in iMCD pathogenesis.
The insights into the pathophysiology of CD gained through this study have immediate clinical implications through the sirolimus clinical trial and future potential implications for patients with CD. Further investigation is needed into potential novel diagnostic biomarkers, predictive biomarkers of response to sirolimus, and novel treatment approaches based on the results of this study.
R software for compositional analysis has been deposited to GitHub and a permanent Zendo DOI (https://github.com/djarenas/Full_Compositional_Analysis).43 The IHC, co-IF, and IL-6–stimulated phospho-flow data are deposited at https://doi.org/10.5281/zenodo.3685955. For ruxolitinib-treatment phospho-flow data and proteomics data, please contact the corresponding author.
The online version of this article contains a data supplement.
The publication costs of this article were defrayed in part by page charge payment. Therefore, and solely to indicate this fact, this article is hereby marked “advertisement” in accordance with 18 USC section 1734.
Acknowledgments
The authors wish to thank Dustin Shilling, Eric Haljasmaa, Helen Partridge, and Clarice Dard for all of their important contributions to this study and others. They would also like to thank Patricia Tsao, Shou Jiang Giao, and Hongzhe Li for valuable discussions, as well as Anne and Walter Gamble, Marjorie Raines, and Elana Amsterdam for their continued support.
This work was funded by Castleman’s Awareness & Research Effort/Castleman Disease Collaborative Network (CDCN-2018-005-R), Penn Center for Precision Medicine, University of Pennsylvania University Research Foundation, and the National Heart, Lung, and Blood Institute of the National Institutes of Health (R01-HL141408).
Authorship
Contribution: D.C.F. conceptualized and led the study with advice and input from G.B.W., J.B., T.K., and D.T.T.; under S.K.P.’s leadership, J.Z., J.K., R.R., and S.A.T.P. engaged with physicians and patients and obtained and analyzed patient data and specimens for research; D.M. performed the co-IF and IHC experiments; D.J.A., D.K., M.B.S., M.A.T., and D.M. performed IHC analyses; K.F. analyzed the co-IF data; S.K.P. performed the GSEA analysis; R.-A.L.P. performed flow cytometry studies and analyzed the data; D.J.A. wrote the software for and performed the compositional analysis, effect size analysis, and general statistics; D.J.A. and D.C.F. wrote the initial manuscript; and all authors read, contributed to, and approved the final manuscript.
Conflict-of-interest disclosure: D.C.F. receives research funding from EUSA Pharma for the ACCELERATE registry (NCT02817997, formerly funded by Janssen Pharmaceuticals), and Pfizer provides study drug with no associated research funding for the clinical trial of sirolimus (NCT03933904). D.T.T. sits on an advisory board for Janssen Pharmaceuticals. There is a pending provisional patent application based on the work in this paper. The remaining authors declare no competing financial interests.
Correspondence: David C. Fajgenbaum, University of Pennsylvania, 3620 Hamilton Walk, Anatomy Chemistry Building, Office 214, Philadelphia, PA 19104; e-mail; davidfa@pennmedicine.upenn.edu.
