

Key Points
The Me-iPLEX assay is an accurate and robust method for efficiently measuring multiplexed panels of DNA methylation sites.
Me-iPLEX–determined epitypes stratify risk, regardless of CLL disease progression or treatment with chemoimmunotherapy or ibrutinib.

Abstract
Alterations in global DNA methylation patterns are a major hallmark of cancer and represent attractive biomarkers for personalized risk stratification. Chronic lymphocytic leukemia (CLL) risk stratification studies typically focus on time to first treatment (TTFT), time to progression (TTP) after treatment, and overall survival (OS). Whereas TTFT risk stratification remains similar over time, TTP and OS have changed dramatically with the introduction of targeted therapies, such as the Bruton tyrosine kinase inhibitor ibrutinib. We have shown that genome-wide DNA methylation patterns in CLL are strongly associated with phenotypic differentiation and patient outcomes. Here, we developed a novel assay, termed methylation-iPLEX (Me-iPLEX), for high-throughput quantification of targeted panels of single cytosine guanine dinucleotides from multiple independent loci. Me-iPLEX was used to classify CLL samples into 1 of 3 known epigenetic subtypes (epitypes). We examined the impact of epitype in 1286 CLL patients from 4 independent cohorts representing a comprehensive view of CLL disease course and therapies. We found that epitype significantly predicted TTFT and OS among newly diagnosed CLL patients. Additionally, epitype predicted TTP and OS with 2 common CLL therapies: chemoimmunotherapy and ibrutinib. Epitype retained significance after stratifying by biologically related biomarkers, immunoglobulin heavy chain mutational status, and ZAP70 expression, as well as other common prognostic markers. Furthermore, among several biological traits enriched between epitypes, we found highly biased immunogenetic features, including IGLV3-21 usage in the poorly characterized intermediate-programmed CLL epitype. In summary, Me-iPLEX is an elegant method to assess epigenetic signatures, including robust classification of CLL epitypes that independently stratify patient risk at diagnosis and time of treatment.
Introduction
Chronic lymphocytic leukemia (CLL) is a B-cell malignancy with a highly variable disease course.1 At diagnosis, the majority of CLL patients are asymptomatic. Observation without treatment until symptomatic disease progression is standard clinical practice; however, risk stratification to identify patients who are likely to progress quickly to symptomatic CLL and have an inferior survival is often used. Many studies have been published with different biomarkers predicting time to first treatment (TTFT) and overall survival (OS). Most widely used in this setting are assessment of interphase cytogenetics, mutational status of TP53, serum β2 microglobulin, and immunoglobulin heavy chain (IGHV) somatic mutation status, along with the Rai or Binet staging system.2 IGHV mutational status is an important robust individual prognostic marker and relates to whether the founder CLL cell clone is of pre- or postgerminal origin.3 IGHV-unmutated (IGHV-U) CLL generally displays a more aggressive clinical course, whereas IGHV-mutated (IGHV-M) CLL generally displays an indolent clinical course.4 Less laborious IGHV surrogate markers, such as ZAP70 protein expression and methylation, were subsequently developed and were also found to be strongly associated with outcomes.5,6
For many years, treatment of CLL consisted of chemoimmunotherapy (CIT) with fludarabine, cyclophosphamide, and rituximab (FCR) in young patients,7 and chlorambucil with obinutuzumab in older patients.8 Treatment risk stratification uses del(17)(p13.1) to direct patients to alternative treatments.9,10 IGHV mutational status is also used in this setting to predict eventual progression with CIT11,12 ; IGHV-M patients are more likely to have durable prolonged remissions with presumed cure.13 The introduction of the Bruton tyrosine kinase inhibitor ibrutinib has changed the CLL landscape, with broad clinical activity across all genomic subtypes.14-16 However, patients with complex karyotype, del(17)(p13), TP53 mutations, and multiple prior treatments have a higher progression rate than those who are untreated or lack these genomic features,17-19 although recent phase 3 studies have demonstrated that ibrutinib is still superior compared with standard CIT in this high-risk group.20 Improvement in risk stratification to identify patients who are likely to achieve durable responses with both therapy types is needed.
DNA methylation is a stable, yet reversible, epigenetic modification involving the covalent addition of a methyl group to the 5′ carbon of cytosine in cytosine guanine dinucleotide (CpG). It is critical for regulating gene expression, and perturbations are common in diseases such as cancer.21 Because of its stability over time, DNA methylation is used for cancer therapy–guiding biomarkers.22 In CLL, a distinct genome-wide DNA methylation pattern defines 3 epigenetic subgroups that are correlated with IGHV status and clinical outcomes.23-25 We term these “epitype” subgroups high-programmed CLL (HP-CLL), intermediate-programmed CLL (IP-CLL), and low-programmed CLL (LP-CLL) based on their relationship to B-cell maturation.25 CLL epitype remains unchanged during disease course and exhibits a similar longitudinal stability as IGHV mutation status.24,26-28 Because of the large degree of redundancy in epigenetic signatures between epitypes, DNA methylation patterns initially observed using genome-wide analyses can be recapitulated using reduced panels of CpGs.24,25
Methodologies for measuring DNA methylation range from whole-genome and global assays to various targeted approaches.29 Targeted assays, such as pyrosequencing, methylation-sensitive quantitative polymerase chain reaction (PCR), and EpiTYPER MassARRAY, measure single CpGs or single small regions of interest. Currently, there is a need for methods of midrange capacity that are capable of analyzing multiplexed single CpG methylation from multiple genomic loci in a high-resolution and high-throughput manner. Here, we introduce the methylation-iPLEX (Me-iPLEX) method that uses multiplexed PCR on bisulfite-converted DNA, followed by readout using matrix-assisted laser desorption/ionization time-of-flight (MALDI-TOF) mass spectrometry on the MassARRAY system.24,25 We evaluated the utility of Me-iPLEX to classify CLL into its 3 known epitypes in 1286 CLL samples from 4 independent CLL cohorts for risk stratification of newly diagnosed patients, as well as CIT- and ibrutinib-treated patients, to predict time to treatment and treatment-response duration.
Methods
Patient samples and data
We investigated 4 independent patient sample cohorts with differing overall characteristics and treatment (supplemental Table 1, available on the Blood Web site). The Mayo Clinic (Mayo; n = 248) cohort included samples from treatment-naive CLL patients collected at diagnosis. The MD Anderson Cancer Center (MDACC; n = 367) cohort samples were obtained from treatment-naive patients who subsequently required treatment, with 201 receiving FCR CIT.30 MDACC samples were enriched by immunomagnetic separation from peripheral blood mononuclear cells (PBMCs; n = 278) or extracted from formalin-fixed paraffin-embedded (FFPE) bone marrow clot sections (n = 89). The Ohio State University ibrutinib (OSU-ibrutinib; n = 232) cohort was composed of relapsed/refractory (R/R) patients (median of 3 prior therapies) receiving single-agent ibrutinib in clinical trials conducted at The Ohio State University.18 Finally, the CLL Research Consortium (CRC; n = 439) cohort represents samples from untreated patients. Illumina 450K data used for selection of CpGs and training/validation of the epitype prediction model were obtained from previous publications.25,31,32 Non-CLL B-cell malignancy samples were obtained from The Ohio State University Comprehensive Cancer Center (OSUCCC) Leukemia Tissue Bank. All samples were obtained from blood after patients provided written informed consent in accordance with established Institutional Review Board guidelines.
Me-iPLEX assay design and method
To assign CLL samples into methylation subgroups, we selected 7 loci displaying methylation states that were most significantly associated with the 3 methylation subgroups, as defined by consensus clustering of Illumina 450K data,25 including the ZAP70 promoter region.33 CpGs used in assessing sample purity and composition were selected from Illumina 450K profiles of purified healthy hematopoietic subsets.32 To classify samples into epitypes, we used a random forest algorithm modified from Capper et al34 trained using Me-iPLEX values from 20 genomic loci generated on the training set.25 This generated a calibrated probability class call of HP-CLL, IP-CLL, LP-CLL, or normal PBMCs. Call probabilities <0.9 were labeled as ambiguous. We used internal cross-validation and an external validation sample set to evaluate accuracy with known epitype calls determined from Illumina 450K classification.31 Additional details are found in supplemental Methods.
Results
Simultaneous interrogation of DNA methylation from multiple loci using Me-iPLEX
To efficiently assess the DNA methylation level of a targeted panel of CpGs for use in epigenetic classification, we sought an approach that could accurately quantify methylation levels at single-CpG resolution in a multiplex format. In the Me-iPLEX approach, DNA is subjected to sodium bisulfite, and genomic regions of interest are amplified in a multiplex capture PCR (Figure 1). Targeted cytosines are interrogated with a single-base extension to measure a quantitative ratio of unmethylated/methylated cytosine by MALDI-TOF using the MassARRAY system. To evaluate the accuracy of Me-iPLEX, we compared the methylation values with other established methods for measuring DNA methylation at single-CpG resolution, including the EpiTYPER assay and Illumina 450K arrays. We found that Me-iPLEX methylation values were highly reproducible and concordant with other methods (supplemental Figure 1).
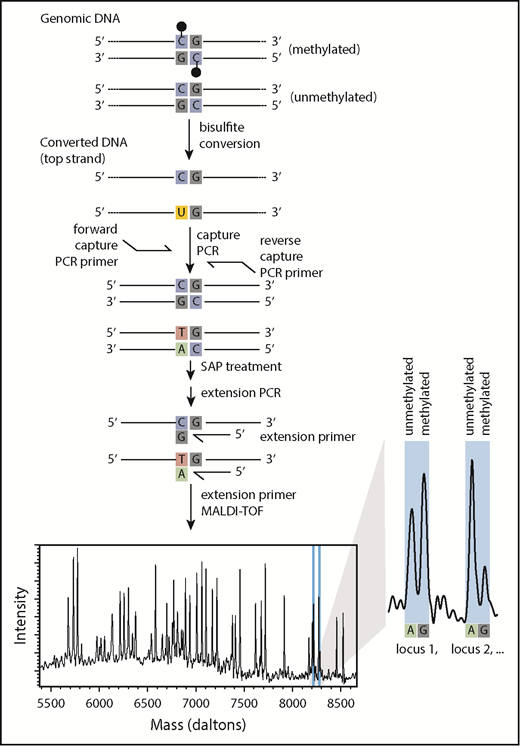
Me-iPLEX workflow. Upon treatment with sodium bisulfite, cytosines will remain as cytosines if methylated (black lollipop) or will be converted to a uracil if unmethylated. A multiplexed capture PCR amplifies regions surrounding CpGs of interest (uracil is replaced by thymine in PCR). Primers are annealed immediately 5′ to CpGs of interest, followed by a single-base extension PCR using terminator nucleotides. Extension products differ in mass according to the extended base, consistent with the CpG methylation status in the original DNA sample. Relative abundance of extension products is measured by MALDI-TOF mass spectrometry. Multiple extension products with unique masses can be combined into the same multiplexed reaction.
Me-iPLEX workflow. Upon treatment with sodium bisulfite, cytosines will remain as cytosines if methylated (black lollipop) or will be converted to a uracil if unmethylated. A multiplexed capture PCR amplifies regions surrounding CpGs of interest (uracil is replaced by thymine in PCR). Primers are annealed immediately 5′ to CpGs of interest, followed by a single-base extension PCR using terminator nucleotides. Extension products differ in mass according to the extended base, consistent with the CpG methylation status in the original DNA sample. Relative abundance of extension products is measured by MALDI-TOF mass spectrometry. Multiple extension products with unique masses can be combined into the same multiplexed reaction.
Construction of a novel methylation classifier compatible with impure CLL samples
Using our previously published and other publicly available Illumina 450K array data on CLL and normal purified PBMC subpopulations, we identified a subset of CpGs that exhibited unique DNA methylation patterns in each of the 3 CLL epitypes25 compared with healthy cell populations (Figure 2A), including CpGs that distinguish T/natural killer (NK) cell and myeloid cell types. Because non-CLL PBMCs carry DNA methylation patterns that would systematically obscure epitype classification, we aimed to construct an assay that could determine the CLL epitype in the presence of contaminating non-CLL cells. We identified 20 genomic regions and targeted 34 CpGs by using 40 extension primers across 3 multiplexed PCR reactions (supplemental Table 2). These combine to create a unique pattern for each CLL epitype and potential contaminating cell type.
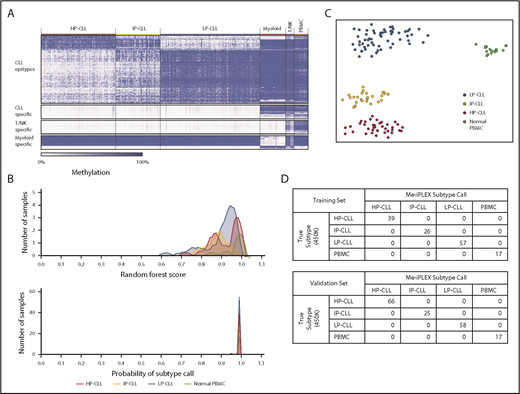
Epigenetic classification of CLL using Me-iPLEX. (A) Heat map identifying the most differentially methylated CpGs among CLL epitypes and between CLL and normal cell types using Illumina 450K arrays. The 500 most variable 450K probes among the 3 CLL epitypes (top row). The 100 most differentially methylated probes comparing CLL with normal cells, myeloid cells, or T/NK cells (lower rows). Columns represent CLL patients (n = 310), normal myeloid cells (n = 36), normal T/NK cells (n = 12), and normal PBMCs (n = 20). (B) Density plots showing the distribution of the raw random forest score (upper panel) and the calibrated probability (lower panel) of each methylation class in our training sample set (n = 139). (C) Unsupervised clustering using a t-SNE plot of the training cohort samples. Colors represent the calibrated subtype call. (D) Confusion matrix comparing the known epitype call (determined from Illumina 450K analysis) with the epitype call by the random forest method of the training cohort (upper panel) and with the validation cohort (lower panel, n = 149).
Epigenetic classification of CLL using Me-iPLEX. (A) Heat map identifying the most differentially methylated CpGs among CLL epitypes and between CLL and normal cell types using Illumina 450K arrays. The 500 most variable 450K probes among the 3 CLL epitypes (top row). The 100 most differentially methylated probes comparing CLL with normal cells, myeloid cells, or T/NK cells (lower rows). Columns represent CLL patients (n = 310), normal myeloid cells (n = 36), normal T/NK cells (n = 12), and normal PBMCs (n = 20). (B) Density plots showing the distribution of the raw random forest score (upper panel) and the calibrated probability (lower panel) of each methylation class in our training sample set (n = 139). (C) Unsupervised clustering using a t-SNE plot of the training cohort samples. Colors represent the calibrated subtype call. (D) Confusion matrix comparing the known epitype call (determined from Illumina 450K analysis) with the epitype call by the random forest method of the training cohort (upper panel) and with the validation cohort (lower panel, n = 149).
To classify samples into 1 of 4 methylation classes (HP-CLL, IP-CLL, LP-CLL, or normal PBMCs), we trained a random forest regression model. The model was initially trained on 139 samples of known CLL epitype, as determined by Illumina 450K data, and normal PBMC samples (healthy donor or CLL-depleted PBMCs). Using the random forest model incorporating Me-iPLEX methylation data from all 139 training samples, we generated an aggregate raw class score and fit a multinomial logistic regression calibration model to obtain a class probability for each sample (Figure 2B, see “Methods”). Visual inspection of the relationships among methylation patterns across samples using t-distributed stochastic neighbor embedding (t-SNE) showed clear separation of samples into epitypes (Figure 2C). Random cross-validation of the training model demonstrated the strong discriminating power of the classifier (Figure 2A; supplemental Figure 2A). For further validation, we interrogated an independent set of 166 CLL samples of known epitype31 and achieved 100% accuracy in the validation cohort based on the model generated using the training set (Figure 2D; supplemental Figure 2B). For the purposes of interrogating subsequent test samples, we combined our training and validation cohorts to create a reference cohort that further maximizes the robustness of the classifier (supplemental Figure 2C-D).
Technical evaluation of the Me-iPLEX CLL epitype classifier
To determine the lower limit of tumor purity required for epitype classification, we mixed DNA from purified CLL samples with DNA isolated from healthy donor PBMCs at fixed ratios. The calibrated score for the corresponding correct subtype fell below the conservative 0.9 probability cutoff at roughly 60% CLL DNA content for all 3 epitypes (supplemental Figure 3A). The DNA methylation pattern from samples with <60% CLL content more closely resembled that of healthy PBMCs and was classified as impure. To confirm this lower purity boundary, impure CLL samples were separated into purified CLL and CLL-depleted fractions using CD19+ magnetic cell separation. The cell populations were then mixed back together at known ratios and confirmed by flow cytometry. Again, a high-confidence epitype probability > 0.9 was observed if CLL cells made up >60% of the sample (supplemental Figure 3B). The methylation pattern of CLL-depleted fractions matched that of a healthy PBMC sample. We developed a simple estimate of CLL purity using CpGs with CLL-specific methylation in samples of fixed CLL content by fitting a nonlinear equation to estimate the CLL purity of test samples (supplemental Figure 3C). To determine the minimum amount of input DNA required to confidently assign an epitype, we made serial dilutions of CLL DNA from all 3 epitypes (n = 8 samples per epitype). The subtype call remained stably >0.9 probability when ≥1 ng of DNA was used (approximately ≥200 cells), indicating that the assay can reliably assign the correct subtype with relatively low input (supplemental Figure 3D). Analysis of DNA derived from FFPE bone marrow clot sections and fresh-frozen samples from the same patient resulted in identical epitype calls (supplemental Table 3).
Determining epitypes in multiple CLL cohorts using Me-iPLEX
The high-throughput nature of the Me-iPLEX assay enables the efficient analysis of a large number of CLL samples. We evaluated 4 independent CLL patient sample cohorts (N = 1286) with varying patient features and treatments (Figure 3; supplemental Figure 4). Overall, 49%, 13%, and 21% of CLL samples were classified as LP-CLL, IP-CLL, and HP-CLL, respectively, and 7% displayed insufficient tumor purity. CLL samples with sufficient purity but that fell below the 0.9 probability threshold were termed “ambiguous” and ranged from 6% to 14% per cohort. Visualizing methylation patterns by t-SNE showed that CLL sample impurity was increased at the periphery of clusters, intensifying toward the cluster containing normal PBMC training samples (supplemental Figure 5A). Samples with lower probability scores were located between and at the periphery of t-SNE clusters (supplemental Figure 5B). Ambiguous samples commonly exhibited methylation patterns that fell between high-confidence epitype clusters, consistent with the notion of a continuum of methylation states in CLL,25 and displayed intermediate clinical risk, as expected from mixed epitypes (data not shown). Ambiguous samples showed normal CLL immunophenotypic features, as measured by Matutes score35 (supplemental Figure 5C). A minor cluster of samples simultaneously displayed low CLL purity and low probability of a PBMC epitype (supplemental Figure 5A-B), which we reasoned may represent atypical CLL or patients with a non-CLL malignancy. To test this, we analyzed a collection of 49 non-CLL samples, including mantle cell lymphoma, marginal zone lymphoma, hairy cell leukemia, and B-cell prolymphocytic leukemia, using the Me-iPLEX assay and found that the majority of non-CLL samples clustered in or nearby the atypical cluster (supplemental Figure 5D). Indeed, CLL samples in the atypical cluster showed a lower Matutes score (2-3) compared with high-confidence epitypes (mean scores 4.3, 4.1, and 4.2 for HP-CLL, IP-CLL, and LP-CLL, respectively) (supplemental Figure 5C). Sixty-eight percent of non-CLL samples were deemed ambiguous or impure, demonstrating that, along with atypical samples, non-CLL samples will often fail CLL epitype classification (supplemental Figure 5E-F). These results demonstrate that Me-iPLEX can classify CLL epitypes in a large majority of samples with high confidence, while identifying impure samples and non-CLL methylation patterns that would not be detected by other approaches.24
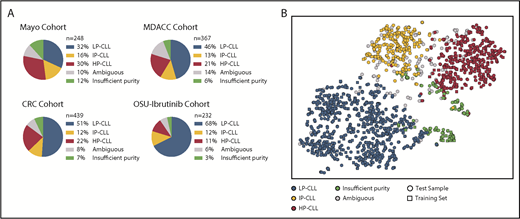
Epityping of CLL patients from 4 independent sample cohorts using Me-iPLEX. (A) Distribution of the calibrated epitype calls within each of the cohorts. (B) Unsupervised clustering of Me-iPLEX data from CLL samples from 4 independent test cohorts (circles, n = 1286) and from the combined reference cohort (squares, n = 305) using t-SNE.
Epityping of CLL patients from 4 independent sample cohorts using Me-iPLEX. (A) Distribution of the calibrated epitype calls within each of the cohorts. (B) Unsupervised clustering of Me-iPLEX data from CLL samples from 4 independent test cohorts (circles, n = 1286) and from the combined reference cohort (squares, n = 305) using t-SNE.
Distinct features of CLL epitypes
Combining available feature data for all training, validation, and test cohorts (N = 1578 samples), we performed a high-resolution assessment of biological and clinical features associated with epitype, paying special attention to the less frequent IP-CLL group. The most remarkable biological traits enriched among epitypes pertained to immunoglobulin features and somatic mutations (supplemental Table 4). IP-CLL patients displayed a distinct intermediate degree of IGHV mutations (mean, 95.9%) relative to LP-CLL and HP-CLL (99.7% and 92.7%, respectively) (Figure 4A). IP-CLL predominantly used VH3 family genes (65% of IP-CLL), including VH3-21 and VH3-23, whereas VH usage by HP-CLL was predominated by VH3-7 and VH4-34, and LP-CLL most commonly used VH1-69 (Figure 4B). Interestingly, IP-CLL exhibited a distinct, but nonexclusive, usage of λ immunoglobulin light chains (P < .0001) (Figure 4C). Assessing specific light chain gene usage available for the OSU-ibrutinib and validation cohorts, we found that more than half of IP-CLL samples used IGLV3-21 rearrangements (P < .0001 (Figure 4D). With the exception of trisomy 12, cytogenetic abnormalities were unequally distributed across epitypes (Figure 4E). Deletions on chromosomes 17p and 11q, encompassing TP53 and ATM, respectively, were enriched in LP-CLL, whereas deletion of 13q (DLEU2) was more frequent in IP-CLL. NOTCH1 and TP53 mutations were enriched in LP-CLL, with XPO1 mutations virtually specific for this epitype (Figure 4F). In addition to confirming that SF3B1 mutations occur more frequently in IP-CLL, we have identified that mutated MYD88 is most frequently found in IP-CLL. As of the last follow-up, Richter’s Transformation (RT) was available for the MDACC and OSU-ibrutinib cohorts, with 13 and 10 cases of RT observed, respectively. Of the 23 RT cases, 1 was of insufficient purity, 1 was ambiguous, 14 were LP-CLL, 7 were IP-CLL, and none were HP-CLL. HP-CLL displayed significantly less risk for RT (P = .010), whereas IGHV mutation status was not significant. We next combined all patients not treated at sampling (Mayo, CRC, and MDACC cohorts) and found that outcomes for IP-CLL patients were significantly different compared with the LP-CLL and HP-CLL groups for TTFT and OS (supplemental Figure 6).
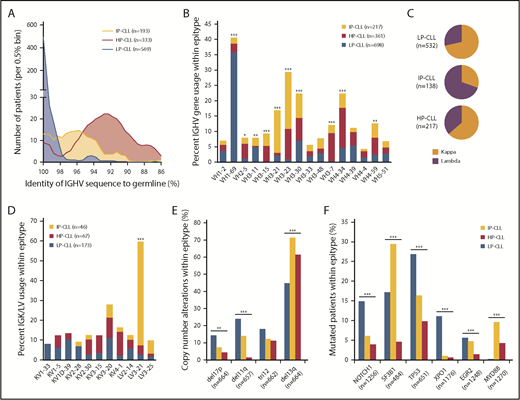
Distinct features of CLL epitypes revealed in combined analysis including all cohorts. (A) Epitype-specific distribution of IGHV mutations across 1095 patients (P < .0001). (B) Frequency of VH gene usage within epitype among the 16 most represented VH genes across all cohorts. (C) Frequency of immunoglobulin light chain usage within epitypes showing distinct usage of IGLV in IP-CLL (P < .0001). (D) Frequency of specific immunoglobulin light chain usage within epitypes among the 11 most frequent rearrangements. (E) Frequency of cytogenetic abnormalities by FISH within epitypes. (F) Frequency of most common recurrently mutated genes in CLL within epitypes. *P < .05, **P < .001, ***P < .0001, χ2 test with Bonferroni correction.
Distinct features of CLL epitypes revealed in combined analysis including all cohorts. (A) Epitype-specific distribution of IGHV mutations across 1095 patients (P < .0001). (B) Frequency of VH gene usage within epitype among the 16 most represented VH genes across all cohorts. (C) Frequency of immunoglobulin light chain usage within epitypes showing distinct usage of IGLV in IP-CLL (P < .0001). (D) Frequency of specific immunoglobulin light chain usage within epitypes among the 11 most frequent rearrangements. (E) Frequency of cytogenetic abnormalities by FISH within epitypes. (F) Frequency of most common recurrently mutated genes in CLL within epitypes. *P < .05, **P < .001, ***P < .0001, χ2 test with Bonferroni correction.
Prognostic impact of epitype at various natural history time points
We sought to comprehensively evaluate the prognostic significance of Me-iPLEX–determined CLL epitypes across disease stages. Because many CLL patients are not treated immediately at diagnosis, and some patients may never require therapy, we first investigated whether epitype would predict TTFT. The Mayo cohort is a population of CLL patients with confirmed initial diagnosis at the Mayo Clinic and sampling at diagnosis. We found that epitype predicted an extended TTFT for HP-CLL cases, with >50% of patients untreated at 6 years following diagnosis (Figure 5A). Furthermore, for HP-CLL patients requiring therapy, treatment was delayed significantly (P = .0008; median difference, 2.2 years) relative to IP-CLL and LP-CLL. We next sought to investigate whether epitype predicts response to therapy in front-line and R/R settings, as well as in response to traditional CIT and the novel therapy, ibrutinib. In the MDACC cohort, 201 patients with epitype data were uniformly treated with FCR as front-line therapy. Following treatment with FCR, HP-CLL patients experienced a significantly longer time to progression (TTP), with 75% remaining treatment-free at 10 years (Figure 5B). We next explored whether epitype is associated with outcome in R/R patients following treatment with ibrutinib. The OSU-ibrutinib cohort is composed of patients treated with a median of 3 prior therapies who subsequently received ibrutinib.18 As would be expected in a cohort of patients who have failed multiple prior therapies, we found that the more clinically aggressive LP-CLL epitype is predominant (74.8%). Nonetheless, we observed a significantly reduced cumulative incidence of ibrutinib discontinuation as the result of CLL progression or RT in HP-CLL patients (Figure 5C). Next, we examined the impact of epitype on OS in each cohort and found that HP-CLL cases exhibited significantly longer OS following FCR treatment (MDACC) and ibrutinib, as well as a trend toward longer OS in the Mayo cohort (from diagnosis), likely as a result of the shorter follow-up duration (Figure 5D-F). These results show that the CLL epitype can be useful prior to and throughout the treatment course in patients treated with CIT or ibrutinib.
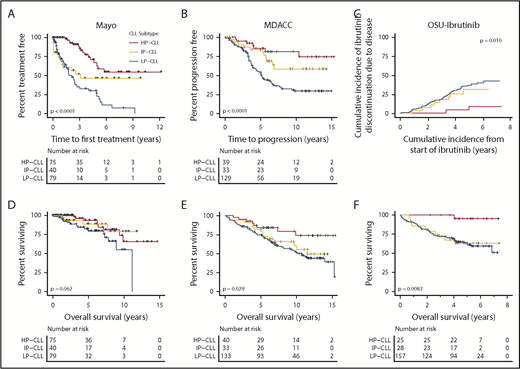
Clinical impact of CLL epitypes, as determined by Me-iPLEX, at different phases of CLL disease progression and treatment. (A) Kaplan-Meier analysis of TTFT of the Mayo cohort comprising patients sampled at diagnosis separated by epitype. (B) Kaplan-Meier analysis of TTP after uniform treatment with FCR in the MDACC cohort. (C) Cumulative incidence of ibrutinib discontinuation due to CLL progression or RT, from the time of initiating ibrutinib treatment in the OSU-ibrutinib cohort. (D) OS from diagnosis in the Mayo cohort. (E) OS from initiation of therapy in FCR-treated patients from the MDACC cohort. (F) OS from the initiation of ibrutinib therapy in the OSU-ibrutinib cohort. The P values were assessed using the log-rank test.
Clinical impact of CLL epitypes, as determined by Me-iPLEX, at different phases of CLL disease progression and treatment. (A) Kaplan-Meier analysis of TTFT of the Mayo cohort comprising patients sampled at diagnosis separated by epitype. (B) Kaplan-Meier analysis of TTP after uniform treatment with FCR in the MDACC cohort. (C) Cumulative incidence of ibrutinib discontinuation due to CLL progression or RT, from the time of initiating ibrutinib treatment in the OSU-ibrutinib cohort. (D) OS from diagnosis in the Mayo cohort. (E) OS from initiation of therapy in FCR-treated patients from the MDACC cohort. (F) OS from the initiation of ibrutinib therapy in the OSU-ibrutinib cohort. The P values were assessed using the log-rank test.
Prognostic impact of epitype compared with other markers of CLL founder cell subtype
Because epitype, IGHV status, and ZAP70 expression similarly derive from the degree of differentiation of the founder cell, and epitype remains comparably unchanged over disease course, we sought to compare these 3 related features. Indeed, these features were highly concordant, with 95.7% of LP-CLLs exhibiting IGHV-U and 88.1% of HP-CLLs exhibiting IGHV-M across all samples (supplemental Table 1). Similarly, 65.5% of LP-CLLs were ZAP70+, and 75.8% of HP-CLLs were ZAP70−. Because patients discordant for the above common epitype and IGHV or ZAP70 relationships represented a minor proportion of cases, we again combined patients from the 3 cohorts (Mayo, CRC, and MDACC) who were untreated at sampling. To increase the proportion of potential discordant cases, the CRC cohort was supplemented with 192 patients who displayed discordant IGHV and ZAP70 markers. After stratifying patients separately by IGHV mutation status and ZAP70 expression, we observed that epitype remained significantly associated with TTFT in ZAP70+, ZAP70−, IGHV-M, and IGHV-U patients (Figure 6A). Epitype consistently retained prognostic significance for OS in all 4 subgroups (Figure 6B). Interestingly, the HP-CLL epitype rescued IGHV-U patients from an unfavorable OS outcome, with very few deaths occurring with this combination relative to IGHV-U/LP-CLL. Likewise after separating by ZAP70 status, epitype maintained significant separation of OS. Although limited by sample size, we identified 2 IGHV-U patients with an HP-CLL epitype, and they displayed a relatively longer survival (supplemental Figure 7). For each cohort, a multivariable analysis was performed that specifically included IGHV, ZAP70, and epitype (supplemental Table 5). The 3 features were broadly significant as single variables across cohorts, yet epitype was the sole variable that retained significance in multivariable models for TTFT (Mayo, CRC cohorts), time to ibrutinib discontinuation due to disease (OSU-ibrutinib cohort), and OS (CRC and OSU-ibrutinib cohorts). Given the high degree of correlation among IGHV, ZAP70, and epitype, and that only epitype retained statistical significance when all 3 features were included in the same model, we retained epitype in further multivariable modeling that incorporated age, gender, Rai stage, and the high-risk cytogenetic abnormality del(17p). Epitype retained statistical significance for TTFT, TTP, and ibrutinib discontinuation, as well as for OS, in the MDACC and OSU-ibrutinib cohorts (supplemental Table 6). Together, these results suggest that epitype, as measured by Me-iPLEX, is a superior predictor of outcomes relative to related features IGHV and ZAP70, and it retains independence when included with other common CLL prognostic markers to predict outcomes with CIT or ibrutinib.
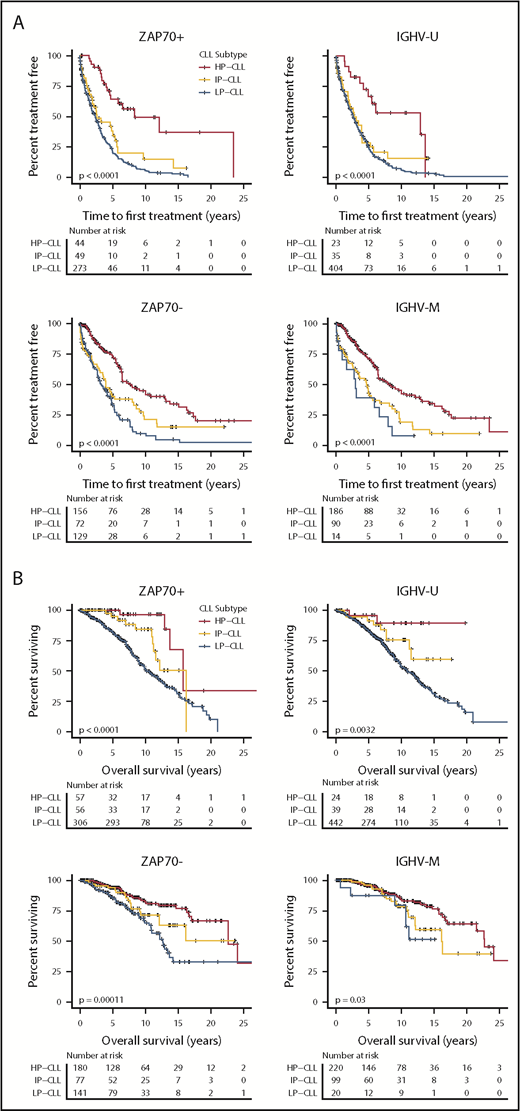
Relative clinical impact of epitype on CLL patient outcomes after separating patients by the related markers IGHV mutation status and ZAP70 positivity. (A) Patients were combined from the Mayo, CRC, and MDACC cohorts, and TTFT was plotted by epitype after segregating into 2 groups according to ZAP70 expression (±20% positivity, left panels) and IGHV status (±98% identity, right panels). (B) The same analysis as in (A), assessing OS from diagnosis. The P values were assessed using the log-rank test.
Relative clinical impact of epitype on CLL patient outcomes after separating patients by the related markers IGHV mutation status and ZAP70 positivity. (A) Patients were combined from the Mayo, CRC, and MDACC cohorts, and TTFT was plotted by epitype after segregating into 2 groups according to ZAP70 expression (±20% positivity, left panels) and IGHV status (±98% identity, right panels). (B) The same analysis as in (A), assessing OS from diagnosis. The P values were assessed using the log-rank test.
Discussion
In this study, we have developed a novel method, Me-iPLEX, and applied it to evaluate CLL epitypes previously identified by our group.25 We found that epitype is associated with distinct biological features and consistently predicts CLL patient outcomes in 4 independent sample cohorts. Me-iPLEX–determined epitype demonstrated associations with clinical outcomes, independently of other biologically related factors, IGHV mutation status, and ZAP70 expression, as well as other common prognostic markers, and it is the superior factor in identifying patients who are more likely to respond to traditional CIT. We have also found that epitype is a significant prognostic factor for TTP and OS in relapsed patients treated with ibrutinib. Few biomarkers are correlated with survival when using novel agents in CLL; studies have identified the significant impact of TP53 disruption and genomic instability.14,36 We show that epitype is prognostic in patients treated with CIT or ibrutinib, demonstrating clinical relevance in the current therapeutic era.
The Me-iPLEX assay is a novel approach to analyze single CpG methylation. By using a multiplex format, Me-iPLEX reduces the per-sample cost and DNA input compared with genome-wide approaches, as well as other targeted methylation analyses, such as pyrosequencing and EpiTYPER/MassARRAY. Because Me-iPLEX uses the MassARRAY system, DNA methylation data can be produced from a DNA sample in a single workday and do not require extensive data processing. The assay could be readily applied to any application for which the generation of quantitative DNA methylation data on tens to hundreds of CpGs simultaneously would be desired. We found that the Me-iPLEX assay is highly reproducible and accurate relative to other methods, including when FFPE-extracted DNA was used. Thus, we envision many uses for Me-iPLEX, including as a useful approach for high-throughput analysis of panels of key CpG sites derived from genome-wide methylation data.
CLL epitypes were first demonstrated by Kulis and colleagues23 ; a subsequent targeted panel of 5 CpGs based on pyrosequencing was developed to discern CLL epitypes and validated in a cohort of 97 patients.24 The Me-iPLEX CLL epityping assay improves the robustness of CLL epitype classification by recognizing samples with critically low CLL content and identifying atypical methylation patterns that would otherwise have been erroneously assigned an epitype. This is advantageous in clinical settings in which purification of CLL samples is not generally done, and identification of anomalous DNA methylation patterns may help point to alternative diagnoses in cases with atypical features. Purification can be done on selected low-purity samples within a cohort, because we obtained high-confidence epitype calls following purification in test samples. We also observed that a small minority of samples retained sufficient purity but fell below the confidence cutoff for epitype classification. This reflects the continuum of differentiation states that exists in the CLL population25 ; thus, a small proportion of samples fall between clusters, although most patients fall within the patterns associated with 1 of the 3 epitypes.
Our investigation, which included a total of 1578 patients, provides a high-resolution association of biological features with epitypes. We confirmed previous findings of IGHV mutation status and rearrangements (VH1-69, VH3-23, and VH4-34 in LP-CLL, IP-CLL, and HP-CLL, respectively)23-25,37 and uncovered additional associations (supplemental Table 4). Interestingly, IP-CLL was heavily biased to λ light chain usage that extends beyond the association of IGHV3-21/IGLV3-21 cases (known as subset #238 ) uncovered by Bhoi et al,37 because we found that 48% of λ usage was non-IGLV3-21, and only 6 of 24 patients showed simultaneous IGHV3-21/IGLV3-21 rearrangements in IP-CLL. Identification of light chain use was only available for the OSU-ibrutinib and validation cohorts; IGLV3-21 usage within IP-CLL was highest in the OSU-ibrutinib cohort (13/20, 65%) and was somewhat lower in the validation cohort (11/25, 44%). Because IGLV3-21 usage is associated with unfavorable outcome,39 higher usage in the OSU-ibrutinib cohort may be due to the R/R nature of the cohort and may also explain the shift in IP-CLL curves toward LP-CLL in the OSU-ibrutinib cohort outcome analyses. For genetic aberrations, we confirmed enrichment of del(11)(q23) and NOTCH1 mutations in LP-CLL24,37 and clarified borderline significance or uncovered novel associations for del(17p), del(13q), SF3B1, TP53, MYD88, EGR2, and XPO1 genetic alterations. IP-CLL patients displayed unique patterns of immunoglobulin features and genetic aberrations representing a unique subgroup rather than a mixture of LP-CLL and HP-CLL. Interestingly, mantle cell lymphoma frequently exhibited an IP-CLL–like epitype (supplemental Figure 5F), as well as preferential use of λ light chains and enrichment of VH3-21 in IGHV-mutated cases (93-98% of germline),40 suggesting a potential shared pathway and/or origin with IP-CLL.
The choice of CIT vs other potentially noncurative therapy is especially relevant among younger patients. The clinical impact of epitype on disease progression has not been previously evaluated in cohorts uniformly treated with FCR or ibrutinib. We observed a plateau of long-term progression-free response at 10 years involving 75% of HP-CLL patients, which improves upon using IGHV-M alone in our study and in a previous study using a similar sample cohort.13 Although epitype remains to be prospectively evaluated, our data suggest that epitype may help to stratify patients for early intervention with novel agents. Previous studies of ibrutinib-treated patients failed to detect an impact of IGHV mutation status.17 We found that epitype shows a significant impact and independence from IGHV following ibrutinib treatment, although validation in future studies will be needed. Moving forward, epitype may become a key component in prognostic index models, together with other epigenetic, genetic, immunophenotypic, and clinical features.
The online version of this article contains a data supplement.
The publication costs of this article were defrayed in part by page charge payment. Therefore, and solely to indicate this fact, this article is hereby marked “advertisement” in accordance with 18 USC section 1734.
Acknowledgments
The authors thank all of the patients who contributed to this study. They also thank the CLL Research Consortium (supported by National Institutes of Health/National Cancer Institute [NIH/NCI] grant P01 5P01CA081534) and the CLL Global Research Foundation (supported by NIH/NCI grant R01 CA182905-01).
This work was supported by the OSUCC. Samples were obtained from the OSUCC Leukemia Tissue Bank Shared Resource, supported by NIH/NCI grant P30 CA016058. N.E.K. and T.D.S. are supported by NIH/NCI grant R01 CA197120, and J.C.B. is supported by NIH/NCI grant R35 CA197734. C.C.O. is supported by the Gabrielle's Angel Foundation for Cancer Research.
Authorship
Contribution: B.G., C.W., Y.-Z.W., and M.M.G. performed laboratory experiments; B.G., Q.Z., A.A., A.S.R., K.G.R., M.C.L., K.R.C., J.L., J.S.B., and C.C.O. performed data analysis and interpretation; J.S.B., K.A.R., J.L., W.G.W., J.R.B., K.R.R., M.K., L.Z.R., T.J.K., T.Z., T.D.S., N.E.K., L.V.A., K.R.C., J.A.W., and J.C.B. contributed reagents, materials, and/or data; B.G., Q.Z., A.S.R., J.C.B., and C.C.O. wrote the manuscript; and all authors reviewed and edited the manuscript.
Conflict-of-interest disclosure: The authors declare no competing financial interests.
Correspondence: Christopher C. Oakes, Division of Hematology, Department of Internal Medicine, The Comprehensive Cancer Center, The Ohio State University, 400 W. 12th Ave, Wiseman Hall, Suite 455, Columbus, OH 43210; e-mail: christopher.oakes@osumc.edu.

This feature is available to Subscribers Only
Sign In or Create an Account Close Modal