

Key Points
The MDM2 antagonist idasanutlin was well tolerated in patients with PV in this phase 1 clinical trial.
Clinical responses and on-target TP53 pathway activation were observed in treatment-refractory PV patients treated with idasanutlin.

Abstract
A limited number of drugs are available to treat patients with polycythemia vera (PV) and essential thrombocythemia (ET). We attempted to identify alternative agents that may target abnormalities within malignant hematopoietic stem (HSCs) and progenitor cells (HPCs). Previously, MDM2 protein levels were shown to be upregulated in PV/ET CD34+ cells, and exposure to a nutlin, an MDM2 antagonist, induced activation of the TP53 pathway and selective depletion of PV HPCs/HSCs. This anticlonal activity was mediated by upregulation of p53 and potentiated by the addition of interferon-α2a (IFN-α2a). Therefore, we performed an investigator-initiated phase 1 trial of the oral MDM2 antagonist idasanutlin (RG7388; Roche) in patients with high-risk PV/ET for whom at least 1 prior therapy had failed. Patients not attaining at least a partial response by European LeukemiaNet criteria after 6 cycles were then allowed to receive combination therapy with low-dose pegylated IFN-α2a. Thirteen patients with JAK2 V617F+ PV/ET were enrolled, and 12 (PV, n = 11; ET, n = 1) were treated with idasanutlin at 100 and 150 mg daily, respectively, for 5 consecutive days of a 28-day cycle. Idasanutlin was well tolerated; no dose-limiting toxicity was observed, but low-grade gastrointestinal toxicity was common. Overall response rate after 6 cycles was 58% (7 of 12) with idasanutlin monotherapy and 50% (2 of 4) with combination therapy. Median duration of response was 16.8 months (range, 3.5-26.7). Hematologic, symptomatic, pathologic, and molecular responses were observed. These data indicate that idasanutlin is a promising novel agent for PV; it is currently being evaluated in a global phase 2 trial. This trial was registered at www.clinicaltrials.gov as #NCT02407080.
Introduction
Polycythemia vera (PV) and essential thrombocythemia (ET) are chronic BCR-ABL1− myeloproliferative neoplasms (MPNs) characterized by increased blood counts, a heightened risk of thrombosis and hemorrhage, progression to myelofibrosis (MF) and acute myeloid leukemia, and reduced overall survival.1,2 Hyperactivity of the JAK-STAT pathway resulting from acquired mutations involving JAK2, CALR, and MPL within hematopoietic stem (HSCs)/progenitor cells (HPCs) is a unifying pathologic abnormality among these chronic myeloid neoplasms.3 Patients with PV/ET are stratified for thrombohemorrhagic risk by age (>60 years) and/or history of thrombosis. PV/ET is treated with a combination of aspirin, therapeutic phlebotomy (PV), and cytoreductive therapy to achieve normalization of blood counts, which leads to reduction in risk of thrombotic events. Hydroxyurea has been used for ∼50 years as first-line therapy to achieve hematologic responses, and ∼15% to 20% of treated patients eventually encounter resistance or intolerance as defined by the European LeukemiaNet (ELN).4 Recombinant interferon-α (IFN-α) has pleotropic biologic effects and has been evaluated in prospective studies as front-line therapy and second-line therapy after hydroxyurea failure.5 IFN-α therapy has been shown to reduce the burden of mutated alleles in the granulocytes of PV/ET patients as well as deplete MPN stem/progenitor cells.6 Our laboratory has provided evidence that some of the clinical activity of IFN-α can be attributed to its ability to upregulate TP53 activity.6,7
The p53 protein has been shown to mediate cellular responses to DNA damage as well as other cellular stresses.8,9 The levels of p53 are kept low in cells because of its binding by MDM2. Stress-induced posttranslational modifications of both p53 and MDM2 result in the disruption of their binding. p53 levels then increase, and p53 regulates gene expression, leading to a variety of cellular responses, most notably cell-cycle arrest, which if prolonged leads to senescence or alternatively apoptosis. MDM2 itself interacts with the closely related MDM4 protein to fully exert is ubiquitin ligase activity toward p53. MDM2 and MDM4 can both independently bind to TP53 and block its transcriptional activity. Both MDM2 and MDM4 have thus been implicated as oncogenes in cancer because of these negative effects on TP53.10,11 Our laboratory has previously shown that MDM2 is upregulated in PV CD34+ stem/progenitor cells and that nutlins, a class of drugs that antagonizes MDM2 activity, are capable of depleting mutated PV stem/progenitor cells.7,12 Emerging clinical data support the activity of this novel approach in related neoplasms.13-15 To evaluate the therapeutic potential of MDM2 antagonism in PV/ET, we conducted an investigator-initiated phase 1 trial of idasanutlin, a second-generation pharmaceutical oral nutlin, alone or in combination with IFN-α in patients with high-risk PV/ET for whom at least 1 prior line of therapy had failed.
Methods
This study was an investigator-initiated phase 1 clinical trial performed at a single site in compliance with an Investigational New Drug application, which was approved by the US Food and Drug Administration. All participating patients provided informed consent before they participated, in accordance with the principles of the Declaration of Helsinki. This study was approved by the Program for the Protection of Human Subjects at the Icahn School of Medicine at Mount Sinai. This study was supported by the National Cancer Institute and the Leukemia Lymphoma Society, and idasanutlin was supplied by Roche/Genentech. High-risk PV/ET patients who met World Health Organization diagnostic criteria with JAK2 V617+ hematopoiesis and were refractory or intolerant to prior therapy with hydroxyurea, IFN-α, or anagrelide were eligible for study entry. Part A of this protocol was a phase 1 open-label study of single-agent oral idasanutlin administered at a starting dose of 100 mg daily for 5 days for the first cycle, which was 56 days in duration.16,17 Subsequent cycles were 28 days in duration. Patients were enrolled in a standard 3 + 3 phase 1 design, with 2 dose levels ultimately tested. The maximum tolerated dose was defined as 1 dose level below that dose with unacceptable toxicity, with a total of 6 patients treated at the maximum tolerated dose.
The primary objectives of this study were to evaluate the toxicity, safety, and tolerability of single-agent idasanutlin in PV/ET patients and identify the recommended phase 2 dose of this agent that would be evaluated in a single-agent phase 2 trial. The secondary objective was to estimate the response rate of PV/ET patients treated with escalating doses of single-agent idasanutlin (100 or 150 mg). In addition, patients who were tolerant of idasanutlin but did not achieve a therapeutic response were eligible to enter part B of the study, where these patients were treated with a tolerable dose of idasanutlin in combination with a low dose of pegylated IFN-α2a (Pegasys). The combination of these 2 agents had been previously shown to be additive in upregulating TP53 and depleting MPN stem/progenitor cells.7,12
The first 56 days (cycle 1) of the trial constituted the phase 1 portion of the study for evaluation of dose-limiting toxicity (DLT). DLTs were defined by the Common Terminology Criteria for Adverse Events (version 4.0) as any nonhematologic adverse event (AE) of grade ≥3 or any hematologic AE of grade ≥2 thrombocytopenia, grade ≥3 neutropenia, or grade ≥3 anemia. Patients who did not experience a DLT were allowed to continue receiving therapy in an extension phase in 28-day cycles. If a patient achieved a complete hematologic response, the study drug was not restarted at subsequent cycles until prespecified hematologic parameters were met (platelet >400 × 109/L and/or hematocrit >42%). AEs were captured for patients in the extension phase to further assess the long-term safety and tolerability of idasanutlin in PV/ET patients. Patients who entered the extension phase could continue receiving idasanutlin treatment until disease progression, unacceptable toxicity, or physician/patient decision to withdraw from the study.
Patients who did not obtain at least a partial response (PR) by ELN hematologic response criteria after 6 cycles could enter part B (combination therapy) of the protocol.18 Patients entering part B could not have experienced any of the following while receiving single-agent idasanutlin: grade 1 hematologic toxicity that did not resolve within 4 weeks, grade ≥2 hematologic toxicity, or grade ≥3 nonhematologic toxicity that did not resolve to baseline. Eligible patients received pegylated IFN-α2a at weekly doses of 45 μg concurrently with idasanutlin treatment in part B of this protocol.
The trial was amended to stop dose escalation at the 150-mg dose level based on emerging data from the ongoing trials of idasanutlin. Additionally, a signal of clinical activity already noted at 100 mg daily with a concern for added gastrointestinal toxicity prompted an amendment to cap the dose level at 150 mg and expand the trial to include a total of 6 patients treated at each dose level.
MPN-associated symptoms were evaluated at baseline and at the start of each cycle using the Myeloproliferative Neoplasm Symptom Assessment Form.19 The maximum change in total symptom score (TSS) from baseline across all cycles was computed for each patient. At each dose level, safety data were summarized for each AE by patient and worst grade. Overall response rate (ORR = PR + complete response [CR]) was summarized across dose levels for the single agent and combination therapy portion of the trial (with exact 95% confidence interval [CI]). Descriptive statistics were used to summarize biomarker analyses. SAS software (version 9.4; Cary, NC) was used for analysis.
Mutational analysis of hematopoietic cells
The MPN driver mutational status as well as the presence of wild-type and TP53 inactivating mutations was determined for the 13 participating patients by next-generation high-throughput sequencing with a targeted deep-sequencing assay. Sequencing was performed using a targeted-sequencing panel designed to capture 156 genes implicated in myeloid pathogenesis.20 Samples were sequenced on Illumina HiSeq 4000 with an average target depth of 992× (126-bp paired-end reads). The raw sequence data were aligned to GRCh37 reference genome using the BWA-MEM algorithm (version 0.7.12-r1039).21 Candidate substitutions and insertions/deletions were called using cgpCaVEMan (version 1.7.4) and cgpPindel (version 1.5.4). Candidate mutations were compared with COSMIC (version 81),10 and ExAC (version 03.12)11 and 1000 Genomes (phase 3 release)22,23 were used to manually assess each variant and classify it as pathogenic, likely pathogenic, or variant of uncertain significance. The variants presented in this study are those that were identified as pathogenic or likely pathogenic. The lower limit of detection of the assay employed in this analysis is 0.5% variant allele frequency (VAF). Quantitative assessment of JAK2 V617F allele burden was monitored at baseline, every 3 to 4 months, and at the termination of study treatment. Genomic DNA was extracted from whole blood and submitted to allele-specific quantitative real-time polymerase chain reaction according to an established Clinical Laboratory Improvement Amendments–regulated procedure. Allele burden was calculated using a standard curve, with a minimal level of detection of 0.05%.
Evaluation of MDM2 protein levels
Baseline MDM2 protein levels in the enrolled PV/ET patients and 7 normal samples (peripheral blood, n = 4; bone marrow, n = 3) purchased from ALLcells (Alameda, CA) were evaluated using monoclonal antibody staining and flow cytometric analysis.24 Briefly, cryopreserved mononuclear cells (MNC) collected from enrolled PV/ET patients or 7 normal controls were thawed, washed with phosphate-buffered saline, and then fixed in 0.01% formaldehyde for 10 to 15 minutes and permeabilized by adding 1 mL of ice-cold methanol, mixed gently, and placed at −20°C for 10 minutes. The cells were then centrifuged and washed twice in phosphate-buffered saline 1% bovine serum albumin. Cells were stained with anti-MDM2 antibody (Abcam; Cambridge, MA). Data were acquired using a FACSCaliber analyzer (BD Biosciences).
Evaluation of on-target effects of idasanutlin
Changes in plasma concentrations of the secreted protein macrophage inhibitory cytokine 1 (MIC-1) were assayed at days 5 and 15. MIC-1 is a p53 transcription target that can be readily measured in blood and has been used as a biomarker of TP53 activation.25 To evaluate the effect of idasanutlin on MIC-1 levels, plasma samples were collected from both before treatment and day 5 of treatment with idasanutlin; MIC-1 levels were quantitated using an enzyme-linked immunosorbent assay kit (R&D Systems).
Histopathologic analyses
Bone marrow examination for histopathology and cytogenetic analysis were performed at baseline and at the time of hematologic response or end of study in 4 patients. Analysis was conducted by an expert hematopathologist (B.P.). Histomorphologic remission was evaluated according to revised ELN–International Working Group consensus criteria, defined as disappearance of megakaryocyte hyperplasia and absence of grade 1 reticulin fibrosis.18
Results
Between April 2015 and March 2017, 13 patients were enrolled (1 patient withdrew before receiving treatment). Six patients were enrolled at each dose level (100 and 150 mg). The baseline characteristics of the patients are listed in Table 1. Median age of the cohort was 63.5 years, and 3 of the 12 patients had a history of venous thrombosis. All but 1 patient (JAK2 V617F+) had a diagnosis of PV. Ten patients had received prior hydroxyurea and were deemed either intolerant or resistant by established criteria; 5 had received prior IFN-α therapy, and none of the patients had received prior ruxolitinib treatment. Median baseline spleen length by palpation from the left costal margin was 1.0 cm (range, 0.0-18.0). All 12 patients treated with idasanutlin had a JAK2 V617F+ MPN. Only 1 patient had an inactivating mutation of TP53 (Figure 1). Median JAK2 V617F VAF before therapy was 40.6% (range, 5.3%-88.6%). Several of the patients had additional mutations in myeloid malignancy–associated genes, most commonly TET2 (4 of 12) and DNMT3A (3 of 12). Furthermore, 1 patient had a baseline deletion 5q abnormality, and 11 patients had a normal karyotype. Median percentage of MDM2+ cells present in healthy donor MNCs was 6.9%, whereas median percentage of MDM2+ cells in untreated patient MNCs was 23.4% (P = .0033), as shown in Figure 2A.
Patient demographics and clinical variables by dose level
| 100 mg (n = 6) | 150 mg (n = 6) | Total (N = 12) | |
|---|---|---|---|
| Median age (range), y | 62 (32-83) | 63 (48-68) | 63.5 (32-83) |
| Diagnosis, n (%) | |||
| ET | 1 (16.7) | 0 (0.0) | 1 (8.3) |
| PV | 5 (83.3) | 6 (100.0) | 11 (91.6) |
| Female sex, n (%) | 5 (83.3) | 2 (33.3) | 7 (58.3) |
| Median disease duration (range), mo | 41.6 (14.9-80.1) | 65.4 (21.0-154.3) | 43.9 (14.9-154.3) |
| Previous thrombosis, n (%) | 3 (50.0) | 0 (0.0) | 3 (25.0) |
| Prior hydroxyurea therapy, n (%) | 5 (83.3) | 5 (83.3) | 10 (83.3) |
| Median spleen length by palpation (range), cm | 1.0 (1.0-7.0) | 2.5 (0.0-18.0) | 1.0 (0.0-18.0) |
| Median leukocytes (range), ×109/L | 10.3 (4.9-15.9) | 12.2 (7.4-28.3) | 11.3 (4.9-28.3) |
| Median hemoglobin (range), g/dL | 13.4 (12.8-15.6) | 13.7 (12.3-14.7) | 13.6 (12.3-15.6) |
| Median hematocrit (range), % | 41.5 (38.3-46.7) | 43.0 (40.7-47.8) | 42.3 (38.3-47.8) |
| Median platelets (range), ×109/L | 443.5 (118.0-1339.0) | 412.0 (153.0-700.0) | 443.5 (118.0-1339.0) |
| Median LDH (range), U/L* | 252.0 (184.0-370.0) | 252.0 (177.0-616.0) | 252.0 (177.0-616.0) |
| Median JAK2 V617F VAF (range), % | 23.7 (5.3-69.3) | 63.7 (6.3-88.6) | 40.6 (5.3-88.6) |
LDH, lactate dehydrogenase. Upper limit of normal for LDH is 220 U/L.
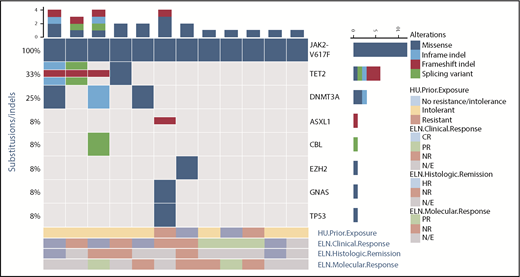
Baseline genomic alterations. The genomic profiles of 11 patients as determined by next-generation sequencing studies are shown. Each column represents an individual patient. Bars at the top indicate the number of alterations identified per patient. Mutated genes are listed on the right. Frequency of each mutation in these 11 patients is listed on the left. Type of alteration is denoted by key. Additionally, prior hydroxyurea (HU) exposure qualified by intolerance or resistance is shown below, and this is further coupled to the clinical, pathologic, and molecular response by ELN criteria for each patient. HR, histologic response; N/E, not evaluable; NR, no response.
Baseline genomic alterations. The genomic profiles of 11 patients as determined by next-generation sequencing studies are shown. Each column represents an individual patient. Bars at the top indicate the number of alterations identified per patient. Mutated genes are listed on the right. Frequency of each mutation in these 11 patients is listed on the left. Type of alteration is denoted by key. Additionally, prior hydroxyurea (HU) exposure qualified by intolerance or resistance is shown below, and this is further coupled to the clinical, pathologic, and molecular response by ELN criteria for each patient. HR, histologic response; N/E, not evaluable; NR, no response.
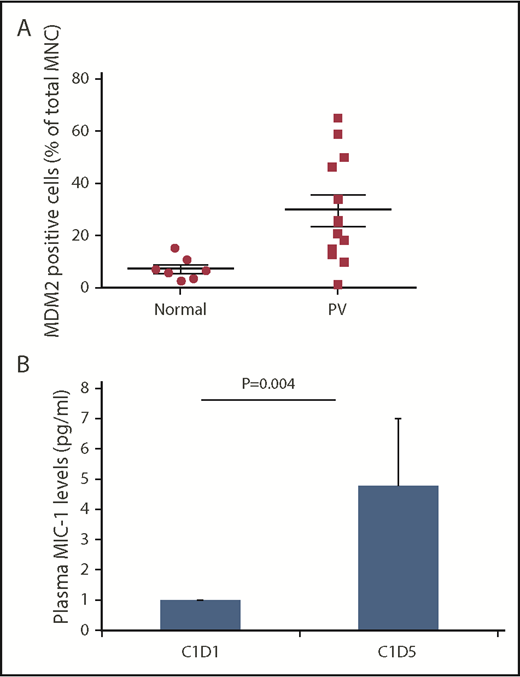
Baseline MDM2 and day-5 plasma MIC-1 levels. (A) Baseline MDM2 levels were higher in patients with PV/ET compared with normal controls. The pretreatment MNC median MDM2 level was approximately fourfold higher in the PV/ET patients enrolled on the study compared with normal controls. (B) Plasma MIC-1 levels are increased on day 5 of idasanutlin therapy. p53 pathway activation is reflected by a 4.8-fold increase from baseline of MIC-1 protein levels by day 5 (P = .004).
Baseline MDM2 and day-5 plasma MIC-1 levels. (A) Baseline MDM2 levels were higher in patients with PV/ET compared with normal controls. The pretreatment MNC median MDM2 level was approximately fourfold higher in the PV/ET patients enrolled on the study compared with normal controls. (B) Plasma MIC-1 levels are increased on day 5 of idasanutlin therapy. p53 pathway activation is reflected by a 4.8-fold increase from baseline of MIC-1 protein levels by day 5 (P = .004).
Median duration of the study was 54.2 weeks (range, 23.1-131.1), and median number of cycles of therapy administered was 10.5 (range, 5-20), as summarized in Table 2. Four patients received combination therapy with pegylated IFN-α2a (median, 3 cycles; range, 2-15). To date, 7 patients have ended treatment (refused further treatment, n = 4; investigator decision, n = 3).
Treatment information by dose level of idasanutlin
| 100 mg (n = 6) | 150 mg (n = 6) | Total (N = 12) | |
|---|---|---|---|
| Median n of cycles (range) | 9 (7-14) | 13.0 (5-20) | 10.5 (5-20) |
| Median duration on study (range), wk | 36.7 (29.0-131.1) | 77.6 (23.1-105.0) | 54.2 (23.1-131.1) |
| DLT, n* | 0 | 0 | 0 |
| N of patients with treatment holiday, n of cycles | |||
| 1 | 0 | 1 | 1 |
| 2-3 | 1 | 3 | 4 |
| >3 | 1 | — | 1 |
| N of patients continuing on part A (cycle 7+) | 3 | 4 | 7 |
| N of patients eligible for and receiving treatment on part B | 3 | 1 | 4 |
| Pegylated IFN-α2a (part B) | (n = 3) | (n = 1) | (n = 4) |
| Median n of cycles (range) | 2.5 (2-3) | 15 | 3 (2-15) |
| Reason for discontinuation of treatment | |||
| Patient refusal | 2 | 2 | 4 |
| Investigator decision | 2 | 1 | 3 |
DLT defined as nonhematologic AE of grade 3+ or hematologic AE of grade 2+ thrombocytopenia or grade 3+ neutropenia or anemia during cycle 1 and evaluated for 56 d.
Safety and toxicity
No DLTs were observed. Five patients (41.7%) experienced a grade 3 AE; all were nonhematologic (100-mg dose, n = 4; 150-mg dose, n = 1). Grade 4 AEs were not noted at either dose level (Table 3). As expected, the most common AEs involved the gastrointestinal tract and were relegated to days 3 to 6 of individual cycles. Grade 1/2 nausea occurred in 10 (83%) of 12 patients and was well controlled in a majority of patients with an antiemetic regimen (ondansetron at 8 mg twice daily, decadron at 8 mg twice daily, and lorazepam at 0.5 mg twice daily) administered for the 5 days of study drug dosing. Grade 1 thrombocytopenia occurred in 1 patient in part B, requiring dose reduction of idasanutlin from 150 to 100 mg; it was then reescalated to 150 mg without reoccurrence. The single ET patient enrolled on the study developed grade 2 deep venous thrombosis 1 week after the initiation of combination therapy with pegylated IFN-α2a and was removed from the trial. This patient had persistent thrombocytosis despite resolution of baseline microvascular symptoms. At the time of this report, 2 patients remain on trial after 24 and 36 months, respectively.
Treatment-emergent AEs occurring in at least 2 patients regardless of attribution
| n (%) | |||||
|---|---|---|---|---|---|
| 100 mg (n = 6) | 150 mg (n = 6) | Total (N = 12) | |||
| Grade 1/2 | Grade 3 | Grade 1/2 | Grade 3 | All grades | |
| Diarrhea | 5 (83.3) | 1 (16.7) | 5 (83.3) | 11 (91.7) | |
| Fatigue | 4 (66.7) | 2 (33.3) | 3 (50.0) | 1 (16.7) | 10 (83.3) |
| Constipation | 6 (100) | 4 (66.7) | 10 (83.3) | ||
| Nausea | 5 (83.3) | 5 (83.3) | 10 (83.3) | ||
| Headache | 4 (66.7) | 1 (16.7) | 2 (33.3) | 7 (50) | |
| Abdominal pain | 4 (66.7) | 2 (33.3) | 6 (50) | ||
| Upper respiratory tract infection | 1 (16.7) | 4 (66.7) | 5 (41.7) | ||
| Dry skin | 2 (33.3) | 2 (33.3) | 4 (33.3) | ||
| Pain | 2 (33.3) | 1 (16.7) | 1 (16.7) | 4 (33.3) | |
| Pruritus | 2 (33.3) | 2 (33.3) | 4 (33.3) | ||
| Vomiting | 3 (50.0) | 1 (16.7) | 4 (33.3) | ||
| Arthralgia | 3 (50) | 3 (25) | |||
| Dizziness | 3 (50) | 3 (25) | |||
| Cough | 2 (33.3) | 1 (16.7) | 3 (25.0) | ||
| Decreased appetite | 2 (33.3) | 1 (16.7) | 3 (25.0) | ||
| Dyspepsia | 2 (33.3) | 1 (16.7) | 3 (25.0) | ||
| Flushing | 2 (33.3) | 1 (16.7) | 3 (25.0) | ||
| Oropharyngeal pain | 1 (16.7) | 2 (33.3) | 3 (25.0) | ||
| Dysgeusia | 1 (16.7) | 2 (33.3) | 3 (25.0) | ||
| Dyspepsia | 2 (33.3) | 1 (16.7) | 3 (25.0) | ||
| Epistaxis | 1 (16.7) | 1 (16.7) | 2 (16.7) | ||
| Weight gain | 1 (16.7) | 1 (16.7) | 2 (16.7) | ||
| Alopecia | 1 (16.7) | 1 (16.7) | 2 (16.7) | ||
| Anorexia | 1 (16.7) | 1 (16.7) | 2 (16.7) | ||
| Back pain | 1 (16.7) | 1 (16.7) | 2 (16.7) | ||
| Chest pain | 2 (33.3) | 2 (16.7) | |||
| Disorientation | 2 (33.3) | 2 (16.7) | |||
| Eye infection | 1 (16.7) | 1 (16.7) | 2 (16.7) | ||
| Flatulence | 1 (16.7) | 1 (16.7) | 2 (16.7) | ||
| GERD | 1 (16.7) | 1 (16.7) | 2 (16.7) | ||
| Heartburn | 1 (16.7) | 1 (16.7) | 2 (16.7) | ||
| Rash | 2 (33.3) | 2 (16.7) | |||
| Sinusitis | 2 (16.7) | 2 (16.7) | |||
GERD, gastroesophageal reflux disease.
Clinical activity
Idasanutlin therapy was associated with significant clinical activity. Clinical responses as assessed by ELN criteria are listed in Table 4 and included CRs, defined by normalization of the hematologic profile and resolution of palpable splenomegaly and disease-related symptoms. The ORR was 58% (7 of 12) in part A and 50% (2 of 4) in part B, for a combined ORR of 75% (95% CI, 42.8%-94.5%). Median duration of response (in 9 responders, including 7 receiving monotherapy and 2 receiving combination therapy) was 16.8 months (95% CI, 12.5 to not estimated; range, 3.5-26.7). Four patients were treated in part B with combination pegylated IFN-α2a, and of the 3 patients who received >1 cycle of combination therapy, 2 attained a response (CR and PR), as depicted by their hematologic parameters (supplemental Figure 1, available on the Blood Web site).
Response outcomes for parts A and B
| NE | NR | PR | CR | Overall response (PR + CR), n (%) | |
|---|---|---|---|---|---|
| Part A (n = 12) | 1* | 4† | 3‡ | 4 | 7 (58) |
| Part B (n = 4)† | 2 | 1 | 1 | 2 (50) | |
| Part A + B ORR | 9 (75) | ||||
| 95% CI, % | 42.8-94.5 |
| NE | NR | PR | CR | Overall response (PR + CR), n (%) | |
|---|---|---|---|---|---|
| Part A (n = 12) | 1* | 4† | 3‡ | 4 | 7 (58) |
| Part B (n = 4)† | 2 | 1 | 1 | 2 (50) | |
| Part A + B ORR | 9 (75) | ||||
| 95% CI, % | 42.8-94.5 |
NE, not evaluable; NR, no response.
NE due to patient decision to withdraw from study after 4 cycles because of gastrointestinal toxicity.
Four patients from part A who had NR entered part B combination idasanutlin + IFN-α.
Residual splenomegaly likely resulting from known portal vein thrombosis in 1 patient, likely a CR (n = 1).
Median number of therapeutic phlebotomies was 2.5 (range, 0-11) during the 12 months before enrollment and 1.5 (range, 0-5) during the 12 months after enrollment. In patients receiving treatment for ≥12 months (n = 6), median number of therapeutic phlebotomies was 0.5, and in those treated for <12 months (n = 6), median was 2.0. Six patients were able to delay treatment cycles because of attainment of hematologic response and not meeting prespecified hematologic parameters for reinstitution of treatment (Table 2); in 5 of the 6 patients, this occurred for ≥2 cycles; the longest delay was 7 cycles of delayed treatment with continued hematologic response.
Seven (70%) of the 10 patients with baseline palpable splenomegaly had resolution of this clinical finding on examination. Idasanutlin therapy also had a dramatic effect on MPN-related symptomology (Figure 3). Median TSS was 13.5 (range, 1-66) at baseline. The Median maximum reduction in TSS across all cycles was 81.5% (range, −100%-37.5%). Nine (75%) of 12 patients (95% CI, 42.8%-94.5%) had a ≥50% decrease in TSS from baseline. Maximum improvements occurred at cycles 2 to 3 for 5 patients; in the remaining patients, maximum improvements were seen between cycles 6 and 13.
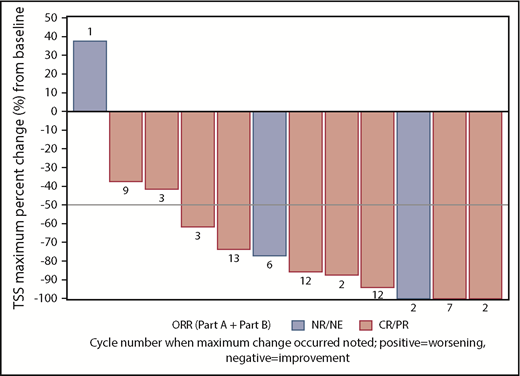
Maximum TSS response on study. Nine patients treated with idasanutlin attained at least a 50% reduction in TSS. The cycle in which the best percentage reduction was first noted is shown in association with each patient response. NE, not evaluable; NR, no response.
Maximum TSS response on study. Nine patients treated with idasanutlin attained at least a 50% reduction in TSS. The cycle in which the best percentage reduction was first noted is shown in association with each patient response. NE, not evaluable; NR, no response.
Pharmacodynamic studies
Plasma MIC-1 levels were significantly increased by 4.8-fold on day 5 of the first cycle of idasanutlin therapy, as compared with plasma levels before treatment in 6 patients with available paired samples (P = .004), as shown in Figure 2B. In 5 patients, plasma MIC-1 levels continued to be elevated at day 15, indicative of persistent TP53 activation.
Idasanutlin therapy was associated with a 43% median reduction of the JAK2 V617F VAF (range, −91.9% to +60.3%; Figure 4). The patient with an increase in the allelic burden of JAK2 V617F after therapy had a TP53 mutation. None of the patients who had repeat sequencing were found to have acquired a p53 mutation during treatment. Interestingly, the patient with the 5q− abnormality at baseline reverted to a normal karyotype after 15 months of therapy, when this patient had also achieved a CR by ELN criteria.
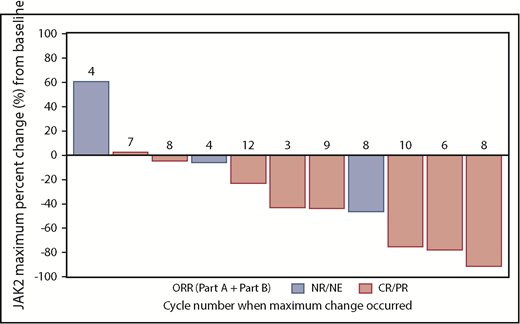
JAK2 driver mutation response with idasanutlin therapy. The waterfall plots demonstrate the spectrum of molecular responses observed with idasanutlin therapy, and the cycle in which the maximal reduction in VAF was first noted is shown in association with the response bar. NE, not evaluable; NR, no response.
JAK2 driver mutation response with idasanutlin therapy. The waterfall plots demonstrate the spectrum of molecular responses observed with idasanutlin therapy, and the cycle in which the maximal reduction in VAF was first noted is shown in association with the response bar. NE, not evaluable; NR, no response.
Histopathologic responses
Five patients had baseline bone marrow evaluations and response assessment bone marrow biopsies during therapy (supplemental Figure 2). Among the patients treated with idasanutlin alone, 2 showed evidence of histologic remission as characterized by a reduction in overall cellularity and number of megakaryocytes and correction of abnormal megakaryocytic morphology. Another patient had a reduction in overall cellularity (from 65% to 50%). Among the 2 biopsied patients treated with idasanutlin in combination with pegylated IFN-α2a, 1 showed evidence of histologic progression, with an increase in overall cellularity (from 70% to 90%), and the other had evidence of remission with partial resolution of fibrosis, decreasing from MF2 to MF1. There were no significant histologic changes in myeloid or erythroid lineage in any of the patients, other than numeric changes accounted for by shifts in overall cellularity. There were also no significant changes in blast percentage for any of the patients (all <5%, with no discernible trend).
Discussion
Presently, therapies for MPNs, with the exception of allogeneic HSC transplantation, are directed toward normalizing blood counts, diminishing the degree of splenomegaly, and relieving systemic symptoms but are incapable of preventing progression to MF or acute myeloid leukemia. These limitations have led to the search for therapies that specifically target the malignant clone and favorably modify the disease course. Nakatake et al26 first demonstrated that JAK2 V617F alters p53 responses to DNA damage by upregulating the La antigen, which increases MDM2 protein translation. TP53 plays a pivotal role in the maintenance of cell integrity in response to a variety of stresses by controlling target genes that regulate cell-cycle arrest, apoptosis, DNA repair, and metabolism.8,9 Although ∼50% of cancers contain mutated forms of TP53, which lead to loss of function, TP53 mutations are much less common in MPNs. TP53 mutations at a low allele burden can be found in chronic-phase MPNs; however, TP53 loss of heterozygosity is associated with leukemic transformation, with 20% of MPN-associated leukemia cases harboring a TP53 mutation.27-31
p53 levels are regulated by MDM2 through a negative feedback loop. MDM2 not only facilitates p53 degradation but also binds TP53 and inhibits its transcription, resulting in p53 stabilization, accumulation, and activation.11 We have recently shown that MDM2 levels are increased in PV CD34+ cells, whereas TP53 messenger RNA levels are lower as compared with normal CD34+ cells. The selective upregulation of MDM2 in MPN CD34+ cells led us to examine if MDM2 antagonists termed nutlins can selectively eliminate MPN CD34+ cells while sparing the residual normal CD34+ cells.6,7 Nutlins inhibit tumor growth in a nongenotoxic manner in xenograft murine tumor models.8,9,32 Using a clinically available MDM2 antagonist, we first showed in preclinical studies that nutlins have the potential to be potent weapons to treat PV and MF patients with wild-type TP53.12 Treatment of PV CD34+ cells with the MDM2 antagonist alone or in combination with IFN-α resulted in the depletion of malignant HSC/HPCs while sparing normal HSCs/HPCs.7 Additionally, subtherapeutic doses of pegylated IFN-α2a in combination with an MDM2 antagonist were shown to preferentially inhibit PV CD34+ cell proliferation and colony formation.12 The use of pegylated IFN-α2a in combination with another targeted agent would allow for the administration of lower doses of pegylated IFN-α2a, thereby reducing dose-dependent toxicities frequently seen in PV/ET.
Nutlins and pegylated IFN-α2a work in concert to promote TP53 expression, with pegylated IFN-α2a enhancing transcriptional activity via the p38 MAPK pathway and nutlins preventing p53 degradation and promoting TP53 transcription via interruption of the MDM2-p53 interaction.6,7 Because pegylated IFN-α2a and nutlins both target the TP53 pathway, when used in combination, lower doses of each agent should be effective. Therefore, the use of idasanutlin alone or in combination with pegylated IFN-α2a would be anticipated to enhance TP53 expression by different mechanisms and represents a novel approach to the treatment of PV/ET.
To exploit the therapeutic window between normal and MPN HSCs/HPCs, we hypothesized that lower doses of a therapeutically active nutlin could be used to selectively deplete the malignant HSCs/HPCs rather than their normal counterparts, thereby avoiding the cumulative potential gastrointestinal and hematologic toxicities seen in other oncology trials. Surprisingly, severe and prolonged thrombocytopenia was not observed in any of the patients treated, even after 1 to 2 years. The limiting AE that remains is gastrointestinal toxicity occurring during the period of time of drug administration; it has been rapidly reversible. It is important to note that low-grade gastrointestinal toxicity occurring during the 5 days of idasanutlin dosing each month can contribute to reduced quality of life and work productivity, leading to treatment discontinuation despite excellent hematologic responses. This was the main reason patients withdrew consent in this study, despite not experiencing grade 3/4 nonhematologic toxicity. This phenomenon is important to consider as this class of agents is further developed in the setting of a hematologic malignancy that has a median survival of nearly 2 decades and treatments are administered for extended periods. Additional efforts to develop premedication regimens or drug schedules that might decrease these events are sought.
In this single-institution phase 1 trial, idasanutlin therapy was well tolerated in a population of previously treated patients with PV. Clinical responses were attained in a majority of patients receiving idasanutlin monotherapy, with rapid and dramatic symptom responses achieved. It should be noted that only 1 patient with ET was treated in this phase 1 study, and therefore, it is not possible to evenly extend conclusions on efficacy across both disease types. After the administration of idasanutlin, on-target activation of the TP53 pathway was documented by elevation of plasma MIC-1 protein levels measured on day 5. Future studies evaluating pathologic response with idasanutlin therapy should also confirm induction of apoptosis of the malignant clone by a relevant assay. Baseline MDM2 protein levels were elevated in a majority of enrolled patients but were not predictive of response, likely a consequence of the small sample size. The sole patient harboring a TP53 inactivating mutation failed to achieve a clinical response and was the only patient who had a documented increase in JAK2 V617F VAF while on study. In conclusion, idasanutlin therapy was associated with an extraordinarily high degree of clinical efficacy, which has led to a currently underway global phase 2 trial of idasanutlin therapy for hydroxyurea-resistant/intolerant PV patients (registered at www.clinicaltrials.gov as #NCT03287245).
The protocol will be made available upon request by email to the corresponding author.
The online version of this article contains a data supplement.
The publication costs of this article were defrayed in part by page charge payment. Therefore, and solely to indicate this fact, this article is hereby marked “advertisement” in accordance with 18 USC section 1734.
Acknowledgments
The authors thank Gwen Nichols, Lin Chen, and Brian Higgins from Roche for their support and advice and Bridget Marcellino for critical manuscript review.
This research was supported by grants from the National Institutes of Health, National Cancer Institute (MPN Research Consortium grant 5P01CA108671-09), and the Leukemia and Lymphoma Society (LLS Translational Research Program R6506-17).
Authorship
Contribution: J.M., M.L., H.K., E.V., L.X., L.S., R.M., B.P., V.N., R.R., A.D., and R.H. designed the research study; J.M., M.L., E.V., L.X., and R.H. performed the research; J.M., M.L., H.K., B.P., N.F., V.N., R.R., A.D., and R.H. analyzed the data; and J.M., M.L., H.K., E.V., L.X., L.S., R.M., B.P., V.N., R.R., A.D., and R.H. wrote and reviewed the paper.
Conflict-of-interest disclosure: J.M. reports clinical trial research support paid to the institution from Incyte, Roche, Novartis, CTI Biopharma, Janssen, Merck, Promedior, and Celgene and has been a clinical trial steering committee and scientific advisory board member for Roche, CTI Biopharma, Incyte, and Celgene; R.R. reports research funding from Constellation, Incyte, and Stemline Therapeutics and consulting fees from Incyte, Celgene, Agios, Apexx, BeyondSpring, Partner Therapeutics, and Jazz Pharmaceuticals; R.M. reports research support from Incyte, Celgene, Genentech, and CTI Biopharma and consultant fees from Novartis, Sierra Oncology, and La Jolla Pharmaceuticals; and R.H. reports research support from Janssen, Merus, Dompe, Scholar Rock, Summer Road, Forbius, and Incyte and scientific advisory board fees from Novartis and La Jolla Pharmaceuticals. The remaining authors declare no competing financial interests.
Correspondence: John Mascarenhas, Tisch Cancer Institute, Icahn School of Medicine at Mount Sinai, One Gustave L. Levy Place, Box 1079, New York, NY 10029; e-mail: john.mascarenhas@mssm.edu.

This feature is available to Subscribers Only
Sign In or Create an Account Close Modal