

Key Points
Cohesin depletion abrogates induction of dynamic erythroid transcriptional programmes.
Cohesin-dependent dynamic gene expression upon erythroid differentiation is both prespecified and repressed by Etv6 in stem cells.

Abstract
Cohesin complex disruption alters gene expression, and cohesin mutations are common in myeloid neoplasia, suggesting a critical role in hematopoiesis. Here, we explore cohesin dynamics and regulation of hematopoietic stem cell homeostasis and differentiation. Cohesin binding increases at active regulatory elements only during erythroid differentiation. Prior binding of the repressive Ets transcription factor Etv6 predicts cohesin binding at these elements and Etv6 interacts with cohesin at chromatin. Depletion of cohesin severely impairs erythroid differentiation, particularly at Etv6-prebound loci, but augments self-renewal programs. Together with corroborative findings in acute myeloid leukemia and myelodysplastic syndrome patient samples, these data suggest cohesin-mediated alleviation of Etv6 repression is required for dynamic expression at critical erythroid genes during differentiation and how this may be perturbed in myeloid malignancies.
Introduction
Cohesin is an evolutionary conserved multiprotein complex that topologically entraps DNA, thereby establishing interactions of >1 DNA fragment.1 This cohesin-mediated DNA tethering occurs across multiple genomic layers and regulates critical cellular functions. The cohesin complex is an absolute requirement for replication fork stability,2 DNA damage repair via homologous recombination,3 and, critically, for coordinated sister chromatid cohesion to ensure orderly chromosomal segregation.4 Recently, however, a role for cohesin has been described in coordinating contact between noncontiguous regions of the same DNA strand, such as in mediating interactions between proximal and distal cis-regulatory elements (eg, promoter-enhancer interactions) and also in insulation of topologically associating domains.5-7 Structurally, cohesin forms a distorted ring, with SMC1A/B and SMC3 as its arms, whereas RAD21 reinforces the interaction of the 2 SMC subunits.8 The role of STAG2/1 is less well appreciated, but these may function during the sensing and recruitment of the complex to DNA.9
Alterations of cohesin function have been described in both inherited developmental disorders such as Cornelia de Lange and Roberts syndromes and via somatically acquired mutations in malignancy. Mutations in members of the cohesin complex associate with an unusual mixture of cancer types: bladder cancer, glioblastoma, Ewing sarcoma, and myeloid neoplasia.10-12 Specifically for myeloid neoplasia, STAG2 mutations occur at a frequency of ∼5% to 10% in myelodysplastic syndromes (MDS), de novo, and secondary acute myeloid leukemia (AML), whereas mutations in RAD21, SMC1A, and SMC3 altogether display a prevalence of another 5%.13-16 In general, cohesin mutations are heterozygous, although STAG2 and SMC1A are X chromosome linked. The mutations are predicted to confer loss or dominant negative functions and usually lead to a decrement of protein levels of cohesin members.11,17
In cohesin-mutated tumors, and specifically in myeloid malignancies with cohesin mutations, there is no evidence to associate cohesin mutations with aneuploidy or abrogation of proper chromosome segregation.17-20 This implies that residual cohesin function in mutated cells is sufficient to coordinate sister chromatid cohesion. Furthermore, several groups have demonstrated in different models that loss, downregulation, or overexpression of mutated forms of cohesin genes cause alterations in the balance between hematopoietic stem and progenitor cells (HSPC) and differentiated cells that are associated with altered gene expression programs and chromatin accessibility.17-19,21,22 These observations are therefore compatible with the disease-associated/-causative events occurring through cohesin-associated defects at cis-regulatory loops and/or topologically associating domain boundaries. Indirect evidence for altered hematopoiesis in cohesin-perturbed cells also emerges from recent investigations of clonal dynamics of MDS, in which patients with STAG2 mutations significantly associated with high-risk disease, increased progression to AML, and a shorter overall survival.23
In this study, we comprehensively address the function of the cohesin complex during normal hematopoiesis and how its abrogation biases differentiation and predisposes toward myeloid malignancy.
Materials and methods
Cell culture conditions
HPC-7 cells (kindly provided by Leif Carlsson, Umeå University, Sweden) were cultured in Iscove modified Dulbecco medium (Gibco) supplemented with 10% fetal bovine serum (Sigma-Aldrich), 100 ng/μL murine recombinant stem cell factor (SCF, PeproTech) and 74.8 mM monothioglycerol (Sigma-Aldrich). For all experiments, cells were used after 1 to 3 weeks of expansion in liquid culture. For the erythroid differentiation, SCF was decreased to 20 ng/μL and human recombinant erythropoietin (EPO, PeproTech) was added at 4 U/L. For the myeloid differentiation, SCF was decreased to 20 ng/μL and murine recombinant interleukin-3 (IL-3, PeproTech) was added at 50 ng/μL.
Flow cytometry/FACS
For the antibodies, refer to the specific section in the supplemental Materials and methods on the Blood Web site. With the exception of the GFP experiments (supplemental Figure 6D), which were performed on a BD Canto II, flow cytometry was performed on a BD Fortessa. Sorting of GFP+ cells was performed on a BD FACS Aria II flow cytometer.
Western blotting
For the preparation of whole cellular extracts and western blot, refer to our previous work.24
ChIP, library preparation, sequencing
Approximately 15 × 10e6 cells were suspended in phosphate-buffered saline and cross-linked for 15 minutes at room temperature by the addition of 1% formaldehyde (Sigma-Aldrich), followed by quenching with 125 mM glycine for 5 minutes. Cells were washed twice in cold phosphate-buffered saline and stored at −80°C. All chromatin immunoprecipitation (ChIP) preparations were performed with previously frozen cell stocks. Cross-linked cells were thawed on ice, suspended in lysis buffer (50 mM Tris-HCl pH 8.0, 1% sodium dodecyl sulfate (SDS), 10 mM EDTA, 1× complete protease inhibitor) and sonicated on a Diagenode Bioruptor plus sonicator for 15 cycles and 30 seconds with 30 seconds between cycles. Next, lysates were cleared by centrifugation at 16 000g for 10 minutes at 4°C, 25 μL/sample was reserved for input, whereas the remaining lysates were diluted ×10 in a modified RIPA buffer (10 mM Tris-HCl pH 8.0, 1% Triton X-100, 0.1% Na-deoxycholate, 90 mM NaCl, 1X complete protease inhibitor) and incubated for 4 hours with antibodies. Chromatin-antibody conjugates were afterward supplemented with 17.5 μL each of protein A and G Dynabeads (Thermo Fisher Scientific) and further incubated overnight. Next, beads were washed 3 times with wash buffer A (20 mM Tris-HCl pH 8.0, 150 mM NaCl, 2 mM EDTA pH 8.0, 1% Triton X-100, 0.1% SDS) and 2 times with wash buffer B (20 mM Tris-HCl pH 8.0, 500 mM NaCl, 2 mM EDTA pH 8.0, 1% Triton X-100, 0.1% SDS). DNA was eluted off the beads by incubation on a Thermo-mixer (Eppendorf) at 30°C for 15 minutes and 900 rpm in 125 μL elution buffer (1% SDS, 100 mM NaHCO3). Cross-link reversal and RNA degradation (with 2 μL of 10 mg/mL RNase A [Thermo Fisher Scientific]) were performed simultaneously for 4 hours at 65°C. The DNA was finally purified with the QIAquick PCR Purification Kit from Qiagen.
For ChIP-sequencing (ChIP-seq) experiments, ChIP DNA was used to prepare multiplexed libraries following the Illumina TruSeq DNA Sample Preparation v2 protocol and kit. Amplified libraries were size-selected for fragments between 250 and 450 bp using a 2% freshly prepared low-range agarose gel. Libraries were quantified by quantitative polymerase chain reaction (qPCR) using the NEBNext Library Quant Kit for Illumina (New England Biolabs), as recommended by protocol. Finally, library sizes, purity, and free adapters were quantified on an Agilent 2100 Bioanalyzer using the Agilent DNA 1000 Kit as per the manufacturer’s instructions. Libraries were sequenced on an Illumina HiSeq 4000 for 50 bp in single-read mode. To avoid adapter hopping, free adapters were removed (if present) through a second size selection in gel, whereas samples were stored separated at −20°C and only multiplexed using unique dual indexing pooling combinations of up to 6 indexes/lane.
pCHiC
Promoter capture Hi-C (pCHiC) was performed in close analogy to Schoenfelder et al25 with several differences: (1) cross-linking was performed with a final concentration of 1% formaldehyde; (2) nuclei were isolated during the lysis using 15 mL Dounce homogenizers (10 strokes with the loose grinding pestle, 10 strokes with the tight grinding pestle); and (3) Library HiC amplification was performed with 6 cycles.
Final pCHiC were quantified with Qubit and quality checked on an Agilent 2100 Bioanalyzer using the Agilent DNA High Sensitivity Kit as per the manufacturer’s instructions. Libraries were sequenced on an Illumina HiSeq 4000 (each library in 1 lane).
Detailed methods for cloning, virus production, transfection and transduction, chromatin fractionation, rapid immunoprecipitation mass spectrometry of endogenous proteins (RIME), coimmunoprecipitation, RNAseq, ChIP-seq, pCHiC, RIME, and human data analysis are provided in the supplemental Materials and methods section.
Data availability
All ChIP-seq, pCHiC, and RNAseq data have been deposited in the GEO database under the accession number GSE129478. Raw RIME-MS will be made available upon request.
Results
Cohesin dosage at active cis-regulatory elements varies between hematopoietic populations during differentiation
To determine the role of cohesin in hematopoiesis, we first assessed the dynamic expression patterns of cohesin members in single murine cells during hematopoietic differentiation.26 Expression of cohesin members, as exemplified by Rad21 (Figure 1A, diffusion plot), differed significantly between HSPC and committed stages, with increased expression demonstrated upon differentiation. However, this was not uniform across lineages; when we further subdivided progenitors into myeloid (defined as Spi1high single cells) and erythroid precursors (Klf1high single cells), we observed a marked increase of Rad21, Stag2, and Smc3 expression in erythroid progenitors only, with no change evident in myeloid cells (Figure 1A, box plot; supplemental Figure 1A). Of note, the expression of Smc1a and Stag1 did not significantly differ between stem and progenitor populations.

Cohesin dosage at active cis-regulatory elements varies between hematopoietic populations during differentiation. (A) Left: diffusion map of scRNASeq expression of Rad21, colored in red with http://blood.stemcells.cam.ac.uk/geneMap.html. The color corresponds to a log2 scale of expression ranging between 0 and the maximum value. LT-HSC, HSPC, and progenitors are highlighted in approximation of the original single-cell sorting. Right: box plots with 10th to 90th percentiles of Rad21 expression in the indicated populations. Erythroid and myeloid progenitors were empirically considered because all the cells with normalized expression of Klf1 > 10 and Spi1 > 10, respectively. (B) Graphical schema of the experimental design to determine cohesin dynamics during normal erythroid and myeloid differentiation. (C) Representative longitudinal flow cytometry plots. HPC were differentiated toward the erythroid and myeloid lineages. Day 2 of EPO induction was highlighted as the optimal erythroid (or Ery) transition state, whereas cells induced for 3 days with IL-3 were called myeloid (or myelo) transition cells. (D) Density heat map and (E) average profiles of Rad21 binding at cohesin-associated regions in the indicated cellular states. (F) Total count of significant differentially bound Rad21 peaks comparing HPC to the indicated differentiation lineage. Left panels show pie charts of genomic location of differential bound peaks. Scatter plots (right): differential Rad21 binding at active promoters/enhancers in the indicated populations. Blue dots (lost) show peaks that decrease, whereas red/purple dots (gained for erythroid and myeloid cells respectively) show peaks that increase during differentiation. LT, long term.
Cohesin dosage at active cis-regulatory elements varies between hematopoietic populations during differentiation. (A) Left: diffusion map of scRNASeq expression of Rad21, colored in red with http://blood.stemcells.cam.ac.uk/geneMap.html. The color corresponds to a log2 scale of expression ranging between 0 and the maximum value. LT-HSC, HSPC, and progenitors are highlighted in approximation of the original single-cell sorting. Right: box plots with 10th to 90th percentiles of Rad21 expression in the indicated populations. Erythroid and myeloid progenitors were empirically considered because all the cells with normalized expression of Klf1 > 10 and Spi1 > 10, respectively. (B) Graphical schema of the experimental design to determine cohesin dynamics during normal erythroid and myeloid differentiation. (C) Representative longitudinal flow cytometry plots. HPC were differentiated toward the erythroid and myeloid lineages. Day 2 of EPO induction was highlighted as the optimal erythroid (or Ery) transition state, whereas cells induced for 3 days with IL-3 were called myeloid (or myelo) transition cells. (D) Density heat map and (E) average profiles of Rad21 binding at cohesin-associated regions in the indicated cellular states. (F) Total count of significant differentially bound Rad21 peaks comparing HPC to the indicated differentiation lineage. Left panels show pie charts of genomic location of differential bound peaks. Scatter plots (right): differential Rad21 binding at active promoters/enhancers in the indicated populations. Blue dots (lost) show peaks that decrease, whereas red/purple dots (gained for erythroid and myeloid cells respectively) show peaks that increase during differentiation. LT, long term.
To address if this variable expression of cohesin member transcripts translated into differing global dosages of cohesin complex protein binding at chromatin between earlier hematopoietic stem cell (HSC), erythroid, and myeloid precursors during differentiation, we used an HSPC line, HPC727 (hereafter HPC), which recapitulates the epigenetic landscape of murine HSC.28 We performed chromatin immunoprecipitation followed by parallel sequencing (ChIP-seq) for cohesin proteins Rad21 (hereafter as a proxy for the entire cohesin complex) and Smc1a, the major cohesin interaction partner Ctcf, RNA polymerase II, and chromatin marks for promoters and enhancers: H3K4me3, H3K4me1, and H3K27ac. Cohesin-bound chromatin regions were classified into active and primed enhancers, active and inactive promoters, and insulator/other regions (as defined in supplemental Figure 1B). In agreement with previous studies,7 approximately 60% of the cohesin peaks were enriched at insulators, with the remaining 40% bound to active, H3K27ac-associated, regulatory elements (supplemental Figure 1C).
To determine dynamic changes in cohesin binding during hematopoietic differentiation, we repeated ChIP-seq analysis for Rad21, Smc1a, and Ctcf in cells that were induced for 48 hours with EPO (hereafter erythroid cells) or 72 hours with IL-3 (myeloid cells) (Figure 1B). These time points were chosen because cells still demonstrated an HPC surface phenotype; however, longitudinal flow analysis demonstrated that they were transitioning to more differentiated cells (Figure 1C). A discrete, although significant, decrease in Rad21 binding at insulators and other elements was noted between the HPC and myeloid cells (Figure 1D-F). This decrease was not shared by Smc1a binding (supplemental Figure 1D-E). Strikingly, during erythroid differentiation, a marked increase in both Rad21 and Smc1a binding was demonstrated at active cis-regulatory, but not insulator, elements (Figures 1D-F; supplemental Figure 1D-E). Increased Smc1a binding was evident, although Smc1a gene expression did not differ between earlier hematopoietic stages and erythroid precursors, possibly because of high baseline protein expression and, thus, high protein availability. Of note, erythroid cells also displayed increased total protein levels of Rad21 and Stag2 compared with HPC and myeloid cells, highlighting the necessity of increased cohesin protein availability in these cells (supplemental Figure 1F). In contrast to dynamic pattern of the cohesin complex, Ctcf showed uniformly increased binding across all elements in both differentiated cell types (supplemental Figure 1G-H).
Taken together, these observations imply different and context-specific requirements for cohesin during erythropoiesis and myelopoiesis, with the pattern of expression and binding of cohesin suggesting it as critical for erythroid differentiation.
Global dynamic cohesin binding at active promoters correlates with H3K27 acetylation, but not gene expression, during erythroid differentiation
We next wished to correlate cohesin dosage at chromatin with dynamic histone modifications by ChIP-seq, 3-dimensional (3D) promoter-enhancer interaction by pCHiC and alterations in gene expression by RNA-seq during erythroid differentiation (Figure 2A). Although Rad21 binding was almost globally increased upon erythroid differentiation, the degree was noted to be highly variable across the genome. Based on this observation, we divided all active promoters into 4 notional erythroid “differentiation” tiers. Tier 1 promoters manifested the strongest increase of Rad21 dosage, with this dosage gradually decreasing across the remaining tiers, such that tier 4 promoters demonstrated no increase (Figure 2B-C).
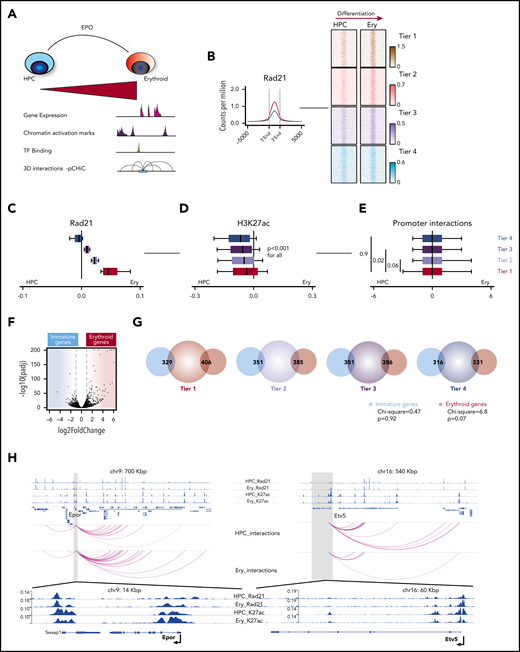
Global dynamic cohesin binding at active promoters correlates with H3K27 acetylation, but not gene expression, during erythroid differentiation. (A) Experimental system to determine the role of cohesin during normal erythroid differentiation. (B) Left: average profile for Rad21 binding at active promoters in the HPC (blue) and erythroid (red) cellular states. Right: representation of the erythroid differentiation tiers; density heat maps of Rad21-binding sites from a representative experiment (of 2) at active promoters that were split into 4 equal tiers, based on the incremental change of Rad21 binding during erythroid differentiation. (C) Box plots and 10th through 90th percentiles of the differences of Rad21 binding in erythroid cells and HPC (Rad21 Ery − Rad21 HPC) in the indicated erythroid differentiation tiers. Shown are means from 2 replicates. Box plots to the left of 0 indicate increased binding in HPC and to the right indicate increased binding in erythroid differentiating cells. (D) Box plots and 10th through 90th percentiles of the differences of H3K27ac binding for the same regions as in panel C. Shown are means from 2 replicates. (E) Box plots and 10th through 90th percentiles of the differences of significant interaction frequencies of the baits located at the promoters of the same regions as in panel C. Interactions were determined with the CHICAGO (Capture HiC Analysis of Genomic Organisation) pipeline. The threshold for significance was set at 5. Shown are results from 2 replicates. (F) Volcano plot showing gene expression changes during HPC to erythroid differentiation (3 biological replicates, Luc1, Luc2, and Luc3, were used per group for consistency with later experiments). The blue shaded area consists of genes enriched in HPC (immature genes), whereas the red shaded area shows genes whose expression significantly increased in the erythroid cell state (erythroid genes). (G) Venn diagrams of overlaps between annotated promoters from the erythroid differentiation tiers (center circle) and differentially expressed genes from panel F (outer circles). χ2 analysis was performed for the trend of overlapping events across all tiers. (H) Examples of Rad21 and H3K27ac binding dynamics (upper), as well as interaction frequencies (lower arcs) between HPC and erythroid cellular states for a representative erythroid gene (Epor) and an immature gene (Etv5).
Global dynamic cohesin binding at active promoters correlates with H3K27 acetylation, but not gene expression, during erythroid differentiation. (A) Experimental system to determine the role of cohesin during normal erythroid differentiation. (B) Left: average profile for Rad21 binding at active promoters in the HPC (blue) and erythroid (red) cellular states. Right: representation of the erythroid differentiation tiers; density heat maps of Rad21-binding sites from a representative experiment (of 2) at active promoters that were split into 4 equal tiers, based on the incremental change of Rad21 binding during erythroid differentiation. (C) Box plots and 10th through 90th percentiles of the differences of Rad21 binding in erythroid cells and HPC (Rad21 Ery − Rad21 HPC) in the indicated erythroid differentiation tiers. Shown are means from 2 replicates. Box plots to the left of 0 indicate increased binding in HPC and to the right indicate increased binding in erythroid differentiating cells. (D) Box plots and 10th through 90th percentiles of the differences of H3K27ac binding for the same regions as in panel C. Shown are means from 2 replicates. (E) Box plots and 10th through 90th percentiles of the differences of significant interaction frequencies of the baits located at the promoters of the same regions as in panel C. Interactions were determined with the CHICAGO (Capture HiC Analysis of Genomic Organisation) pipeline. The threshold for significance was set at 5. Shown are results from 2 replicates. (F) Volcano plot showing gene expression changes during HPC to erythroid differentiation (3 biological replicates, Luc1, Luc2, and Luc3, were used per group for consistency with later experiments). The blue shaded area consists of genes enriched in HPC (immature genes), whereas the red shaded area shows genes whose expression significantly increased in the erythroid cell state (erythroid genes). (G) Venn diagrams of overlaps between annotated promoters from the erythroid differentiation tiers (center circle) and differentially expressed genes from panel F (outer circles). χ2 analysis was performed for the trend of overlapping events across all tiers. (H) Examples of Rad21 and H3K27ac binding dynamics (upper), as well as interaction frequencies (lower arcs) between HPC and erythroid cellular states for a representative erythroid gene (Epor) and an immature gene (Etv5).
We next integrated the dynamics of H3K27ac, pCHiC interactions, and gene expression changes across the 4 tiers. On a global scale, H3K27ac decreased in erythroid cells compared with HPC (Figure 2D). Of note, the degree of H3K27ac alteration significantly correlated with the erythroid differentiation tiers and with Rad21/cohesin binding; the most evident reduction of H3K27 acetylation was present in tier 4 promoters and the change in the modification was preserved greatest in tier 1 promoters (Figure 2D). However, promoter interaction dynamics did not mirror this correlation and demonstrated no coordinated difference between the tiers (Figure 2E). To compare gene expression changes between the HPC and the erythroid cell states, genes whose differential expression increased after EPO stimulation and erythroid differentiation were termed “erythroid” genes, and those whose expression decreased, and were thus higher in HPC, were called “immature” genes (Figure 2F). As expected, erythroid genes were enriched for erythroid differentiation gene sets (supplemental Figure 2A). However, when we overlapped our immature and erythroid genes with the 4 graded tiers of Rad21 binding, we found no significant correlation between Rad21 binding level and alterations in gene expression (Figure 2G).
We next compared dynamic Rad21 and H3K27ac binding, and 3D interaction frequencies at the promoters of erythroid and immature genes. Although Rad21 dosage increased equally at both erythroid and immature gene groups upon differentiation, a relative increase in H3K27ac, and interaction frequency was noted only at erythroid genes (supplemental Figure 2B-C). For example, the Epo-receptor gene (Epor) is upregulated following EPO stimulation, in which activation is associated with increased Rad21 binding, H3K27ac modification and interaction frequency. In contrast, at the Etv5 gene, increased Rad21 binding associates with decreased H3K27ac, interaction frequency, and decreased expression (Figure 2H). Taken together, these studies indicate that binding of cohesin alone is not sufficient to instruct erythroid differentiation but requires additional factors that allow gene transcription.
Etv6 binding precedes cohesin binding at cis-regulatory elements of genes upregulated during erythropoiesis
During hematopoietic differentiation, transcription is coordinated by coactivators such as the p300/Crebbp to deposit H3K27ac at promoters and enhancers.29 These coactivators are classically recruited by hematopoietic- and/or lineage-specific transcription factors.30 We hypothesized that the nonuniform pattern of cohesin binding during normal erythropoietic differentiation is influenced at an earlier hematopoietic stage by specific transcription factors. To identify proteins that might regulate cohesin binding, we performed pull down of endogenous Stag2-containing chromatin complexes, using a technique that enriches for chromatin bound interactions31 (Figure 3A). We initially compared mock knockdown (Luc-HPC) and Stag2 knockdown (shS2-HPC; supplemental Figure 4A) HPC to identify cohesin interacting proteins. Only proteins that were present in all Luc-HPC replicates and displayed significantly decreased presence upon Stag2 knockdown (Figure 3B) were considered as putative interacting proteins. To generate a high confidence dataset of cohesin interacting proteins, we next performed RIME using Rad21 containing chromatin complexes and intersected these with the Stag2 interactors. We could demonstrate a strong overlap between the interacting proteins and further characterized their presumed functions using gene ontology molecular function overrepresentation (Figure 3C). Most cohesin interactors were nucleic acid-binding proteins and could be assigned into different groups, based on their putative function. One of these groups consisted of 5 hematopoietic transcription factors (hTF; Etv6, Erg, Runx1, Tal1, and Stat5) (Figure 3C). We then determined the genome-wide DNA binding patterns of these hTF in unstimulated HPC cells, including their binding at the erythroid differentiation tiers (Figure 3D). Of the 5 hTF, only Etv6 displayed globally enhanced cobinding at the cohesin-associated promoters. Strikingly, Etv6 binding was highest at promoters from tier 1 loci and decreased through the remaining tiers, a pattern directly proportional to cohesin binding during erythroid differentiation. Given that Etv6 is predominantly a transcriptional repressor that has been previously associated with maintaining HSC function and megakaryopoiesis,32 we next assessed the dynamic expression patterns of Etv6 during differentiation using published scRNASeq data33 (supplemental Figure 3). In diametric contrast to cohesin dynamics, Etv6 was most highly expressed in HSPC and strongly decreased during erythroid differentiation. Finally, we confirmed the interaction between Etv6 and cohesin by performing coimmunoprecipitation of Rad21 or Stag2 and western blots for Etv6 (Figure 3E). Taken together, we functionally link Etv6 with cohesin and indirectly suggest that a release of transcriptional repression by Etv6 may be required for proper erythroid differentiation.
![Etv6 binding precedes cohesin binding at cis-regulatory elements of genes upregulated during erythropoiesis. (A) Schematic of methodology to identify cohesin complex interacting proteins at chromatin. (B) Volcano plot showing differences in pull down of Stag2 between Luc1_HPC (4 experimental replicates) and shS2_1_HPC (4 experimental replicates). The brown colored dots show significantly associated proteins (padj < 0.1, log2FC 0.33). (C) Upper: Venn diagram displaying validation of significant Stag2-associated proteins from panel B after RIME pull down with Rad21 (4 technical replicates, Luc1_HPC). Lower right: putative cohesin-interacting proteins that bind together at chromatin; lower left: top 5 enrichments of gene ontology (GO) molecular functions of the final full list of cohesin interactors (scale is −log10 [q value]). (D) Average profiles demonstrating the enrichment of the specified prebound hTF at the erythroid differentiation tiers in unstimulated HPC. (E) Coimmunoprecipitation experiments confirm interaction of Etv6 with Stag2 and Rad21.](https://ash.silverchair-cdn.com/ash/content_public/journal/blood/134/24/10.1182_blood.2019001553/4/m_bloodbld2019001553f3.png?Expires=1769084597&Signature=LJ65f-xr9FgG~gSrcv2hS9zUZvHfDfofdIYV7S7HJWT7dW06Iu5EUTg4FV58Z80zi4396WS9v2rGVmpIA5u4poFS6WFnW2kJaiMFQfqbj2z-SQLkOmPZiLqavFoom8POh0mxnc-yOxOrJwPKOl8gdtbWdXbsSEzh12Qn7faWuP~Lg7CQ74w8glhW7CGYIJvd1LxZwPomgh8AP59NmDWTVOYXzuVjI9jEes3M3ER70tSZxr1wMNnaUCvQnb2ky4DK1U~L2WzIv2p4vWZN6TZSLuVHJOMtNRP-4Gywpnjyso9lgoXfo-XAGxAT6gEQDJIkWs2cqb4BUeZVPuSshZ60xQ__&Key-Pair-Id=APKAIE5G5CRDK6RD3PGA)
Etv6 binding precedes cohesin binding at cis-regulatory elements of genes upregulated during erythropoiesis. (A) Schematic of methodology to identify cohesin complex interacting proteins at chromatin. (B) Volcano plot showing differences in pull down of Stag2 between Luc1_HPC (4 experimental replicates) and shS2_1_HPC (4 experimental replicates). The brown colored dots show significantly associated proteins (padj < 0.1, log2FC 0.33). (C) Upper: Venn diagram displaying validation of significant Stag2-associated proteins from panel B after RIME pull down with Rad21 (4 technical replicates, Luc1_HPC). Lower right: putative cohesin-interacting proteins that bind together at chromatin; lower left: top 5 enrichments of gene ontology (GO) molecular functions of the final full list of cohesin interactors (scale is −log10 [q value]). (D) Average profiles demonstrating the enrichment of the specified prebound hTF at the erythroid differentiation tiers in unstimulated HPC. (E) Coimmunoprecipitation experiments confirm interaction of Etv6 with Stag2 and Rad21.
Etv6 binding precedes cohesin binding at cis-regulatory elements of genes upregulated during erythropoiesis. (A) Schematic of methodology to identify cohesin complex interacting proteins at chromatin. (B) Volcano plot showing differences in pull down of Stag2 between Luc1_HPC (4 experimental replicates) and shS2_1_HPC (4 experimental replicates). The brown colored dots show significantly associated proteins (padj < 0.1, log2FC 0.33). (C) Upper: Venn diagram displaying validation of significant Stag2-associated proteins from panel B after RIME pull down with Rad21 (4 technical replicates, Luc1_HPC). Lower right: putative cohesin-interacting proteins that bind together at chromatin; lower left: top 5 enrichments of gene ontology (GO) molecular functions of the final full list of cohesin interactors (scale is −log10 [q value]). (D) Average profiles demonstrating the enrichment of the specified prebound hTF at the erythroid differentiation tiers in unstimulated HPC. (E) Coimmunoprecipitation experiments confirm interaction of Etv6 with Stag2 and Rad21.
Cohesin deficiency severely impairs erythroid differentiation and expands myelopoiesis, but only modestly alters HSPC homeostasis
The differential landscape of cohesin binding between HPC and erythroid cell states predicts that cohesin is critical for the dynamic remodeling of transcription during erythropoiesis. To test this, we perturbed the function of cohesin members in HPC (Figure 4A) using inducible knockdown of Stag2 (shS2_HPC), Rad21 (shR21_HPC), or Smc1a (shS1a_HPC) (supplemental Figure 4A-B). No significant differences in the binding of cohesin proteins or Ctcf were detected upon cohesin subunit knockdown in HPC (Figure 4B; supplemental Figure 4C). Additionally, RNA-seq revealed only minor changes in gene expression in cohesin deficient HPC (Figures 4C; supplemental Figure 4D). However, these changes consistently decreased signatures of differentiation and, for shR21_HPC and shS1a_HPC, enriched for stem cell signatures (supplemental Figure 4E) in gene set enrichment analysis (GSEA) analyses.

Cohesin deficiency severely impairs erythroid differentiation but only modestly alters HSPC homeostasis. (A) Experimental design to determine cohesin dynamics following perturbation of Stag2. (B) Average profiles of Rad21 binding at active promoters and active enhancers in Luc_HPC and shS2_HPC cells. To minimize global quantitative biases, the Rad21 signal was CPM normalized and internally calibrated to its signal at the insulator/other sites (see “Methods and materials”). Shown are means of 2 replicates, whereas each short hairpin RNA was considered an independent replicate (Luc1_HPC, Luc2_HPC, shS2_1 HPC, shS2_2_HPC). (C) Differential gene expression between Luc_HPC and shS2 HPC cells (3 biological replicates representing different knock-down clones per group: Luc1_HPC, Luc2_HPC, Luc3_HPC, shS2_1_HPC, shS2_2_HPC, shS2_3_HPC) demonstrates minimal gene expression changes. The blue shaded area consists of genes enriched in HPC, whereas the brown shaded area shows genes significantly expressed in shS2_HPC cells. The numbers at the upper corners show the counts of log2FC > 0.5, padj < 0.1, and (log2FC > 1, padj < 0.05) significant differential genes. For comparison, the significance and difference spreads were set intentionally to match those in panel F. (D) Representative flow cytometric analysis of erythroid differentiation following EPO for Luc_Ery and shS2_Ery at the indicated times. (E) Variance by principal component analysis of the shCohesin_HPC, Luc_HPC, shS2_ery, and Luc_ery RNAseq datasets. Each dot represents a different short hairpin RNA (Luc1-3_HPC, shS2_1-3_HPC, shR21_1-3_HPC, shSmc1a_1-2_HPC, Luc1-2_ery, shS2_1-2_ery). (F) Differential gene expression between Luc_ery and shS2_ery cells (2 biological replicates for each group: Luc1_ery, Luc2_ery, shS2_1_ery, shS2_2_ery). The numbers at the upper corners show the counts of log2FC > 0.5, padj < 0.1, and (log2FC > 1, padj < 0.05) significantly differentially expressed genes. (G) NES for significant (FDR > 0.05 datasets) hematopoiesis-related datasets as determined by GSEA. Input was a ranked list of all pajd < 0.1 genes from panel F. (H) Venn diagrams of gene expression changes displaying overlaps between erythroid or immature genes from Figure 2F and Luc_ery or shS2_ery genes from Figure 4F. CPM, counts per million; FDR, false discovery rate; NES, normalized enrichment score.
Cohesin deficiency severely impairs erythroid differentiation but only modestly alters HSPC homeostasis. (A) Experimental design to determine cohesin dynamics following perturbation of Stag2. (B) Average profiles of Rad21 binding at active promoters and active enhancers in Luc_HPC and shS2_HPC cells. To minimize global quantitative biases, the Rad21 signal was CPM normalized and internally calibrated to its signal at the insulator/other sites (see “Methods and materials”). Shown are means of 2 replicates, whereas each short hairpin RNA was considered an independent replicate (Luc1_HPC, Luc2_HPC, shS2_1 HPC, shS2_2_HPC). (C) Differential gene expression between Luc_HPC and shS2 HPC cells (3 biological replicates representing different knock-down clones per group: Luc1_HPC, Luc2_HPC, Luc3_HPC, shS2_1_HPC, shS2_2_HPC, shS2_3_HPC) demonstrates minimal gene expression changes. The blue shaded area consists of genes enriched in HPC, whereas the brown shaded area shows genes significantly expressed in shS2_HPC cells. The numbers at the upper corners show the counts of log2FC > 0.5, padj < 0.1, and (log2FC > 1, padj < 0.05) significant differential genes. For comparison, the significance and difference spreads were set intentionally to match those in panel F. (D) Representative flow cytometric analysis of erythroid differentiation following EPO for Luc_Ery and shS2_Ery at the indicated times. (E) Variance by principal component analysis of the shCohesin_HPC, Luc_HPC, shS2_ery, and Luc_ery RNAseq datasets. Each dot represents a different short hairpin RNA (Luc1-3_HPC, shS2_1-3_HPC, shR21_1-3_HPC, shSmc1a_1-2_HPC, Luc1-2_ery, shS2_1-2_ery). (F) Differential gene expression between Luc_ery and shS2_ery cells (2 biological replicates for each group: Luc1_ery, Luc2_ery, shS2_1_ery, shS2_2_ery). The numbers at the upper corners show the counts of log2FC > 0.5, padj < 0.1, and (log2FC > 1, padj < 0.05) significantly differentially expressed genes. (G) NES for significant (FDR > 0.05 datasets) hematopoiesis-related datasets as determined by GSEA. Input was a ranked list of all pajd < 0.1 genes from panel F. (H) Venn diagrams of gene expression changes displaying overlaps between erythroid or immature genes from Figure 2F and Luc_ery or shS2_ery genes from Figure 4F. CPM, counts per million; FDR, false discovery rate; NES, normalized enrichment score.
In stark contrast, when we determined the role of cohesin during erythroid differentiation, following knockdown, it was significantly impaired after Rad21, Smc1a, and mostly after Stag2 downregulation (Figure 4D; supplemental Figure 4F). This was also demonstrated at the level of global gene expression changes using principal component analysis of RNA-seq. Here, a decreased variance in shS2_ery cells in the first component, which coincides with erythroid differentiation (supplemental Table 3), and marked differences in gene expression between Luc_ery and shS2_ery cells, were demonstrated (Figure 4E-F). GSEA further highlighted an increase of stem cell signatures and lost erythroid and general differentiation signatures following knockdown of Stag2 (Figure 4G). Of note, Luc_ery genes (genes with significantly higher expression in control cells in comparison with Stag2 knockdown cells following EPO induction) strongly overlapped (196/288 genes, 68%) with the genes upregulated during normal erythroid differentiation (Figure 4H). In line with previous studies,17-19 IL-3–driven myelopoiesis was significantly expanded in Stag2 and Rad21-perturbed cells (supplemental Figure 4G-H).
These data demonstrate that the effects of cohesin member perturbation are context dependent, and are in consonance with our description of the increased requirement for cohesin function during erythroid differentiation. They also demonstrate that cohesin appears to be critical for the expression of dynamic genes during erythroid differentiation, rather than the continued expression of steady-state genes required for the maintenance and homeostasis of the self-renewing HSPC state.
Impaired erythroid differentiation directly relates to decreased cohesin binding at erythroid-specific genes
We next tested if the impairment of erythroid differentiation associated with limiting concentrations of cohesin members relates to a failure of dynamic binding of the intact cohesin at the required cis-regulatory elements that we have previously defined during normal erythroid differentiation. We performed ChIP-seq for Rad21 in control (Luc_ery) and cohesin perturbed (shS2_ery) cells and compared signal intensities at active enhancers and promoters and specifically across the erythroid differentiation tiers described in Figure 2B-C. The global dosage of Rad21 was only mildly, albeit significantly, decreased at the active promoters and enhancers following knockdown of Stag2 (Figure 5A). However, across the erythroid differentiation tiers, impairment of Rad21 binding was most evident at tier 1 with a graded decline in differential binding across the remaining tiers (Figure 5B). The levels of the H3K27ac modification also positively correlated with this graded alteration of Rad21 binding (Figure 5C). Nevertheless, not all tier 1 promoters displayed an impaired binding of Rad21 in shS2_ery cells (supplemental Figure 5A), which prompted us to further define active promoters with significant differential binding of Rad21 following Stag2 knockdown. We identified 782 promoters where Rad21 dosage was significantly impaired in shS2_ery cells (“lost” promoters) and 80 promoters with a significant increase of Rad21 signal (“gained” promoters) (Figure 5D). We next integrated Rad21 and H3K27ac ChIP-seq signal intensities with pCHiC interactions and differential gene expression at these “lost” and “gained” promoters and could demonstrate that loci where Rad21 binding decreased were associated with decreased H3K27ac, impaired interactions, and a reduction in gene expression (Figures 5E-G). Importantly, marked decreases in cohesin binding were observed at crucial erythropoietic master regulators, including Klf1 and Gata1, thus providing a further explanation for the impaired erythropoietic gene expression program (Figure 5F). Moreover, the “lost” promoters were consistently enriched for erythropoiesis and differentiation (supplemental Figure 5B-C), thus further linking dynamic cohesin binding requirements to Erythroid and general differentiation genes.
![Impaired erythroid differentiation directly relates to decreased cohesin complex binding at erythroid-specific genes. (A) Rad21 binding at active promoters or active enhancers in Luc_ery (red) and shS2_ery cells (black). To minimize global quantitative biases, the Rad21 signal was CPM normalized and internally calibrated to its signal at the insulator/other sites. Shown are means of 2 replicates (Luc1_ery, Luc2_ery, shS2_1_ery, shS2_2_ery). (B) Differential Rad21 binding in Luc_ery and shS2_ery cells at the indicated erythroid differentiation tiers from Figure 2B. Box plots to the left of 0 indicate increased binding following Stag2 knockdown and to the right indicate increased binding in control knockdown cells that follow normal erythroid differentiation. Shown are means of 2 replicates as described in panel A. (C) Differential H3K27ac binding as in Figure 2B. Shown are means of 2 replicates as described in panel A. (D) Differential Rad21 binding at active promoters between Luc_ery (red) and shS2_ery cells (blue). Shown are means of 2 replicates as described in panel A. (E) H3K27ac binding at the sites from panel D. Shown are means of 2 replicates as described in panel A. (F) Gene expression differences between Luc_ery and shS2-ery cellular states at the indicated sites from panel D. Genes that were enriched in Luc_ery were marked with negative values (shades of red), whereas genes that were enriched in shS2_ery were marked with positive values (shades of blue). Selected genes of interest are noted. (G) Interaction frequencies at the indicated sites from Fig 5D (at gained promoters [blue]; at lost promoters [red]) are shown as the difference of normalized significant interactions between shS2-Ery and Luc-Ery conditions. Shown are means of 2 replicates as described in panel A. (H) Example of Rad21 and H3K27ac binding dynamics, as well as interaction frequency between Luc_ery and shS2_ery at the Klf1 promoter (RNAseq log2foldChange −1.8). NE, not expressed.](https://ash.silverchair-cdn.com/ash/content_public/journal/blood/134/24/10.1182_blood.2019001553/4/m_bloodbld2019001553f5.png?Expires=1769084597&Signature=ywzhFK~-yamLWQiICcsGGSQyeUTly4Nk-PDKkh7Dn0Y-tsefOw-h7jhn-zjxniNq0djkdZTzEXmM64bIU5Qcw~9n~p-~tufGnX3GBpJASvbHWAt9uO2MbELIcjVAWkrH1tTo5yeqbjMK3EbDYfSBcFycW0V73UivtNtJCBXIRRPCiZwp1vqvzkwVE3YEHdzRyP5eXYNFu8LltRvWctraYq9pUZLmCZeAUK37PA8QoKW0kgiXMm3v8XHQQMCLqDBUvVbIz6msqexsYelOMs7YLZRBYPOhetEuSH06aUV-LerMmDWv2BeWjH6XsmyqYb1rBxho-f96HquZcCFFKGfSFw__&Key-Pair-Id=APKAIE5G5CRDK6RD3PGA)
Impaired erythroid differentiation directly relates to decreased cohesin complex binding at erythroid-specific genes. (A) Rad21 binding at active promoters or active enhancers in Luc_ery (red) and shS2_ery cells (black). To minimize global quantitative biases, the Rad21 signal was CPM normalized and internally calibrated to its signal at the insulator/other sites. Shown are means of 2 replicates (Luc1_ery, Luc2_ery, shS2_1_ery, shS2_2_ery). (B) Differential Rad21 binding in Luc_ery and shS2_ery cells at the indicated erythroid differentiation tiers from Figure 2B. Box plots to the left of 0 indicate increased binding following Stag2 knockdown and to the right indicate increased binding in control knockdown cells that follow normal erythroid differentiation. Shown are means of 2 replicates as described in panel A. (C) Differential H3K27ac binding as in Figure 2B. Shown are means of 2 replicates as described in panel A. (D) Differential Rad21 binding at active promoters between Luc_ery (red) and shS2_ery cells (blue). Shown are means of 2 replicates as described in panel A. (E) H3K27ac binding at the sites from panel D. Shown are means of 2 replicates as described in panel A. (F) Gene expression differences between Luc_ery and shS2-ery cellular states at the indicated sites from panel D. Genes that were enriched in Luc_ery were marked with negative values (shades of red), whereas genes that were enriched in shS2_ery were marked with positive values (shades of blue). Selected genes of interest are noted. (G) Interaction frequencies at the indicated sites from Fig 5D (at gained promoters [blue]; at lost promoters [red]) are shown as the difference of normalized significant interactions between shS2-Ery and Luc-Ery conditions. Shown are means of 2 replicates as described in panel A. (H) Example of Rad21 and H3K27ac binding dynamics, as well as interaction frequency between Luc_ery and shS2_ery at the Klf1 promoter (RNAseq log2foldChange −1.8). NE, not expressed.
Impaired erythroid differentiation directly relates to decreased cohesin complex binding at erythroid-specific genes. (A) Rad21 binding at active promoters or active enhancers in Luc_ery (red) and shS2_ery cells (black). To minimize global quantitative biases, the Rad21 signal was CPM normalized and internally calibrated to its signal at the insulator/other sites. Shown are means of 2 replicates (Luc1_ery, Luc2_ery, shS2_1_ery, shS2_2_ery). (B) Differential Rad21 binding in Luc_ery and shS2_ery cells at the indicated erythroid differentiation tiers from Figure 2B. Box plots to the left of 0 indicate increased binding following Stag2 knockdown and to the right indicate increased binding in control knockdown cells that follow normal erythroid differentiation. Shown are means of 2 replicates as described in panel A. (C) Differential H3K27ac binding as in Figure 2B. Shown are means of 2 replicates as described in panel A. (D) Differential Rad21 binding at active promoters between Luc_ery (red) and shS2_ery cells (blue). Shown are means of 2 replicates as described in panel A. (E) H3K27ac binding at the sites from panel D. Shown are means of 2 replicates as described in panel A. (F) Gene expression differences between Luc_ery and shS2-ery cellular states at the indicated sites from panel D. Genes that were enriched in Luc_ery were marked with negative values (shades of red), whereas genes that were enriched in shS2_ery were marked with positive values (shades of blue). Selected genes of interest are noted. (G) Interaction frequencies at the indicated sites from Fig 5D (at gained promoters [blue]; at lost promoters [red]) are shown as the difference of normalized significant interactions between shS2-Ery and Luc-Ery conditions. Shown are means of 2 replicates as described in panel A. (H) Example of Rad21 and H3K27ac binding dynamics, as well as interaction frequency between Luc_ery and shS2_ery at the Klf1 promoter (RNAseq log2foldChange −1.8). NE, not expressed.
These findings suggest that the impaired erythroid differentiation of Stag2-perturbed HPC following EPO stimulation relates to decreased cohesin binding at the promoters of a critical subset of erythroid genes. To corroborate this suggestion, we demonstrated a significantly positive correlation between Rad21 binding and gene expression, H3K27ac, and interaction frequency at the corresponding promoters of differentially expressed genes (supplemental Figure 5D-F). Examples of critical erythroid genes, Klf1 and Gata1, whose expression is enriched in Luc-ery control cells, are shown in Figure 5H and supplemental Figure 5G.
Taken together, these data demonstrate that limiting concentrations of functional cohesin, as occurs in cohesin-mutated myeloid malignancies, impair the normal binding patterns of the complex at active promoters/enhancers of critical genes during erythroid differentiation. This leads to a correlative decrease in H3K27 acetylation, interaction between promoters and distal cis-regulatory elements, and reduced gene expression. Notably, the impairment of cohesin binding is not uniform and is marked at critical regulators of erythropoiesis, explaining the impaired erythroid differentiation observed in cohesin-mutated myeloid malignancies.
Stag2 perturbation leads to preferential loss of cohesin binding at differentiation promoters with strong Etv6 pre-binding
As we have demonstrated, the dynamic pattern of cohesin binding during erythropoiesis appears primed by Etv6. We therefore wondered whether Etv6 binding would also premark those promoters that lose cohesin following Stag2 knockdown.
To test this hypothesis, we initially stratified the global alterations in Rad21 binding at active promoters following Stag2 knockdown; we identified 4 erythroid perturbation tiers (tiers A-D), based on the differences of Rad21 binding between shS2_ery and Luc_ery (Figure 6A). As anticipated, there was a degree of overlap between the differentiation and perturbation tiers (supplemental Figure 6A). Of note, we observed strong impairment of Rad21 binding at tier A, intermediate dynamics at tier B and tier C, and a redistribution/sequestration of Rad21 at the tier D promoters in the shS2_ery cells (Figure 6A). We could again demonstrate significant correlation of Rad21 binding with dynamic H3K27 acetylation and promoter interaction frequencies at these tiers (Figure 6A-C). Moreover, promoters from tier D significantly overlapped with genes upregulated following Stag2 knockdown (shS2_ery genes), whereas promoters from tier A significantly overlapped with genes whose expression was higher in control cells following Stag2 knockdown (Luc_ery genes) (Figure 6A,D).
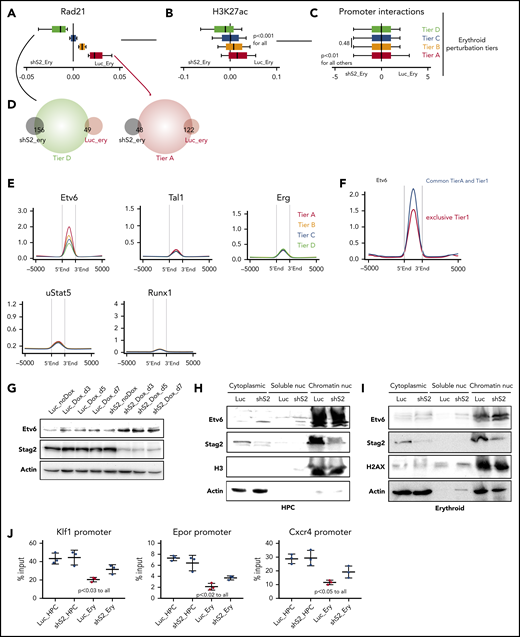
Stag2 perturbation leads to preferential loss of cohesin binding at differentiation promoters with strong Etv6 prebinding. (A) Representation of the erythroid perturbation tiers; differences of Rad21 binding in Luc-Ery and shS2-Ery cells (Rad21-Ery − shS2-Ery) in the indicated erythroid perturbation tiers. Box plots to the left of 0 indicate increased binding following Stag2 knockdown and to the right indicate increased binding in control knockdown cells with normal erythroid differentiation. (B) Differential H3K27ac binding as in panel A. (C) Differential significant interaction frequencies at the promoters of the same regions as in panel A. (D) Overlaps between annotated promoters from the indicated perturbation tiers and differentially expressed genes from Figure 4F. (E) Enrichment of the specified hTF at the perturbation tiers in wild-type HPC. (F) Enrichment of Etv6 at the indicated regions. (G) Immunoblotting for total protein expression of Etv6, Stag2, and actin in the indicated conditions. (H) Immunoblotting for protein expression of Etv6, Stag2 H3, and actin in different cellular fractions in the indicated conditions. (I) Immunoblotting for protein expression of Etv6, Stag2 H2AX, and actin in different cellular fractions in the indicated conditions. (J) ChIP-qPCR of Etv6 binding at Klf1, Epor, and Cxcr4 promoter regions in the indicated cellular states. Shown are results from 3 experimental replicates.
Stag2 perturbation leads to preferential loss of cohesin binding at differentiation promoters with strong Etv6 prebinding. (A) Representation of the erythroid perturbation tiers; differences of Rad21 binding in Luc-Ery and shS2-Ery cells (Rad21-Ery − shS2-Ery) in the indicated erythroid perturbation tiers. Box plots to the left of 0 indicate increased binding following Stag2 knockdown and to the right indicate increased binding in control knockdown cells with normal erythroid differentiation. (B) Differential H3K27ac binding as in panel A. (C) Differential significant interaction frequencies at the promoters of the same regions as in panel A. (D) Overlaps between annotated promoters from the indicated perturbation tiers and differentially expressed genes from Figure 4F. (E) Enrichment of the specified hTF at the perturbation tiers in wild-type HPC. (F) Enrichment of Etv6 at the indicated regions. (G) Immunoblotting for total protein expression of Etv6, Stag2, and actin in the indicated conditions. (H) Immunoblotting for protein expression of Etv6, Stag2 H3, and actin in different cellular fractions in the indicated conditions. (I) Immunoblotting for protein expression of Etv6, Stag2 H2AX, and actin in different cellular fractions in the indicated conditions. (J) ChIP-qPCR of Etv6 binding at Klf1, Epor, and Cxcr4 promoter regions in the indicated cellular states. Shown are results from 3 experimental replicates.
We then determined the DNA binding patterns of the 5 previously identified cohesin cointeracting hTF at the erythroid perturbation tiers (Figure 6E). Again, Etv6 binding was highest at promoters from tier A loci and decreased through the remaining tiers, implying that Etv6 might contribute to altered erythropoiesis following Stag2 knockdown. Moreover, Etv6 binding was even more significantly enriched at differentiation genes that were also impaired after Stag2 knockdown (common peaks between perturbation tier A and erythroid tier 1), compared with all tier1 genes (Figure 6F).
Upon erythroid differentiation in our HPC system, as in primary cells, we could demonstrate a decrease in Etv6 expression, following EPO stimulation (data not shown). We therefore wondered if Etv6 protein abundance and binding to chromatin might persist following EPO stimulation of shS2 cells. Of note, we noticed a modest and relative increase of Etv6 at the protein level when comparing Stag2 knockdown to unstimulated control HPC cells (Figure 6G). However, this did not correlate with an increase in Etv6 transcription because Luc and shS2 HPC cells displayed similar Etv6 messenger RNA levels (supplemental Figure 6B). Looking at protein abundance in greater detail within individual cellular compartments in unstimulated cells, we could detect an increase in Etv6 in the cytoplasm and nucleoplasm, whereas the chromatin fraction remained equally saturated (Figure 6H). In contrast, during erythroid differentiation, Etv6 specifically displayed increased chromatin binding in shS2 cells, demonstrating that Etv6 remains active at chromatin following cohesin loss (Figure 6I). Finally, we investigated the Etv6 binding dynamics by ChIP-qPCR at specifically impaired gene promoters. We chose the promoter regions of Klf1, Epor, and Cxcr4 because these were common among the tier 1 and tier A loci and significantly lost Rad21 binding during Stag2-perturbed erythroid differentiation. No difference in Etv6 binding was observed between Luc_HPC and shS2_HPC cells (Figure 6J). By contrast, Etv6 binding significantly decreased during normal erythroid differentiation; however, in agreement with its higher availability in shS2_Ery cells, Etv6 binding intensity remained significantly higher in shS2_Ery cells compared with Luc_Ery cells (Figure 6J).
These data suggest that cohesin evicts Etv6 from chromatin, relieving its repressive function, and that deficiency allows for the continued chromatin binding and repressive activity of Etv6 at genes critical for erythroid differentiation. To test this hypothesis, we sought to determine if we could rescue erythroid differentiation in cohesin-perturbed HPC by concomitantly knocking down Etv6. However, Etv6 is a critical regulator of hematopoiesis and its loss leads to impairment of HSC function and blood development.32 In keeping with this critical function, both single knockdown of Etv6 (Luc-shEtv6-HPC) and double knockdown of Stag2 and Etv6 (shS2-shEtv6-HPC) led to a marked reduction in cellular proliferation, preventing us from testing this hypothesis (supplemental Figure 6C-D).
Erythropoiesis is impaired in human cohesin-mutated MDS and AML
Cohesin mutations are common events in myeloid neoplasia. Among cohesin genes, mutations of STAG2 are most frequent.13,15,34 To determine if our model of impaired erythropoiesis correlates with human disease, we analyzed differential gene expression and matched mutational analysis in a dataset consisting of CD34+ bone marrow cells from 159 MDS patient samples and 17 healthy donors.35 We initially analyzed all significant differential transcripts that occurred between 8 STAG2-mutated and 151 other MDS samples, noting a total count of 2778 genes that were differentially expressed (q < .05). Consistent with our cohesin knockdown datasets, the hemoglobin genes and the essential erythroid regulator KLF1 were some of the most highly downregulated genes in STAG2-mutated samples (Figure 7A). GSEA further highlighted that stem cell signatures were upregulated and erythroid and general differentiation signatures down regulated in STAG2-mutated samples (Figure 7B), in consonance with our murine cellular model of altered cohesin function. Indeed, the majority of the human orthologs of the genes differentially expressed during erythroid commitment following Stag2 knock down also showed decreased gene expression in STAG2-mutated MDS samples (supplemental Figure 7A), further corroborating the relevance of our model to human disease. Extending our analysis to cohesin-mutated AML, we repeated this analysis in The Cancer Genome Atlas (TCGA) LAML dataset,36 comparing expression changes from 18 cohesin-mutated patient samples with 133 AML samples from patients who lacked a cohesin mutation. Again, there was a marked overlap between the genes downregulated in cohesin-mutated AML and our experimental dataset (supplemental Figure 7B).
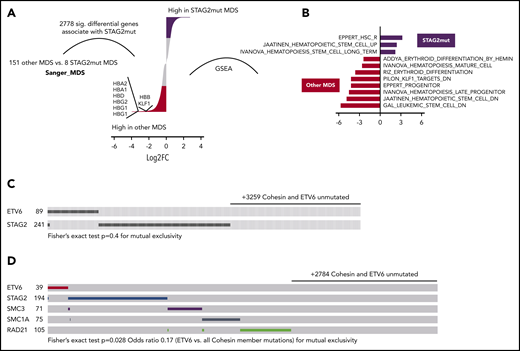
Erythropoiesis is impaired in human cohesin-mutated myelodysplastic syndromes and acute myeloid leukemia. (A) Differential gene expression in STAG2 mutated MDS vs all other MDS subtypes. Only events with FDR q < 0.1 are shown. The red (enriched in other MDS) and black (enriched in shSTAG2mut MDS) segments specify for log2FC > 0.5 differential genes. Genes of interest are shown. (B) NES for significant hematopoiesis-related datasets (FDR < 0.05) as determined by GSEA. Input was a ranked list of all genes from panel A. STAG2 mutant-enriched gene sets are to the right of 0 and other MDS subtype gene sets to the left. Common and exclusive mutations of the indicated genes among 3612 myeloid neoplasia curated by the (C) Cosmic database and 3256 AML samples from the (D) UK National Cancer Research Institute AML trials (2434 samples), BEAT-AML (622), and TCGA LAML (200) datasets.
Erythropoiesis is impaired in human cohesin-mutated myelodysplastic syndromes and acute myeloid leukemia. (A) Differential gene expression in STAG2 mutated MDS vs all other MDS subtypes. Only events with FDR q < 0.1 are shown. The red (enriched in other MDS) and black (enriched in shSTAG2mut MDS) segments specify for log2FC > 0.5 differential genes. Genes of interest are shown. (B) NES for significant hematopoiesis-related datasets (FDR < 0.05) as determined by GSEA. Input was a ranked list of all genes from panel A. STAG2 mutant-enriched gene sets are to the right of 0 and other MDS subtype gene sets to the left. Common and exclusive mutations of the indicated genes among 3612 myeloid neoplasia curated by the (C) Cosmic database and 3256 AML samples from the (D) UK National Cancer Research Institute AML trials (2434 samples), BEAT-AML (622), and TCGA LAML (200) datasets.
Mutual exclusivity of ETV6 and Cohesin mutations in myeloid malignancies supports their functional interaction
ETV6 and cohesin members are commonly mutated in MDS and AML. To further interrogate the functional interaction between ETV6 and cohesin, we examined the pattern of mutations in individual patients from large cohorts of patients with myeloid malignancies. Analyzing mutations in a total of 3612 patient samples with myeloid malignancies from the Cosmic database37 in which all STAG2 and ETV6 coding regions were sequenced, we observed that only 4 of 338 samples displayed mutations in both ETV6 and STAG2, suggesting a strong tendency toward mutual exclusivity of mutations in these genes (Figure 7C). However, perhaps related to the small number of ETV6 mutations, the heterogeneity of the myeloid diseases or the lack of full cohesin member coverage, we were relatively underpowered to demonstrate this statistically and mutual exclusivity was not significant by Fisher’s exact test (P = .4).
To further validate these results and underscore the significance of our mechanistic model, we examined cumulative results from an unpublished cohort of 2434 AML samples from the UK National Cancer Research Institute AML trials (Medical Research Council), 200 AML samples from the TCGA consortium,36 and 622 AML samples from the Oregon Health & Science University,38 in which all cohesin members and ETV6 genes were analyzed for mutations. Among a total of 472 samples, only 1 was comutated for a cohesin member and ETV6, a comparable frequency to the degree of mutual exclusivity between individual members of cohesin (P = .028, Figure 7D). Of note, full mutual exclusivity between ETV6 (22 samples) and cohesin members STAG2/RAD21 was also evident in another large AML dataset.16 These results further corroborate our experimental data and strongly support a functional interaction between ETV6 and cohesin, such that in the absence of physiological levels of cohesin, intact ETV6 function is required to repress genes critical for erythroid differentiation.
Discussion
Multiple studies17-19,21 and the high incidence of mutations of cohesin members in myeloid malignancies13,15,16 have demonstrated that reduced cohesin dosage perturbs hematopoiesis. However, the mechanisms whereby cohesin maintains hematopoietic homeostasis remain obscure. We now present a model that highlights the requirement for cohesin during the dynamic induction of erythroid differentiation. We link this requirement to the acetylation of proximal and distal cis-regulatory elements, to increased interaction between these and to the expression of important differentiation genes. Critically, these changes are not uniform across the genome but appear coordinated by the prior binding of specific, interacting hTF, such as Etv6. Moreover, we demonstrate the abrogation of dynamic induction of these differentiation processes and genes when cohesin members are depleted. Finally, we provide evidence of a functional interaction between ETV6 and cohesin and corroborate its relevance for human disease, correlating our experimental findings with large datasets from patients with MDS and AML.
Our model system was chosen to allow temporal and lineage control over differentiation and, with it, the interrogation of specific cellular states rather than heterogeneous populations of cells along a differentiation continuum. To overcome the limitations of a purely in vitro system, we corroborated our findings at all times to more physiological systems, all the way from the expression of the cohesin members in murine and human stem and progenitor cells undergoing differentiation, through similarities of our altered gene expression patterns to murine self-renewal signatures, all the way to the physiological correlation of our data with the genotype-specific disease mutational and gene expression signatures in MDS and AML databases. Similarities are seen with phenotypes previously described in murine and human hematopoietic cells following cohesin depletion or expression of mutated forms,17-19,22 where decreased erythroid differentiation of human or murine hematopoietic stem and progenitor cells have been demonstrated in vitro,17 and decreased bone marrow MEP and Ter119+ cells in vivo,18 although this same study actually showed an increase of extramedullary erythroid cells in the spleen. Moreover, our identification of the hTF that interact with cohesin on chromatin may also explain, at least in part, the alterations in chromatin accessibility demonstrated upon cohesin depletion in these studies. Of note, increased accessibility at chromatin regions enriched for Erg, Gata2, Runx1, and Stat5 binding sites were documented, demonstrating an almost complete overlap with the hTF that we detected to interact with cohesin at chromatin.
We find that cohesin member perturbation has little direct influence on the maintenance of existing transcriptional programs necessary for HSPC homeostasis. This reconciles with previous studies in which only the rapid and complete removal of cohesin from chromatin affects the 3D maintenance of chromatin39 and would also explain why malignant cells can tolerate partial loss of cohesin while still maintaining proliferation. Our findings of the requirement for cohesin function to induce gene expression during the dynamic process of differentiation are in line with a recent study,40 where so-called inducible enhancers were dependent on cohesin binding to activate gene expression from their target promoters during the dynamic process of macrophage activation following inflammatory signaling. However, our data expand on this observation, mechanistically highlighting that the induction of dynamic processes, such as differentiation, by cohesin-mediated gene expression programs is neither random nor uniform, but highly specific and appears regulated by prebound hTF. We speculate that, within HSPC, critical erythroid genes are repressed by Etv6. However, during normal erythroid differentiation, cohesin is recruited to these critical promoters. This coincides with the loss of Etv6 binding, deposition of the activating H3K27ac, increased contact between these promoters, and distal cis-regulatory enhancers and expression of critical erythroid genes. Moreover, during normal differentiation Etv6 is downregulated at the transcriptional level to further augment this switch. However, under cohesin insufficiency (eg, in cohesin-mutated myeloid neoplasia), there is no increase in cohesin binding and Etv6 remains bound at chromatin, resulting in continued repression of critical erythroid genes and a failure to differentiate properly. Moreover, this model is entirely consistent with the erythroid differentiation defect evident within patients with cohesin-mutated myeloid neoplasia and is supported by the near mutual exclusivity of ETV6 and cohesin member mutations in myeloid malignancies.
In summary, our data shed considerable light on the function of cohesin during cellular processes that require dynamic gene regulation, such as erythroid differentiation. Further investigation is warranted to demonstrate whether cohesin is required for other dynamic cellular processes. We propose a mechanism for cohesin-coordinated alterations in critical gene expression programs that relates to interaction with specific hTF such as Etv6. We speculate that other tissue-specific transcription factors may regulate cohesin function in other systems and suggest further studies are warranted to test this hypothesis. Finally, we demonstrate that abrogation of cohesin function alters differentiation through the failure to affect a switch from repression to activation at specific genes and propose these genes and continued Etv6 activity as potential therapeutic targets to induce differentiation in AML and MDS.
The online version of this article contains a data supplement.
The publication costs of this article were defrayed in part by page charge payment. Therefore, and solely to indicate this fact, this article is hereby marked “advertisement” in accordance with 18 USC section 1734.
Acknowledgments
The authors are grateful to Robin Antrobus for his help and advice with proteomic experiments and analysis.
The Huntly Laboratory is funded by the European Research Council (grant 647685 Cohesin Mutations in Acute Leukemia [COMAL]), Cancer Research UK (CRUK; C18680/A25508), the Kay Kendall Leukaemia Fund, the Medical Research Council (MRC), Bloodwise, and the Wellcome Trust. Research in the laboratory is supported by core funding from Wellcome and the MRC to the Wellcome-MRC Cambridge Stem Cell Institute. D.S. was a Postdoctoral Fellow of the Mildred-Scheel Organization, German Cancer Aid (111875). N.K.W. and B.G. were funded by the Wellcome Trust, Bloodwise, and CRUK.
Authorship
Contribution: D.S. and B.J.P.H. provided conceptualization; D.S., H.Y., and B.J.P.H. undertook methodology; D.S., M.G., B.G., and B.J.P.H. worked with the software; D.S., H.Y., G.G., J.S., and T.E. undertook formal analysis; D.S., N.K.W., M.G., A.R.G., R.H., N.R., C.S.O., E.P., B.G., P.C., and B.J.P.H. provided resources; P.G. performed research; D.S. and B.J.P.H. wrote the original draft; all author reviewed and edited the article; D.S. and B.J.P.H. undertook visualization; and supervision was provided by B.J.P.H.
Conflict-of interest disclosure: The authors declare no competing financial interests.
Correspondence: Brian J. P. Huntly, Cambridge Institute for Medical Research, Hills Rd, Cambridge CB2 0XY, United Kingdom; e-mail: bjph2@cam.ac.uk.
