

Key Points
Two novel prognostic PTCL subtypes (PTCL-GATA3 and PTCL-TBX21) were classified using an IHC algorithm applicable to routine clinical practice.
Distinct morphological and immunophenotypic features of 2 novel PTCL subtypes were identified.

Abstract
Peripheral T-cell lymphoma (PTCL) is a heterogeneous group of mature T-cell malignancies; approximately one-third of cases are designated as PTCL–not otherwise specified (PTCL-NOS). Using gene-expression profiling (GEP), we have previously defined 2 major molecular subtypes of PTCL-NOS, PTCL-GATA3 and PTCL-TBX21, which have distinct biological differences in oncogenic pathways and prognosis. In the current study, we generated an immunohistochemistry (IHC) algorithm to identify the 2 subtypes in paraffin tissue using antibodies to key transcriptional factors (GATA3 and TBX21) and their target proteins (CCR4 and CXCR3). In a training cohort of 49 cases of PTCL-NOS with corresponding GEP data, the 2 subtypes identified by the IHC algorithm matched the GEP results with high sensitivity (85%) and showed a significant difference in overall survival (OS) (P = .03). The IHC algorithm classification showed high interobserver reproducibility among pathologists and was validated in a second PTCL-NOS cohort (n = 124), where a significant difference in OS between the PTCL-GATA3 and PTCL-TBX21 subtypes was confirmed (P = .003). In multivariate analysis, a high International Prognostic Index score (3-5) and the PTCL-GATA3 subtype identified by IHC were independent adverse predictors of OS (P = .0015). Additionally, the 2 IHC-defined subtypes were significantly associated with distinct morphological features (P < .001), and there was a significant enrichment of an activated CD8+ cytotoxic phenotype in the PTCL-TBX21 subtype (P = .03). The IHC algorithm will aid in identifying the 2 subtypes in clinical practice, which will aid the future clinical management of patients and facilitate risk stratification in clinical trials.
Introduction
Systemic peripheral T-cell lymphomas (PTCL) are aggressive non-Hodgkin lymphomas that are generally associated with a poor outcome.1-3 Although various well-defined subtypes of PTCL are specifically recognized in the current World Health Organization (WHO) classification, approximately one-third of the cases cannot be classified further and are designated as PTCL–not otherwise specified (PTCL-NOS).1,4,5 As a result, PTCL-NOS is a wastebasket category with broad morphological and immunophenotypic characteristics, and a generally poor prognosis with cyclophosphamide, doxorubicin, vincristine, and prednisone (CHOP) or CHOP-like chemotherapy.6-10
Several studies have attempted to identify the clinical and pathologic features of prognostic importance in PTCL-NOS, but the findings have been inconsistent.10-15 Through extensive gene-expression profiling (GEP) studies, we have defined robust molecular signatures for the major subtypes of PTCL.7-9 These studies have also led to the identification of 2 novel biological and prognostic subtypes within PTCL-NOS,7,8 which are alluded to in the recent update of the WHO classification of lymphoid neoplasms.1,16 One subtype, representing 33% of PTCL-NOS,7 is characterized by high expression of GATA3 and its target genes. GATA3 is the master transcriptional regulator in T-helper 2 (TH2) cell differentiation and regulates interleukin-4 (IL-4), IL-5, and IL-13 expression.17 The other subtype, representing 49% of PTCL-NOS,7 is characterized by high expression of TBX21 and its target genes. T-box 21 (T-bet or TBX21) is the master regulator of TH1 and cytotoxic T-cell differentiation and regulates the expression of interferon γ (IFNγ)18 and granzyme B. The GATA3 subtype (designated as PTCL-GATA3) had an inferior clinical outcome compared with the TBX21 subtype (designated as PTCL-TBX21), a finding supported by 2 subsequent independent studies.19,20 Our GEP study also suggested that PTCL-TBX21 contains a subset with a high cytotoxic signature, which shows a worse clinical outcome than the rest of the PTCL-TBX21.7,8 These studies suggest the cell of origin (TH1 or TH2) of these subtypes, but these data need to be interpreted cautiously due to the plasticity associated with T-cell differentiation.21 Our additional studies have provided further evidence that these 2 groups are dependent on distinct genetic pathways and are also characterized by enrichment of distinct oncogenic pathways, with PTCL-GATA3 significantly associated with phosphatidylinositol 3-kinase (PI3K)–mammalian target of rapamycin (mTOR) activation and PTCL-TBX21 showing NF-κB activation.7,8,22
Because GEP studies are carried out using RNA from fresh or frozen tissue biopsies and complex technology, these findings have limited utility in routine clinical practice. Therefore, it is critical that the GEP-based diagnostic signatures be translated to a platform suitable for the clinical setting using the readily available formalin-fixed, paraffin-embedded (FFPE) tissue. In this study, we have translated the GEP signatures of PTCL-NOS into an immunohistochemistry (IHC) format for routine clinical practice. We also described the distinctive morphologic features of PTCL-GATA3 and PTCL-TBX21 that may also help to differentiate these 2 PTCL-NOS subtypes.
Patients and methods
Patient information
We included 173 cases of PTCL-NOS and clinical data from multiple institutions, including a training cohort of 49 cases and a validation cohort of 124 cases. The training cohort included the cases that had been previously evaluated with GEP on frozen tissue using the HG-U133 Plus2 arrays7-9 (Affymetrix, Santa Clara, CA) and had available FFPE samples, whereas the validation cohort was not analyzed by GEP analysis (cohort details in supplemental Figure 1 and supplemental Table 1, available on the Blood Web site). The cases were reviewed by at least 2 hematopathologists to confirm the diagnosis of PTCL-NOS according to the current WHO criteria.1 Cases of nodal PTCL with a T-follicular helper (TFH) phenotype (PTCLs that express 2 or more TFH markers in addition to CD4) were excluded from analysis. All cases had data available on at least 2 TFH markers (PD1, CXCL13, ICOS, CD10, and BCL6), either from the pathology reports or from stains performed on tissue microarray (TMA) sections in this study. The study was approved by the University of Nebraska Medical Center Institutional Review Board. All patients gave informed consent.
Development of IHC algorithm
We considered commercial antibodies against molecules with messenger RNA (mRNA) expression previously obtained from the HG-U133 Plus2 arrays that were significantly correlated (P < .001) with each PTCL subtype7-9 and were expected to show reactivity on FFPE tissues (GATA3, TBX21, CCR4, CXCR3, EOMES, and CCR7). The antibodies with optimal staining, characterized by clear staining of the lymphoid cells with minimum background, selected for the IHC algorithm included: GATA3 and CCR4 for PTCL-GATA3, and TBX21 and CXCR3 for PTCL-TBX21 (supplemental Figure 2). Each antibody was optimized using tonsil and whole-tumor sections using a Ventana or Leica instrument under the conditions stated in supplemental Table 2. Other antibodies (CCR7 and EOMES) showed nonspecific or weak staining and were excluded from analysis.
TMAs were stained with hematoxylin and eosin (H&E) and for CD3 to evaluate each core for the percentage of tumor cell involvement using cytological characteristics (eg, nuclear irregularity and abundant cytoplasm) and the expression pattern of CD3 compared with healthy T cells. All TMAs were stained with the algorithm antibodies (GATA3, TBX21, CXCR3, and CCR4), except for CCR4 IHC, which was evaluated in 136 of 173 cases (40 of 49 training cohort and 96 of 124 validation cohort) due to insufficient tissue. Blinded to the GEP classification, each core was evaluated by visual estimation independently by 2 pathologists (C. Amador and T.C.G.) for the percentage of tumor cells staining for each antibody, and recorded in 10% increments. The core with the highest percentage of tumor cells stained was used for analysis. Different decile cutoffs were evaluated for each immunostain to determine the threshold of positivity that optimally divided the GEP-defined subtypes, based on the least number of cases assigned to the alternative subtype.
After the IHC algorithm was locked down, the training cohort (n = 49) was reviewed and scored independently by a third hematopathologist (D.D.W.) at a different institution. The hematopathologist was blinded to the selected threshold of positivity, to the GEP results, and to the IHC-based classification by the other 2 hematopathologists.
Immunophenotype and morphologic characteristics
A subset of cases (n = 57), from the validation and training cohorts, was also stained for CD4, CD8, CD30, cytotoxic markers (TIA1 and granzyme B) and Epstein-Barr virus–encoded RNA (EBER) in situ hybridization using TMAs. CD30 and cytotoxic markers were graded as the proportion of positive tumor cells (0-3+). EBER positivity was evaluated semiquantitatively as previously described.10 The immunophenotype data in the remaining study cases were obtained from diagnostic IHC studies on whole tissue sections. All data are included in supplemental Table 1. Two hematopathologists (C. Amador and T.C.G.), blinded to the PTCL subtype, also independently evaluated the morphologic features including: growth pattern, inflammatory background, tumor cell size, and cytology.
Statistical analysis
The mRNA expression data were treated as a continuous variable and presented as the mean plus or minus standard error of the mean, whereas IHC positivity was presented as discrete percentages. Spearman correlation was used to assess the association between mRNA expression levels and IHC positivity. Scatterplots display the relationships with linear regression or smoothing spline fit lines. Intraclass correlation coefficient (ICC) was used to assess the pathologists’ agreement on IHC positivity and morphology pattern. Recursive partitioning methodology was used to produce a classification/decision tree that informed the IHC subtype definition. Sensitivity, specificity, and overall accuracy were determined for the training cohort comparing the IHC-defined subtype to the GEP gold-standard classification. Patient and morphologic characteristics were compared between training and validation cohorts using the χ2 or Fisher exact test.
The Kaplan-Meier method was used to estimate the overall survival (OS) distributions. OS times were calculated as the time from diagnosis to the date of death or last contact. Patients who were alive at last contact were treated as censored for the OS analysis. The log-rank test was used to compare survival distributions by IHC-based diagnosis. Univariate Cox proportional hazards regression assessed clinical and pathologic characteristics with OS. Cox proportional hazards regression was used to assess the effect of the IHC subtype in the presence of the International Prognostic Index (IPI) classification. The interaction between IHC subtype and IPI classification was considered in the model, but was excluded because it was not significant (P = .52). All statistical tests were 2-sided and P values <.05 were considered to be statistically significant unless specified otherwise. The data analysis for this manuscript was conducted using SAS.V9.4 software (SAS Institute, Cary, NC).
Results
Patient characteristics in the training and validation cohorts
The training cohort included 49 cases that were used in previous GEP studies7-9 and were molecularly classified as PTCL-GATA3 (n = 14) and PTCL-TBX21 (n = 26), and showed the expected difference in OS. The remaining cases (n = 9) were unclassifiable by GEP. Some clinical and pathological characteristics of these patients have been reported in earlier studies.5,10
The validation cohort included 124 FFPE cases of PTCL-NOS that were not part of GEP studies, but were diagnosed by expert hematopathologists using current WHO diagnostic criteria. There were no major differences in the clinical characteristics of the training and validation cohorts, except that the GEP cohort had significantly older patients (P = .04) (Table 1). The majority of the cases in both cohorts were treated with a CHOP or CHOP-like regimen. Clinical outcome data were available in 142 of the 173 study cases, and the median follow-up of the surviving patients was 1.5 years (range, 0.01-13.4 years) in the training cohort and 1.7 years (range, 0.01-25.4 years) in the validation cohort, suggesting an aggressive clinical course in both cohorts. There was no significant difference in OS between the validation and training cohorts (P = .6) or by the sites of origin (P = .35) (supplemental Figure 3).
Comparison of the clinical characteristics of the training and validation cohorts
| Training cohort, n = 49 | Validation cohort, n = 124 | ||||
|---|---|---|---|---|---|
| n= | n (%) | n= | n (%) | P | |
| IHC classification | 49 | 124 | .66 | ||
| PTCL-GATA3 | 15 (31) | 46 (37) | |||
| PTCL-TBX21 | 31 (63) | 69 (56) | |||
| Unclassified | 3 (6) | 9 (7) | |||
| Sex | 42 | 100 | .54 | ||
| Female | 17 (40) | 35 (35) | |||
| Male | 25 (60) | 65 (65) | |||
| Age, y | 39 | 98 | .04 | ||
| ≤60 | 13 (33) | 52 (53) | |||
| >60 | 26 (67) | 46 (47) | |||
| Stage | 17 | 73 | .22 | ||
| I/II | 2 (12) | 20 (27) | |||
| III/IV | 15 (88) | 53 (73) | |||
| Extranodal sites | 6 | 74 | .66 | ||
| ≤1 | 4 (67) | 54 (73) | |||
| >1 | 2 (33) | 20 (27) | |||
| Serum LDH level | 14 | 67 | 1.00 | ||
| Normal | 5 (36) | 25 (37) | |||
| High | 9 (64) | 42 (63) | |||
| IPI score | 13 | 63 | .24 | ||
| Low: 0-2 | 5 (38) | 36 (57) | |||
| High: 3-5 | 8 (62) | 27 (43) | |||
| Treatment | 7 | 63 | .07 | ||
| CHOP/CHOP-like | 4 (57) | 55 (87) | |||
| Other | 2 (29) | 7 (11) | |||
| None | 1 (14) | 1 (2) | |||
Not all data were available for all cases.
LDH, lactate dehydrogenase.
Development of an antibody panel for the IHC algorithm
Four antibodies were selected, including 2 with nuclear staining (GATA3 and TBX21 transcription factors) that are generally associated with TH2 and TH1 cells, respectively, and 2 with membranous staining (CCR4 and CXCR3) as their transcriptional targets (Figure 1). The selected antibodies showed significant positive correlations (P < .01; r ≥ 0.5) between the percentage of positive cells and the corresponding mRNA expression levels (Figure 2A), with GATA3 and CCR4 showing a high linear correlation and TBX21 and CXCR3 showing a curvilinear relationship. Consistent with the mRNA findings, positive correlations between GATA3 or TBX21 protein expression and their corresponding target proteins (CCR4 and CXCR3, respectively) were found. No correlation between GATA3 and TBX21 expression was observed (supplemental Figure 4A). There was a difference in the distributions of IHC positivity with a bimodal distribution for GATA3 and CCR4, and a positively skewed distribution for TBX21 and CXCR3 (supplemental Figure 4B).
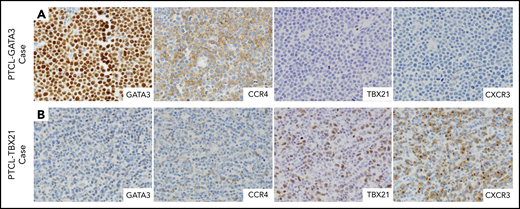
Selected IHC panel included in the diagnostic algorithm. (A) Positive immunostains for GATA3 (nuclear) and its corresponding target protein CCR4 (membranous) in a PTCL-GATA3 case. This case is negative for TBX21 and CXCR3. (B) Positive immunostains for TBX21 (nuclear) and its target protein CXCR3 (membranous) in a PTCL-TBX21 case. This case is negative for GATA3 and CCR4. (A-B) Original magnification ×600.
Selected IHC panel included in the diagnostic algorithm. (A) Positive immunostains for GATA3 (nuclear) and its corresponding target protein CCR4 (membranous) in a PTCL-GATA3 case. This case is negative for TBX21 and CXCR3. (B) Positive immunostains for TBX21 (nuclear) and its target protein CXCR3 (membranous) in a PTCL-TBX21 case. This case is negative for GATA3 and CCR4. (A-B) Original magnification ×600.
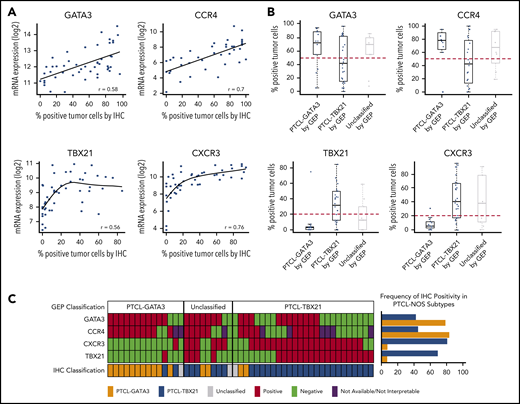
Antibody selection for the IHC algorithm. (A) Correlation between mRNA and IHC expression of GATA3, CCR4, TBX21, and CXCR3 in the training cohort. Positive correlation was observed between mRNA and the corresponding protein expression by IHC. The percentage of positivity was estimated in discrete increments of 10% and correlated with the mRNA gene expression obtained using HG U133 Plus 2 arrays. (B) Distribution of immunostain positivity in the corresponding GEP-defined molecular subtypes. Top panels, The PTCL-GATA3 subtype showed higher positivity for GATA3 and CCR4 immunostains compared with the PTCL-TBX21 subtype, with 50% being the best cutoff to separate the 2 subtypes. Bottom panels, The PTCL-TBX21 subtype showed higher positivity for TBX21 and CXCR3 compared with the PTCL-GATA3 subtype, with most PTCL-TBX21 cases showing ≥20% positivity for TBX21 and CXCR3, and most PTCL-GATA3 cases showing <20% positivity. These cutoffs were subsequently used for the IHC algorithm. (C) Heatmap representation of the GATA3, CCR4, TBX21, and CXCR3 immunostains in GEP-defined subtypes and IHC algorithm classification in training cohort cases. The frequency of the individual immunostain positivity in the training cohort in the PTCL subtypes is shown on the right.
Antibody selection for the IHC algorithm. (A) Correlation between mRNA and IHC expression of GATA3, CCR4, TBX21, and CXCR3 in the training cohort. Positive correlation was observed between mRNA and the corresponding protein expression by IHC. The percentage of positivity was estimated in discrete increments of 10% and correlated with the mRNA gene expression obtained using HG U133 Plus 2 arrays. (B) Distribution of immunostain positivity in the corresponding GEP-defined molecular subtypes. Top panels, The PTCL-GATA3 subtype showed higher positivity for GATA3 and CCR4 immunostains compared with the PTCL-TBX21 subtype, with 50% being the best cutoff to separate the 2 subtypes. Bottom panels, The PTCL-TBX21 subtype showed higher positivity for TBX21 and CXCR3 compared with the PTCL-GATA3 subtype, with most PTCL-TBX21 cases showing ≥20% positivity for TBX21 and CXCR3, and most PTCL-GATA3 cases showing <20% positivity. These cutoffs were subsequently used for the IHC algorithm. (C) Heatmap representation of the GATA3, CCR4, TBX21, and CXCR3 immunostains in GEP-defined subtypes and IHC algorithm classification in training cohort cases. The frequency of the individual immunostain positivity in the training cohort in the PTCL subtypes is shown on the right.
Determination of immunostain thresholds
The thresholds for positivity were determined based on the percentage of staining that optimally divided the GEP-defined subtypes in the training cohort, with a minimal error rate when compared with the GEP classification. This resulted in 20% for the TBX21 and CXCR3 immunostains, whereas the optimal cutoff for the GATA3 and CCR4 immunostains was 50% of the neoplastic cells. As can be seen in Figure 2B, <10% of the cases in the PTCL-GATA3 subtype showed expression of TBX21 >20% (mean = 6%; range, 0% to 70%). In contrast, 70% of the cases in the PTCL-TBX21 subtype showed expression of TBX21 >20% (mean = 30%; range, 0% to 80%), thus defining a natural threshold for the TBX21 immunostain. Although PTCL-GATA3 cases in general showed higher expression of GATA3 (mean = 60%; range, 0% to 100%) than the PTCL-TBX21 cases (mean = 42%; range, 0% to 100%), most of the PTCL-TBX21 cases showed >10% of GATA3 immunostaining. Thus, a higher threshold of 50% was chosen for the GATA3 immunostain, which best separated both groups. Similar findings were observed for their corresponding target protein expression. Other cutoffs of positivity resulted in an increased error rate (Figure 2B).
Performance of individual immunostains in the training cohort
Using these cutoffs, GATA3 expression was positive in 59% (29 of 49), CCR4 in 60% (24 of 40), TBX21 in 47% (23 of 49), and CXCR3 in 57% (28 of 49) of cases in the training cohort. Only 6% (3 of 49) of cases were negative for all 4 immunostains. Additionally, 32% (16 of 49) of cases showed double expression defined as above threshold expression of GATA3 and/or CCR4, plus TBX21 and/or CXCR3. Though individual immunostains showed association with their corresponding molecular subtypes (supplemental Table 3), double expression was predominant in the PTCL-TBX21 subtype compared with PTCL-GATA3: 38% (10 of 26) and 7% (1 of 14), respectively (P = .03) (Figure 2C). GATA3 and CCR4 expression was found to be lower in the double expressors than in the PTCL-GATA3 subtype (GATA3 mean positivity = 64% vs 77% [P = .003]; CCR4 mean positivity = 48% vs 60% [P = .002]).
At the selected cutoffs of positivity, we examined the prognostic value of the individual immunostains in the training cohort and observed that no protein showed a significant association with OS (supplemental Figure 5A). Similarly, double expressors showed no association with OS in the PTCL-TBX21 subtype (P = .2).
Generation of the IHC algorithm and its prognostic significance
We used decision-tree classification methodology, a nonparametric computational algorithm23 based on multiple protein covariates, for developing the prediction algorithm in the training data. Of the several models tested, we used supervised knowledge with minimal error rate to derive an accurate classification algorithm with the 4 immunostains, with an order as shown in Figure 3A. Using this IHC algorithm, we accurately classified 85% (34 of 40) of the GEP-defined cases compared with the molecular subclassification, and 2 of the 40 cases were unclassifiable (Figure 3B). The IHC algorithm predicted OS, with the PTCL-GATA3 subtype associated with an inferior OS (P = .03) (Figure 4A). Of the 9 cases unclassifiable by GEP, 6 were classified as PTCL-TBX21, 2 as PTCL-GATA3, and 1 remained unclassifiable by the IHC algorithm.
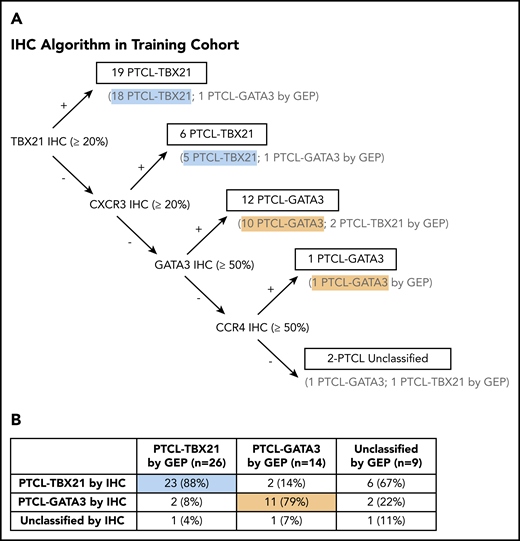
Decision tree for IHC subclassification. (A) The IHC algorithm was generated using the 40 PTCL-NOS cases that were classified by the GEP as PTCL-GATA3 and PTCL-TBX21. The 9 cases unclassifiable by GEP were not included in the training of the algorithm. (B) Comparison of the IHC and GEP-defined PTCL subtypes resulted in an accurate classification of 85% of cases, with 5% remaining unclassifiable.
Decision tree for IHC subclassification. (A) The IHC algorithm was generated using the 40 PTCL-NOS cases that were classified by the GEP as PTCL-GATA3 and PTCL-TBX21. The 9 cases unclassifiable by GEP were not included in the training of the algorithm. (B) Comparison of the IHC and GEP-defined PTCL subtypes resulted in an accurate classification of 85% of cases, with 5% remaining unclassifiable.
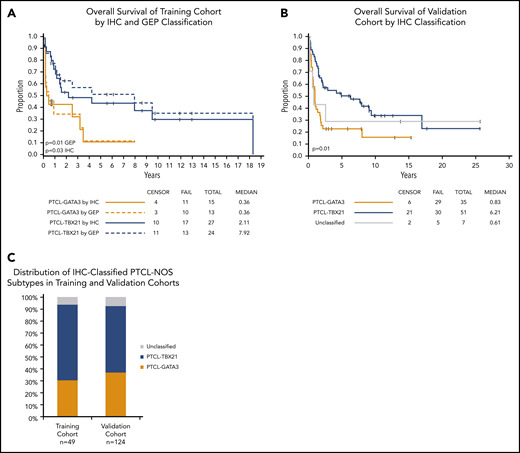
OS of the PTCL subtypes using IHC classification. (A) Significant differences in OS were observed between the PTCL-GATA3 and PTCL-TBX21 subtypes using the IHC algorithm and are comparable to the GEP classification (dotted line) in the training cohort. (B) OS curves in the validation cohort using the IHC algorithm. PTCL-GATA3 was significantly associated with worse prognosis in both cohorts. (C) Distribution (percentage) of IHC-defined subtypes was similar in both cohorts.
OS of the PTCL subtypes using IHC classification. (A) Significant differences in OS were observed between the PTCL-GATA3 and PTCL-TBX21 subtypes using the IHC algorithm and are comparable to the GEP classification (dotted line) in the training cohort. (B) OS curves in the validation cohort using the IHC algorithm. PTCL-GATA3 was significantly associated with worse prognosis in both cohorts. (C) Distribution (percentage) of IHC-defined subtypes was similar in both cohorts.
The use of >2 antibodies resulted in a decrease of the misclassification rate. The addition of CCR4 resulted in the accurate classification of 86% (12 of 14) of PTCL-GATA3 cases, compared with 78% (11 of 14) when anti-GATA3 was used alone. Similarly, the addition of CXCR3 resulted in the accurate classification of 88% (23 of 26) of PTCL-TBX21 cases, compared with 69% (18 of 26) when anti-TBX21 was used alone (Figure 2C).
Reproducibility of the IHC algorithm
A moderate to high correlation in assessing tumor positivity was observed between pathologists for individual immunostains (ICC range, 0.65-0.86). Three of the 4 antibodies included in the algorithm (GATA3, CCR4, and CXCR3) showed good intraclass correlation (ICC > 0.73; range, 0.73-0.86) among all 3 pathologists, whereas TBX21 showed moderate intraclass correlation (ICC > 0.65, range, 0.65-0.85) (supplemental Figure 6). When the IHC algorithm was used independently by the 2 initial pathologists, we observed agreement in 93% (46 of 49) of cases and, upon joint review, a consensus was reached on all cases. When the IHC classification was tested by a third, independent hematopathologist, the IHC-defined classification showed agreement in 90% (44 of 49) of cases (κ = 0.77; 95% confidence interval [CI], 0.71-1.0), reflecting a high interobserver reproducibility.
Validation of the IHC algorithm prognostication using a second PTCL-NOS cohort
To further validate the utility of the IHC algorithm, we collected a second cohort of pretreatment PTCL-NOS biopsies (n = 124) with no prior GEP data. The validation cohort showed a similar distribution of IHC positivity for all 4 antibodies (supplemental Figure 4B). Likewise, positive correlation between GATA3 and TBX21 expression and their corresponding target proteins (CCR4 and CXCR3, respectively), and no correlation between GATA3 with TBX21 were observed (supplemental Figure 4A). The distribution of positivity of the individual immunostains at the selected cutoffs did not differ between the training and validation cohorts (supplemental Table 4; supplemental Figure 7). There was a significant association of CXCR3 (P = .013) and TBX21 (P = .018) expression with OS in the validation cohort, but a nonsignificant trend was observed for GATA3 and CCR4 expression as individual markers (supplemental Figure 5B).
Applying the IHC algorithm, the PTCL-GATA3 subtype represented 37% (46 of 124) of cases; the PTCL-TBX21 subtype represented 56% (69 of 124), and 7% (9 of 124) remained unclassifiable. Thus, the frequency of PTCL-GATA3 and PTCL-TBX21 subtypes is concordant with the training cohort subclassification (Figure 4C). Concordant results with the training cohort were observed as a significantly inferior OS was observed for the PTCL-GATA3 subtype (P = .003), thus validating the robustness of the algorithm (Figure 4B).
Univariate Cox proportional hazards regression models of the combined cohorts show that PTCL-GATA3 IHC classification, high IPI, older age, and >1 extranodal site were associated with greater risk of death (Table 2). Multivariate analysis in the combined cohorts with complete clinical data (n = 67) demonstrated that the IHC algorithm classification is predictive of OS with the risk of death 2.8 (95% CI, 1.51-5.01; P = .0009) times higher in the PTCL-GATA3 subtype vs the PTCL-TBX21 subtype after adjusting for IPI (high vs low; hazard ratio [HR], 1.86; 95% CI, 1.04-3.34; P = .037).
Univariate and multivariate model of OS
| Univariate | Multivariate | |||||||
|---|---|---|---|---|---|---|---|---|
| n | HR | 95% CI | P | n | HR | 95% CI | P | |
| PTCL-GATA3 vs PTCL-TBX21 by IHC | 128 | 2.39 | 1.55-3.70 | <.0001 | 67 | 2.75 | 1.51-5.01 | .0009 |
| Sex: male vs female | 128 | 1.09 | 0.71-1.69 | .69 | ||||
| Morphology | ||||||||
| Monomorphous vs polymorphous | 121 | 1.77 | 1.14-2.75 | .0095 | ||||
| CD8+ vs CD8− | 120 | 0.75 | 0.46-1.22 | .24 | ||||
| CD4+ vs CD4− | 121 | 1.24 | 0.76-2.05 | .39 | ||||
| CTX phenotype vs non-CTX phenotype | 70 | 0.87 | 0.46-1.63 | .65 | ||||
| IPI factors | ||||||||
| High IPI vs low IPI | 74 | 2.13 | 1.21-3.74 | .0089 | 67 | 1.8 | 1.0-3.24 | .05 |
| Age: >60 y vs ≤60 y | 124 | 1.95 | 1.27-3.01 | .0025 | ||||
| Stage: III/IV vs I/II | 85 | 1.77 | 0.91-3.44 | .092 | ||||
| High LDH vs normal LDH | 78 | 1.69 | 0.95-3.02 | .074 | ||||
| Extranodal sites: >1 vs ≤1 | 77 | 1.85 | 1.04-3.29 | .035 | ||||
CTX, cytotoxic. See Table 1 for expansion of other abbreviations.
Distinctive morphological and immunophenotypic features in the PTCL subtypes classified by the IHC algorithm
The morphology evaluation was performed on the combined training and validation cohorts. Most PTCL-GATA3 cases (85%) showed a monotonous pattern of either sheets of intermediate-sized cells with abundant clear cytoplasm (pattern 1) or large clusters or sheets of large cells (pattern 2) (Figure 5A-B). These 2 patterns were tumor cell rich with a minimal inflammatory background. The PTCL-TBX21 cases more often had a polymorphous appearance rich in inflammatory cells (78% of cases). These cases had either a polymorphous infiltrate composed of variably sized neoplastic cells interspersed in a mixed inflammatory background of variable proportions of small lymphocytes, eosinophils, plasma cells, and histiocytes (pattern 3), or atypical small tumor cells admixed with clusters of epithelioid histiocytes in a Lennert (lymphohistiocytic) pattern (pattern 4) (Figure 5C-D). The Lennert lymphoma pattern was only observed in PTCL-TBX21. These 4 morphological patterns were significantly associated with the PTCL-NOS subtypes (P < .001) (Figure 5E). Good interobserver agreement was found between 2 pathologists in assessing these morphologic patterns (κ = 0.82; 95% CI, 0.71-1.0). The Lennert lymphoma and monomorphic patterns (1 and 2) were associated with worse OS in the combined cohorts (Figure 5F).
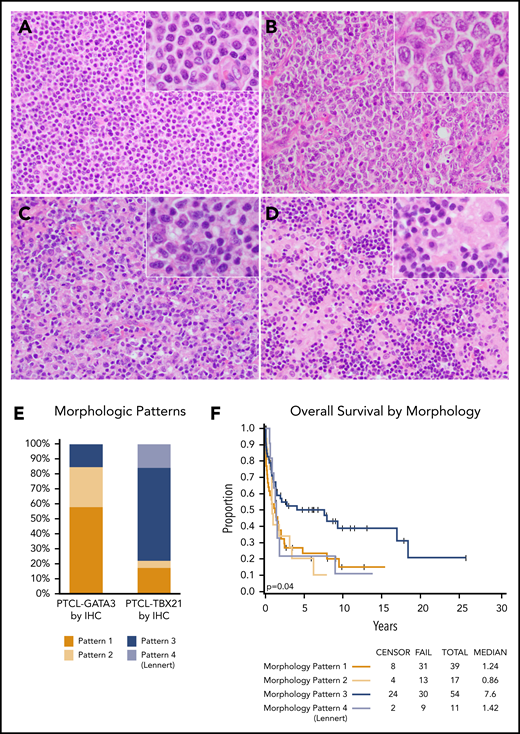
Representative morphologic patterns in PTCL subtypes. PTCL-GATA3 was significantly associated with a monomorphic, monotonous, tumor cell–rich morphology with a minimal inflammatory background characterized by: (A) small-intermediate cells with abundant cytoplasm (pattern 1) or (B) clusters or sheets of large cells (pattern 2). In contrast, PTCL-TBX21 was significantly associated with a polymorphous morphology, characterized by (C) neoplastic cells interspersed in a mixed inflammatory background (pattern 3) or (D) the classic lymphohistiocytic (Lennert) lymphoma morphology composed of small tumor cells within clusters of epithelioid histiocytes (pattern 4). (E) Distribution (percentage) of morphological patterns in the 2 PTCL subtypes with monomorphic patterns associated with PTCL-GATA3, whereas polymorphic patterns associated with PTCL-TBX21 (P < .001). (F) The monomorphic patterns (1 and 2) and the Lennert lymphoma pattern (pattern 4) were associated with worse OS, when both cohorts were combined. (A-D) H&E stain; original magnification ×200; inset magnification ×400.
Representative morphologic patterns in PTCL subtypes. PTCL-GATA3 was significantly associated with a monomorphic, monotonous, tumor cell–rich morphology with a minimal inflammatory background characterized by: (A) small-intermediate cells with abundant cytoplasm (pattern 1) or (B) clusters or sheets of large cells (pattern 2). In contrast, PTCL-TBX21 was significantly associated with a polymorphous morphology, characterized by (C) neoplastic cells interspersed in a mixed inflammatory background (pattern 3) or (D) the classic lymphohistiocytic (Lennert) lymphoma morphology composed of small tumor cells within clusters of epithelioid histiocytes (pattern 4). (E) Distribution (percentage) of morphological patterns in the 2 PTCL subtypes with monomorphic patterns associated with PTCL-GATA3, whereas polymorphic patterns associated with PTCL-TBX21 (P < .001). (F) The monomorphic patterns (1 and 2) and the Lennert lymphoma pattern (pattern 4) were associated with worse OS, when both cohorts were combined. (A-D) H&E stain; original magnification ×200; inset magnification ×400.
In the subset of cases immunophenotyped on TMA (n = 57; Figure 6A), the PTCL-GATA3 subtype most frequently showed a CD4+/CD8− immunophenotype (79%; 15 of 19). The PTCL-TBX21 subtype group was more heterogeneous with CD4+/CD8− and CD8+/CD4− immunophenotypes found at 50% (19 of 38) and 31% (12 of 38) of cases, respectively. The expression of cytotoxic markers (TIA-1 and/or granzyme B) was more frequently associated with PTCL-TBX21 compared with PTCL-GATA3 (54% [20 of 38] vs 11% [2 of 19]; P < .001), including the CD8+ cytotoxic phenotype (32% [12 of 38] vs 5% [1 of 19]; P = .04). No difference in OS was observed in the cases with a cytotoxic immunophenotype when compared with noncytotoxic PTCL-TBX21 (supplemental Figure 8C). EBER positivity and CD30 expression were infrequent and present at similar frequencies in both subtypes (Figure 6B-E).
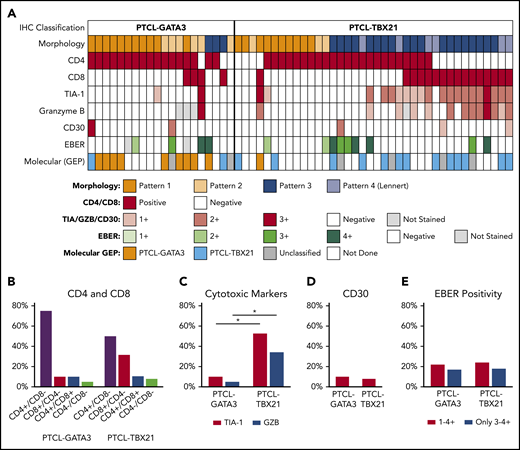
Association of morphologic patterns and additional immunophenotypic features in PTCL subtypes classified by the IHC algorithm. (A) Heatmap representation of the morphologic patterns (1-4) and CD4, CD8, TIA-1, granzyme B, and CD30 immunostain and EBER in situ hybridization positivity in PTCL subtypes in training and validation cohort studied on TMA (n = 57). Each case is represented by a column, with CD4/CD8 reported as positive and negative and cytotoxic markers/CD30 positivity graded as 0-3. EBERs was evaluated semiquantitatively calculating the average number of positive cells per field (f): 0/f = 0; <1/f = 1+; 1 to 9/f = 2+; 10 to 50/f = 3+; and >50/f = 4+. Distribution of (B) CD4 and CD8 single-positive, double-positive, or double-negative immunophenotype; (C) cytotoxic markers; (D) CD30; and (E) EBER in the 2 PTCL subtypes. *There is a significant association of cytotoxic marker expression with PTCL-TBX21 subtype (P < .001).
Association of morphologic patterns and additional immunophenotypic features in PTCL subtypes classified by the IHC algorithm. (A) Heatmap representation of the morphologic patterns (1-4) and CD4, CD8, TIA-1, granzyme B, and CD30 immunostain and EBER in situ hybridization positivity in PTCL subtypes in training and validation cohort studied on TMA (n = 57). Each case is represented by a column, with CD4/CD8 reported as positive and negative and cytotoxic markers/CD30 positivity graded as 0-3. EBERs was evaluated semiquantitatively calculating the average number of positive cells per field (f): 0/f = 0; <1/f = 1+; 1 to 9/f = 2+; 10 to 50/f = 3+; and >50/f = 4+. Distribution of (B) CD4 and CD8 single-positive, double-positive, or double-negative immunophenotype; (C) cytotoxic markers; (D) CD30; and (E) EBER in the 2 PTCL subtypes. *There is a significant association of cytotoxic marker expression with PTCL-TBX21 subtype (P < .001).
Discussion
The introduction of several genomic technologies, especially GEP, has improved the classification of PTCL, with robust molecular diagnostic and prognostic signatures identified for the major subtypes of PTCL.7-9,24,25 However, PTCL-NOS represents a challenging issue, as it suffers from being a diagnosis of exclusion, which can translate into suboptimal patient management. However, 2 biological subtypes of prognostic significance (PTCL-GATA3 and PTCL-TBX21) have been delineated in PTCL-NOS,7,8 which likely represent lymphomas derived from 2 distinct T-cell subsets.26 In a recent study, we demonstrated distinct genetic profiles in these subtypes of PTCL that further support the validity of the GEP subclassification and vulnerabilities to distinct therapeutic regimens.22 Although these gene-signature classifiers have clinical utility, they are not readily applicable in routine clinical practice, as freshly isolated RNA, and sophisticated bioinformatics analysis are required. Therefore, defining the molecular subtypes of PTCL-NOS in FFPE tissue by using standard IHC methodology would have great clinical utility to improve the diagnosis, prognostication, and patient management of PTCL-NOS, much like the impact of GEP-defined molecular subgroup analysis in DLBCL.27
In the current study, we developed a novel IHC algorithm using a small panel of antibodies, which can accurately predict the 2 subtypes of PTCL-NOS. The training cohort was specifically chosen to include cases of PTCL-NOS with GEP and corresponding FFPE samples. This approach provided the scientific basis to generate an accurate algorithm with high sensitivity and specificity. The selected antibodies identify molecules with mRNA expression that are highly associated with the PTCL-GATA3 and PTCL-TBX21 subtypes in GEP studies,7,8 and are reactive in FFPE tissue. Compared with GEP, this IHC panel reproduced the gene expression results in 85% of cases in the training cohort and predicted OS, thus retaining sensitivity, specificity, and prognostic value of the molecular subclassification. The few misclassified cases could be due to nonrepresentative tissues with low tumor content in the GEP samples, which may have influenced the gene-expression results. This is known to be a major issue in GEP studies, particularly for PTCL, where normal T cells are intermixed at varying percentages. Alternatively, nonreactivity of the immunostains secondary to overfixation or suboptimal antigen retrieval could contribute to underperformance of the algorithm. The advantage of the IHC algorithm is the ability to quantify the percentage of the tumor involvement based on the cytological characteristics and CD3 staining. Because the evaluation of some of the cases may still be challenging, dual or triple staining may facilitate the stratification of challenging cases. Methodology improvements could be explored in future studies. Despite the few discrepancies in the training cohort, we validated the algorithm in a second cohort of cases, thus reaffirming the predictive value of our IHC panel. Interestingly, the IHC algorithm was able to classify cases that were not classified by GEP and the classification matched the expected morphological and immunophenotypic features.
We derived the IHC algorithm using TMA staining, as this is a cost-effective tool that allows the rapid evaluation of IHC, and other studies have shown good agreement (97% to 100%) between TMA and whole-section staining.27,28 We have successfully used these approaches in our prior studies in subgroup classification of DLBCL.27-30 In the initial phase of our study, we used whole-tumor sections to standardize the immunostains and found comparable results in whole and TMA sections. Our algorithm is easy to apply to the clinical practice because widely available instruments and commercially available antibodies can be used. Only 4 additional stains are required for subclassification of PTCL-NOS, thus limited tissue is required. If tissue is limited, the use of anti-CCR4 is optional because it shows high concordance with GATA3 expression and, in our training cohort, only aided in subtyping 1 additional case. Furthermore, the IHC-algorithm classification was shown to have a high interobserver reproducibility between hematopathologists.
The antibodies used in the IHC algorithm have not only prognostic significance, but demonstrate the biological basis of subclassification in PTCL cases as well. The transcription factors GATA3 and TBX21 are master regulators of TH2 and TH1 differentiation and function, respectively.31 GATA3 promotes TH2 cytokine secretion and inhibits IFN-γ production through repression of IL-12 signaling.32 Murine studies have suggested that GATA3 is critical for IL-5 and IL-13, but not IL-4, production. GATA3 also regulates the development and function of T-cells, natural killer (NK) cell generation, and is involved in tumorigenesis.33 TBX21 is a TH1-specific transcription factor selectively expressed in TH1 cells, and induces TH1 gene-expression programs by repressing TH2 cytokine synthesis.18,34 It is widely accepted that these master regulators not only regulate their cytokine secretion profiles, but also chemokine profiles. Specifically, the TH1 phenotype is characterized by CXCR3 and CCR5, whereas CCR4, CCR3, and CCR8 are selective markers for the TH2 phenotype.35 Differential expression patterns of chemokine receptors have been reported for various T-cell lymphoma entities (eg, CCR4 in adult T-cell leukemia/lymphoma).36 TBX21 also regulates cytotoxic CD8+ T-cell differentiation,37 thus it is expected to be expressed in this subtype. Consistent with our earlier observation,7,8 we found the cytotoxic immunophenotype to be enriched in the IHC classified PTCL-TBX21 subtype. In the earlier GEP studies, quantitative differences between CD8+ T-cell signatures vs plasma cell signatures showed significant differences in OS.7 However, the small number of cytotoxic cases available in the current study hinders our investigation of whether a cytotoxic phenotype is predictive of worse survival. Interestingly, a subset of PTCL-TBX21 cases also had expression of GATA3 and CCR4, which requires additional investigation. However, these cases showed lower expression of GATA3 and CCR4 compared with cases classified as the PTCL-GATA3 subtype and were similar to other PTCL-TBX21 cases in their pathological characteristics and clinical outcome (data not shown). In the future, it is also important to define the genetic landscape of these PTCL subtypes to better refine our subclassification and provide further understanding of their biology.
This study also highlights some differences in the morphological, immunophenotypic, and tumor microenvironment characteristics of these subtypes. The differences in tumor microenvironment may influence the cytokine milieu and T-cell differentiation pattern in these tumors. PTCL-GATA3 appears to be a more uniform group, mostly composed of monotonous tumor cells with a minimal inflammatory background, predominantly CD4+ and rarely expressing cytotoxic markers. PTCL-TBX21 is a more heterogeneous group with a mixture of CD4+ and CD8+ cases, and variable cytotoxic marker expression, often with a polymorphous pattern of neoplastic cells interspersed in a rich inflammatory background, including the Lennert lymphoma pattern. Although the association with the morphologic patterns is an important finding, as it further highlights the differences between the 2 molecularly defined PTCL subtypes, the patterns cannot be a substitute for the IHC algorithm.
The identification of these meaningful biological subtypes within PTCL-NOS has immediate translational relevance, as accurate subclassification can be used for patient management, including possible novel therapeutic intervention. For example, the PTCL-GATA3 subtype may benefit from the chimeric anti-CCR4 monoclonal antibody, which has efficacy in adult T-cell leukemia/lymphoma38 and also PI3K inhibitors39 (eg, duvelisib or idelalisib) as PI3K activation was identified to be more often associated with this subtype due to the frequent phosphatase and tensin homolog (PTEN) deletion.22 In contrast, PTCL-TBX21 subtype patients may benefit from tumor microenvironment modulators (eg, lenalidomide)40 and NF-κB inhibitors41,42 and the list will probably grow in the future. Therefore, accurate molecular subclassification of PTCL-NOS will be essential in selecting the most appropriate treatment regimens for patients in future clinical trials.
Please e-mail the corresponding author for original data.
Presented in part at the 107th annual meeting of the United States & Canadian Academy of Pathology, Vancouver, BC, Canada, 17-23 March 2018, and at the 108th annual meeting of the United States & Canadian Academy of Pathology, National Harbor, MD, 16-21 March 2019.
The online version of this article contains a data supplement.
The publication costs of this article were defrayed in part by page charge payment. Therefore, and solely to indicate this fact, this article is hereby marked “advertisement” in accordance with 18 USC section 1734.
Acknowledgments
The authors thank Lijun Sun at University of Nebraska Medical Center (UNMC) and Aimin Li at City of Hope (COH) for optimization of the immunostains, the Tissue Science Facility of UNMC and Mayo Clinic for performance of the immunostains, and Maarja-Liisa Nairismägi and Chee Leong Cheng for preparing the TMA and samples at Singapore General Hospital.
J.I. and W.C.C. were supported by UH2/UH31UH2CA206127, STTR 1R41CA221466, and POI 1P01CA229100 from the National Institutes of Health National Cancer Institute, and National Cancer Institute Eppley Cancer Center Support grant P30CA036727. W.C.C. was supported by National Cancer Institute Specialized Program of Research Excellence (SPORE) 2P50CA107399-11A1, and City of Hope Cancer Center Support grant P30 CA033572. A.L.F. was supported in part by P50 CA97274 from the National Cancer Institute. S.T.L. and C.K.O. were supported by research funding from the Singapore Ministry of Health’s National Medical Research Council, the Tanoto Foundation, New Century Foundation Pte Ltd, the Ling Foundation, the Singapore National Cancer Centre Research Fund, and the Oncology Academic Clinical Program (ONCO ACP) Cancer Collaborative Scheme.
Authorship
Contribution: C. Amador, W.C.C., T.C.G., and J.I. designed the study and performed the research; L. M. Smith, T.B.H., A.B., and W.L. organized and analyzed the data; C. Amador collected data; C. Amador, T.C.G., F.D., M.B.P., A.L.F., S.P., C. Agostinelli, A.M., A.R., G.O., L.d.L., P.G., S.T.L., C.K.O., S.L.O., J.S., E.C., K.T.G., E.S.J., L.M.R., K.J.S., L. M. Staudt, J.V., D.D.W., and W.C.C. provided materials, conducted the pathological review, and/or contributed clinical data; and C. Amador and J.I. wrote the manuscript.
Conflict-of-interest disclosure: The authors declare no competing financial interests.
A complete list of the members of the Lymphoma/Leukemia Molecular Profiling Project appears in the supplemental appendix.
Correspondence: Javeed Iqbal, Department of Pathology and Microbiology, University of Nebraska Medical Center, 986842 Nebraska Medical Center, Omaha, NE 68198-6842; e-mail: jiqbal@unmc.edu; and Catalina Amador, Department of Pathology and Microbiology, University of Nebraska Medical Center, 986842 Nebraska Medical Center, Omaha, NE 68198-6842; e-mail: catalina.amador@unmc.edu.

This feature is available to Subscribers Only
Sign In or Create an Account Close Modal