

Key Points
Early intervention with tocilizumab and steroids does not impact the expansion or persistence of SCRI-CAR19v1 CAR T cells in B-ALL.
Administration of tocilizumab and corticosteroids does not negatively impact the efficacy of SCRI-CAR19v1.

Abstract
Immunotherapy with the adoptive transfer of T cells redirected with CD19-specific chimeric antigen receptors (CARs) for B-lineage acute lymphoblastic leukemia (ALL) can salvage >80% of patients having relapsed/refractory disease. The therapeutic index of this emerging modality is attenuated by the occurrence of immunologic toxicity syndromes that occur upon CAR T-cell engraftment. Here, we report on the low incidence of severe cytokine release syndrome (CRS) in a subject treated with a CAR T-cell product composed of a defined ratio CD4:CD8 T-cell composition with a 4-1BB:zeta CAR targeting CD19 who also recieved early intervention treatment. We report that early intervention with tocilizumab and/or corticosteroids may reduce the frequency at which subjects transition from mild CRS to severe CRS. Although early intervention doubled the numbers of subjects dosed with tocilizumab and/or corticosteroids, there was no apparent detrimental effect on minimal residual disease–negative complete remission rates or subsequent persistence of functional CAR T cells compared with subjects who did not receive intervention. Moreover, early intervention therapy did not increase the proportion of subjects who experience neurotoxicity or place subjects at risk for infectious sequelae. These data support the contention that early intervention with tocilizumab and/or corticosteroids in subjects with early signs of CRS is without negative impact on the antitumor potency of CD19 CAR T cells. This intervention serves to enhance the therapeutic index in relapsed/refractory patients and provides the rationale to apply CAR T-cell therapy more broadly in ALL therapy. This trial was registered at www.clinicaltrials.gov as #NCT020284.
Introduction
The impressive antitumor potency of chimeric antigen receptor (CAR) T cells with CD19 specificity for relapsed/refractory B-cell acute lymphoblastic leukemias (B-ALL) and lymphomas has changed the treatment landscape of these aggressive B-cell malignancies.1-4 One impediment to the widespread deployment is the occurrence of immunologic toxicities associated with initial CAR T-cell engraftment.5-8
The most common and severe toxicities related to CAR T-cell therapy for B-ALL patients are cytokine release syndrome (CRS) and neurotoxicity. CRS has been reported to occur any time in the first 2 weeks after an infusion of CAR T cells in up to 54% to 91% of patients, including severe CRS (sCRS) in 8.3% to 43%, depending on CAR product type and toxicity grading scale.1,2,9,10 CRS is a direct result of the synchronous activation of CAR T cells encountering CD19-expressing leukemic cells and B lymphocytes, and, the resultant cascade of cytokine signaling triggered outputs by responsive cells of the innate immune system.11 A driver cytokine of CRS is interleukin-6 (IL-6), a major mediator of inflammation. The clinical symptoms of CRS include fever and hypotension, with a lower incidence of respiratory failure. Additional clinical laboratory abnormalities include elevated levels of C-reactive protein (CRP) and ferritin.5,6,9
Several groups have developed strategies for the mitigation of sCRS. Toxicity mitigation has typically been reserved for patients already experiencing life-threatening symptoms, based on concerns that earlier intervention with immunomodulatory medications may adversely impact the efficacy of the CAR T cells, potentially affecting remission and ongoing CAR T-cell persistence. The first reports of treatment of sCRS originated from Children’s Hospital of Philadelphia. Researchers described successful intervention with tocilizumab, an anti–IL-6 receptor antibody in a patient with life-threatening CRS.12 This has led to widespread use of tocilizumab for the treatment of sCRS, with the US Food and Drug Administration providing rationale for expanding the label of tocilizumab to include treatment of sCRS.13 However, optimal tocilizumab dosing and timing of intervention have yet to be determined. Corticosteroids have been administered for sCRS as well, particularly in situations in which tocilizumab was not fully effective. Initial reports in subjects who received corticosteroids were that they had muted expansion and lacked persistence,14 consistent with the known immunosuppressive effects of corticosteroids.15
We have previously reported the initial results of our institutional phase 1 study, Pediatric and Young Adult Leukemia Adoptive Therapy (PLAT)-02. In this study, we treated children and young adults with relapsed/refractory B-ALL with SCRI-CAR19v1, a defined CD4:CD8 composition, 4-1BB:zeta CAR product dosed at CAR+ cells per kilogram (maximum tolerated dose determined to be 106 CAR+ cells per kilogram).1 We found a minimal residual disease (MRD)-negative complete remission (CR) rate of 93% in treated subjects and an estimated 12-month event-free survival rate of 50.8%.1 sCRS occurred in 23% of subjects and was related to CAR T-cell dose but not to disease status or CD19 antigen burden.1 We now report a more detailed analysis of the clinical and laboratory findings of CRS from the phase 1 portion of PLAT-02, as well as the results of an early intervention (EI) strategy that entailed dosing of tocilizumab and/or dexamethasone during periods of mild CRS and prior to the development of sCRS.
Methods
Study design and participants
PLAT-02 (NCT02028455) is a phase 1/2 trial of feasibility and safety of the CD19 CAR T-cell product, SCRI-CAR19v1, for the treatment of CD19+ leukemia.1 The study was conducted in accordance with US Food and Drug Administration and International Conference on Harmonization Guidelines for Good Clinical Practice, the Declaration of Helsinki, and applicable institutional review board requirements. All subjects or their guardians provided written informed consent. Individual participant data will not be shared. Subjects enrolled on the PLAT-02 study underwent apheresis and CAR T-cell manufacturing, followed by lymphodepletion and CAR T-cell infusion, as previously described.1
Definition and grading of CRS and neurotoxicity
CRS was graded according to Common Terminology Criteria for Adverse Events v4.0.3 (CTCAEv4) and protocol-specific interpretation with the following criteria: grade 1: fever, body aches; grade 2: medication for symptom relief, including oxycodone, ondansetron, and single normal saline (NS) bolus; grade 3: multiple NS boluses, no vasopressors, headache requiring IV narcotics, supplemental oxygen; and grade 4: vasopressors. CTCAE CRS criteria were not adequate for delineating mild vs severe cases. Therefore, we further defined mild CRS and sCRS. sCRS was defined as the use of vasopressors at any dose, intubation for respiratory failure, or the use of inotropes. Severe neurotoxicity was any grade 3 or higher CTCAEv4 neurotoxicity, with the addition of grade 2 seizures. Headache was not considered a neurotoxicity.
Dose-limiting toxicities (DLTs) were defined as any grade 3 or higher toxicity designated as definitely or probably related to CAR T cells and occurring within 30 days of the T-cell infusion, with several exceptions. The following were excluded from DLTs at the time of T-cell infusion: grade 4 fever, grade 3 chills, grade 3 cough, grade 3 transaminases, grade 3 hypotension, and grade 3 CRS. Non-DLTs at the time of T-cell engraftment included grade 4 fever for up to 2 weeks, grade 3 chills for up to 5 days, grade 3 transaminases lasting up to 2 weeks, grade 4 hypotension limited to a single pressor for up to 72 hours, grade 4 CRS with hypotension alone limited to single pressor support for up to 72 hours, grade 4 lymphopenia, grade 4 leukopenia, grade 3 bone pain, grade 4 tumor lysis, and grade 3 encephalopathy for up to 72 hours.
CRS and neurotoxicity management
The first 23 subjects, referred to as the DLT cohort, received tocilizumab (8-12 mg/kg) with or without corticosteroids, if there was occurrence of any related grade 4 toxicity (including non-DLTs) lasting for >48 hours and not controlled by medical intervention or a DLT lasting for >48 hours not controlled by medical intervention. Corticosteroid therapy was required in subjects with grade ≥3 nonhematologic toxicities that were attributable to the infused T-cell product, lasted for >48 hours, and were not controlled by other medical therapy (including cytokine-directed therapy) or that put the subject at significant risk for an adverse outcome if measures were not taken to ameliorate the toxicity.
The protocol was modified to provide guidelines for EI with CRS. The next 20 subjects, referred to as the EI cohort, received tocilizumab and dexamethasone (5-10 mg every 6-12 hours as needed) for persistent symptoms of mild CRS using clinical criteria (supplemental Table 1, available on the Blood Web site).
Evaluation of clinical laboratory parameters, CAR T-cell counts, and response
Clinical laboratory tests included serial monitoring of ferritin, CRP, complete blood count with differential, and lactate dehydrogenase (LDH). Engraftment of CAR T cells and B-cell aplasia (BCA) were determined by flow cytometry, as previously described.1 Serum cytokine concentrations of granulocyte-macrophage colony-stimulating factor, soluble (s)CD137, interferon-γ, sFas, sFas ligand, granzyme A, granzyme B, IL-2, IL-4, IL-5, IL-6, IL-10, IL-13, macrophage inflammatory protein-1α, macrophage inflammatory protein-1β, tumor necrosis factor-α, and perforin were evaluated using a MILLIPLEX MAP Human CD8+ T Cell Magnetic Bead Panel (Millipore, Burlington, MA), per the manufacturer’s instructions.
Statistical analyses
Standard descriptive statistics (median/range, percentage, and response rates) were reported for key variables. Comparisons of continuous variables between 2 categories were made using the Wilcoxon test, comparisons among 3 categories were made using the Kruskal-Wallis test, and comparisons of categorical variables between 2 categories were made using Fisher’s exact test. The Jonckheere trend test was used to compare variables of interest with dose levels. Kaplan-Meier curves were calculated for time-to-event end points: overall survival (OS), leukemia-free survival (LFS), and BCA. The OS curves include data from all infused subjects. The LFS and BCA curves include data from all infused subjects who obtained a CR. Log-rank tests were used to compare between-group differences in survival curves. P values reported are 2-sided without multiplicity adjustments. Analyses were performed using Prism 7 (GraphPad) and SAS (version 9.4; SAS Institute Inc., Cary, NC).
Results
Description of the PLAT-02 subjects analyzed for CRS
Forty-three subjects with B-ALL were enrolled and treated with SCRI-CAR19v1 on the phase 1 portion of PLAT-02. The median age at the time of enrollment was 12.3 years (range, 1.3-25.4). Twenty-eight subjects (62%) had a history of ≥1 allogeneic transplantation. Seven subjects had previously received CD19-directed therapy: blinatumomab (n = 6) or second-generation (CD28:zeta) CD19-specific CAR T cells (n = 1).
The use of alternative grading of CRS affects the rates of grade 3/4 CRS
Forty of the 43 treated subjects developed CRS. The protocol graded CRS according to CTCAEv4 and, because of the variability among the CRS grading scales (supplemental Table 2) described to date, we also compared the grading of CRS using the grading systems from contemporary published pediatric B-ALL CD19 CAR trials. Of the 40 cases with CRS graded according to CTCAEv4, 5 were grade 1, 18 were grade 2, 8 were grade 3, and 9 were grade 4 (Table 1). Although 21% of subjects treated on PLAT-02 met the criteria for grade 4 CRS by CTCAEv4, no subject met the criteria for grade 4 CRS based on the severity scales described by Lee et al11 or used by the University of Pennsylvania,16 demonstrating the impact that the grading scale can have on the incidence of high-grade CRS.
Grade of CRS for PLAT-02 subjects according to 3 commonly used scales
| CRS grade | CTCAEv4 | Lee et al11 | UPENN16 |
|---|---|---|---|
| 0 | 3 (7.0) | 3 (7.0) | 3 (7.0) |
| 1 | 5 (11.6) | 17 (39.5) | 0 |
| 2 | 18 (41.8) | 21 (48.8) | 20 (46.5) |
| 3 | 8 (18.6) | 2 (4.7) | 20 (46.5) |
| 4 | 9 (21.0) | 0 | 0 |
| CRS grade | CTCAEv4 | Lee et al11 | UPENN16 |
|---|---|---|---|
| 0 | 3 (7.0) | 3 (7.0) | 3 (7.0) |
| 1 | 5 (11.6) | 17 (39.5) | 0 |
| 2 | 18 (41.8) | 21 (48.8) | 20 (46.5) |
| 3 | 8 (18.6) | 2 (4.7) | 20 (46.5) |
| 4 | 9 (21.0) | 0 | 0 |
Data are n (%).
UPENN, University of Pennsylvania.
We next created a separate study-specific definition of sCRS to overcome the limitations of the CTCAEv4 grading system (see “Methods”). The 10 cases of sCRS identified with our new criteria included the 9 grade 4 CRS events, as well as 1 additional subject who had grade 3 CRS accompanied by grade 3 left ventricular dysfunction, requiring inotrope support. The predominant symptom that contributed to the severity of CRS was hypotension requiring pressor support, which occurred in 9 of the 10 cases of sCRS. No subject required intubation for respiratory failure or administration of multiple or high-dose vasopressors.
The development of an EI strategy for the management of CRS
The first 23 subjects to receive SCRI-CAR19v1, referred to as the DLT cohort, received tocilizumab and/or corticosteroids only if they developed dose-limiting and/or life-threating toxicities associated with CRS or neurotoxicity. In the DLT cohort of subjects, 22% (5/23) received tocilizumab and 17% (4/23) received steroids; all but 1 of the subjects who received steroids also received tocilizumab. With the observation that tocilizumab and corticosteroid use did not appear to be affecting the CAR T-cell performance, we instituted an EI treatment strategy for the next 20 treated subjects. These subjects, referred to as the EI cohort, were designated to receive tocilizumab and/or corticosteroids for persistent symptoms of mild CRS and prior to the development of dose-limiting or life-threatening toxicities (Figure 1). Compared with the DLT cohort, a higher percentage of subjects in the EI cohort received tocilizumab (60%, 12/20; P = .014) or steroids (25%, 5/20; P = .71), and all 5 subjects who received steroids had also received tocilizumab.
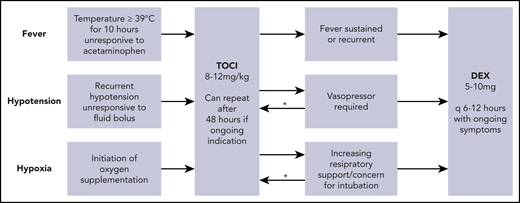
Treatment of CRS in the EI cohort with tocilizumab and dexamethasone. Persistent symptoms of mild CRS with a focus on persistent fever, early hypotension, and mild hypoxia are treated with tocilizumab (TOCI). Dexamethasone (DEX) is administered for more severe symptoms and continued until resolution of the symptoms. *For subjects who meet criteria for dexamethasone but have not yet received tocilizumab or received it >48 hours prior, tocilizumab is given concurrently with the dexamethasone.
Treatment of CRS in the EI cohort with tocilizumab and dexamethasone. Persistent symptoms of mild CRS with a focus on persistent fever, early hypotension, and mild hypoxia are treated with tocilizumab (TOCI). Dexamethasone (DEX) is administered for more severe symptoms and continued until resolution of the symptoms. *For subjects who meet criteria for dexamethasone but have not yet received tocilizumab or received it >48 hours prior, tocilizumab is given concurrently with the dexamethasone.
Of the 10 sCRS subjects in both cohorts, 2 did not receive any intervention, 3 received tocilizumab alone, and 5 received tocilizumab with steroids. Of the 30 mild CRS subjects, 6 received tocilizumab, 3 received tocilizumab with steroids, and 1 received steroids alone, which were given for neurotoxicity. Therefore, 53% of tocilizumab administration and 45% of steroid use occurred for mild cases of CRS. The time between the onset of CRS and administration of tocilizumab was slightly earlier in the EI cohort, with a mean of 3 days (range, 1-5) vs 3.8 days (range, 3-6) in the DLT cohort (P = .24). Similar trends were seen with the use of corticosteroids, with means of 3.8 days (range, 2-6) and 5.75 days (range, 4-9), respectively (P = .18). The mean total duration of steroid use was 8.3 days in the DLT cohort and 3.8 days in the EI cohort (P = .07).
The impact of EI on the incidence of sCRS
The 2 CRS intervention strategy cohorts (DLT vs EI) had similar overall rates of CRS: 91% (21/23) vs 95% (19/20), respectively. However, we observed a higher rate of sCRS in the DLT cohort (30%; 95% confidence interval, 13-53; 7/23) compared with the EI cohort (15%; 95% confidence interval, 3-38; 3/20), although this finding lacked statistical significance (P = .29). The incidence of neurotoxicity was similar between the 2 cohorts: 48% (11/23) for DLT vs 50% (10/20) for EI (P = 1). However, in contrast to sCRS, a similar rate of severe neurotoxicity was seen (22% [5/23] vs 25% [5/20], respectively; P = 1).
Clinical description of CRS in subjects dosed with SCRI-CAR19v1
All cases of CRS presented within 11 days of CAR T-cell infusion, with a median onset of 8 days (range, 5-11), 6 days (range, 3-10), 5 days (range, 4-8), and 4 days (range, 2-10) for dose levels 1, 2, 3, and 4, respectively (Figure 2A-B). The day of onset of CRS correlated with CAR T-cell dose level (PLAT-02 phase 1 dose levels ranged from 0.5 to 10 × 106 CAR+ T cells per kilogram), with higher dose levels leading to an earlier onset of CRS (P = .0042). The median duration of CRS was 5 days (range, 1-17) and was similar in the DLT and EI cohorts (median, 4 vs 5 days; mean, 7 vs 6 days; P = .5). The dose level of CAR T cells also correlated with CRS severity, with an increased frequency of sCRS with increased dose level (P = .042). The doses administered in the DLT cohort were higher than those in the EI cohort (dose level 1: n = 7 and n = 6; dose level 2: n = 6 and n = 12; dose level 3: n = 5 and n = 2); and dose level 4: n = 5 and n = 0, respectively).

The onset of CRS following CAR T-cell infusion is variable and related to dose level with primary symptom of fever, which may be affected by increased use of tocilizumab in the EI cohort. (A) Swimmer plot of time to onset of CRS and its severity and duration (gray, no CRS; yellow, mild CRS; red, sCRS), with administration of tocilizumab (arrowheads) and dexamethasone (asterisks), as well as annotation for the assigned intervention cohort (DLT and EI; y-axis). (B) The onset of CRS by dose level of CAR T cells, as well as the severity of CRS by dose level (gray, mild CRS; red, sCRS). (C) Maximum fever following CAR T-cell infusion through day +28 grouped based on the presence or absence of sCRS. (D) Maximum fever based on CRS severity in the DLT cohort (D) and the EI cohort (E). *P < .05, **P ≤ .01. NS, not significant.
The onset of CRS following CAR T-cell infusion is variable and related to dose level with primary symptom of fever, which may be affected by increased use of tocilizumab in the EI cohort. (A) Swimmer plot of time to onset of CRS and its severity and duration (gray, no CRS; yellow, mild CRS; red, sCRS), with administration of tocilizumab (arrowheads) and dexamethasone (asterisks), as well as annotation for the assigned intervention cohort (DLT and EI; y-axis). (B) The onset of CRS by dose level of CAR T cells, as well as the severity of CRS by dose level (gray, mild CRS; red, sCRS). (C) Maximum fever following CAR T-cell infusion through day +28 grouped based on the presence or absence of sCRS. (D) Maximum fever based on CRS severity in the DLT cohort (D) and the EI cohort (E). *P < .05, **P ≤ .01. NS, not significant.
Of the 40 subjects who developed CRS, 39 presented with mild symptoms, and 1 subject presented to the hospital with symptoms of sCRS. Compared with subjects who developed mild CRS or no CRS, subjects who evolved to sCRS had a similar peak in temperature (P = .1; Figure 2C). However, the fever was higher in sCRS subjects vs subjects without sCRS (P = .03; Figure 2D) in the DLT cohort, but not in the EI cohort (P = 1; Figure 2E), potentially reflective of the fever-suppressive effect of tocilizumab, which was given more frequently in the EI cohort.
Clinical laboratory findings associated with CRS severity induced by SCRI-CAR19v1
Laboratory markers of inflammation and bone marrow function were evaluated in all treated subjects from the time of T-cell infusion through day +28. There was no difference in laboratory markers when comparing the CRS intervention strategy cohorts (DLT vs EI). In the entire group of treated subjects, peak CRP values following CAR T-cell infusion were positively associated with sCRS; however, the association was not statistically significant (P = .19; no sCRS: mean, 16.2 mg/dL [range, 0.8-50.1], median, 13.7 mg/dL; sCRS: mean, 22.5 mg/dL [range, 4.6-42.2], median, 23.1 mg/dL; Figure 3A).
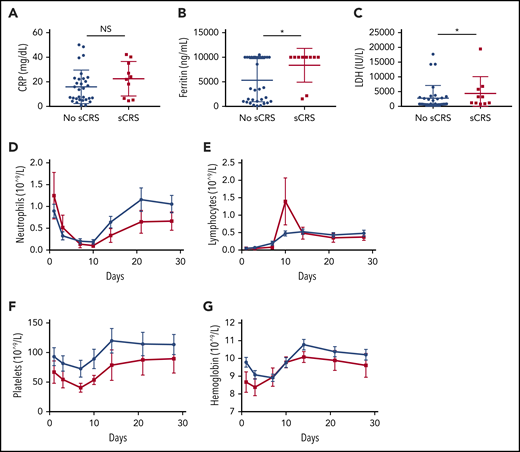
The relationship between laboratory values and severity of CRS. Absolute maximum values of CRP (A), ferritin (B) and LDH (C) between day 0 and day 28 in patients with sCRS or without CRS. over time from day 0 through day 28. Absolute neutrophil count (D), absolute lymphocyte count (E), platelet count (F), and hemoglobin levels (G) in patients with sCRS (red) and without CRS (blue) from day 0 to day 28. *P < .05, NS, not significant.
The relationship between laboratory values and severity of CRS. Absolute maximum values of CRP (A), ferritin (B) and LDH (C) between day 0 and day 28 in patients with sCRS or without CRS. over time from day 0 through day 28. Absolute neutrophil count (D), absolute lymphocyte count (E), platelet count (F), and hemoglobin levels (G) in patients with sCRS (red) and without CRS (blue) from day 0 to day 28. *P < .05, NS, not significant.
Baseline ferritin levels were elevated in all subjects (median, 1905 ng/mL; range, 123 to >10 000). Subjects with sCRS (n = 10) had a higher ferritin peak, defined as the highest value in the first 28 days after CAR T-cell infusion, compared with subjects without sCRS (P = .034; Figure 3B). The majority (8/10) of subjects with sCRS had a peak ferritin level > 10 000 mg/dL, a value that is a diagnostic criterion for hemophagocytic lymphohistiocytosis. Thirteen of 30 subjects with mild CRS also attained a peak ferritin level > 10 000 mg/dL. A limitation of this comparison is that, for most of the study duration, the laboratory upper limit of ferritin quantitation was 10 000 mg/dL.
Most subjects had an elevation in baseline LDH (median, 579 IU/mL; range, 258-3319), and this was not predictive of the occurrence of sCRS; however, subjects experiencing sCRS had higher LDH peaks compared with their counterparts without sCRS (P = .029; Figure 3C). Hematologic perturbations were also noted in sCRS subjects compared with subjects without sCRS, including slower recovery of neutrophil, hemoglobin, and platelet counts, but they lacked significance at all time points (Figure 3D-G).
Serum cytokines associated with sCRS
In the first 28 days following SCRI-CAR19v1 infusion, peak levels of granulocyte-macrophage colony-stimulating factor, tumor necrosis factor-α, interferon-γ, IL-6, IL-2, IL-10, IL-5, sFas, and granzyme B were significantly higher in sCRS subjects (supplemental Figure 3) compared with subjects who did not develop sCRS. Higher peak cytokine levels were also seen in those subjects who received tocilizumab, regardless of the incidence of sCRS (Figure 4). Intervention with tocilizumab can increase serum IL-6 levels, because it inhibits the clearance of this cytokine. It is unknown what effects tocilizumab has on levels of other cytokines. A few cytokines showed significantly higher levels in the subjects who received tocilizumab and also developed sCRS (supplemental Figure 2). There was no statistically significant difference in peak cytokine levels between the subjects, irrespective of sCRS or intervention given, in the DLT and EI cohorts (supplemental Figure 3).

Serum cytokines are impacted by administration of tocilizumab, regardless of the occurrence of sCRS. (A) GMCSF; (B) TNFα; (C) INFγ; (D) IL-2; (E) IL-5; (F) IL-6; (G) IL-10; (H) IL-13; (I) granzyme B; (J) granzyme A; (K) MIP-1b; (L) sCD137; (M) sFas. Serum cytokines in the peripheral blood are noted by the maximum value following CAR T-cell infusion through day 28, grouped by patients who did and did not develop sCRS. *P ≤ .05, **P ≤ .01, ***P ≤ .001, ****P ≤ .0001.
Serum cytokines are impacted by administration of tocilizumab, regardless of the occurrence of sCRS. (A) GMCSF; (B) TNFα; (C) INFγ; (D) IL-2; (E) IL-5; (F) IL-6; (G) IL-10; (H) IL-13; (I) granzyme B; (J) granzyme A; (K) MIP-1b; (L) sCD137; (M) sFas. Serum cytokines in the peripheral blood are noted by the maximum value following CAR T-cell infusion through day 28, grouped by patients who did and did not develop sCRS. *P ≤ .05, **P ≤ .01, ***P ≤ .001, ****P ≤ .0001.
Dosing of tocilizumab and/or corticosteroids is not associated with increased incidence of serious infection
There is a possibility that the use of immunomodulatory or immunosuppressive medications could result in an increased infection risk. There was no difference in the rate of infection post-CAR T-cell infusion when comparing subjects who did or did not receive steroids (P = .247). Tocilizumab is known to cause neutropenia; however, in subjects who did and did not receive tocilizumab, there was no difference in the percentage of those whose absolute neutrophil count recovered to >200 per microliter by 21 days from CAR T-cell infusion (P = .206; relative risk, 0.76).
Early use of tocilizumab and corticosteroids does not decrease the efficacy of SCRI-CAR19v1
There was no impact of EI with tocilizumab or dexamethasone on the MRD-negative CR rate (91% in the DLT cohort vs 95% in the EI cohort). The durability of the remission also was not impacted by the CRS intervention strategy, with overlapping LFS and OS between the DLT and EI cohorts (Figure 5A-B). When segregated into groups based on the immunomodulatory intervention received (no intervention, tocilizumab only, and steroids with or without tocilizumab), no statistical difference was noted for LFS or OS (Figure 5C-D).
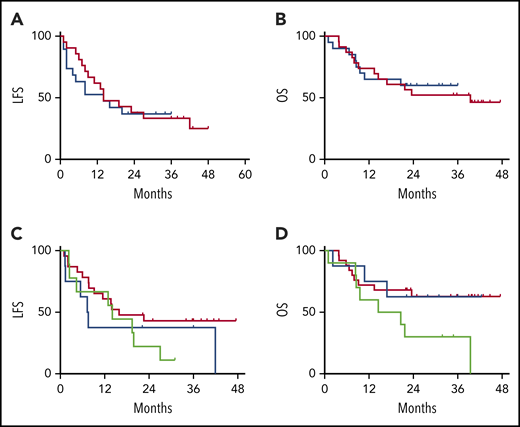
LFS and OS are unaffected by CRS treatment strategy or administered CRS-directed treatment. All subjects were analyzed for LFS and OS following CAR T-cell infusions. The DLT cohort (red) and the EI cohort (blue) had similar LFS Kaplan-Meier curves (A) and OS Kaplan-Meier curves (B). Separately, all subjects were categorized per the specific intervention received. Intervention groups are steroid with or without tocilizumab (green), tocilizumab (blue), and none (red), with no difference between LFS Kaplan-Meier curves (C) and OS Kaplan-Meier curves (D).
LFS and OS are unaffected by CRS treatment strategy or administered CRS-directed treatment. All subjects were analyzed for LFS and OS following CAR T-cell infusions. The DLT cohort (red) and the EI cohort (blue) had similar LFS Kaplan-Meier curves (A) and OS Kaplan-Meier curves (B). Separately, all subjects were categorized per the specific intervention received. Intervention groups are steroid with or without tocilizumab (green), tocilizumab (blue), and none (red), with no difference between LFS Kaplan-Meier curves (C) and OS Kaplan-Meier curves (D).
The early use of tocilizumab and corticosteroids does not impair SCRI-CAR19v1 product engraftment or persistence
The numerical expansion of CD19 CAR T cells in vivo is associated with their ability to mediate initial leukemia remissions.17 Those subjects with sCRS have higher peak expansion (P = .01) and area under the curve following the CAR T-cell infusion through day +63 than do subjects without sCRS (Figure 6A,D). Importantly, we observed no differences in absolute peak CAR T-cell engraftment or area under the curve based on the CRS intervention cohorts (Figure 6B,E). Subjects who received immunomodulatory treatment with tocilizumab and/or corticosteroids, regardless of CRS intervention cohort, had statistically significantly higher peak CAR T-cell engraftments and areas under the curve (Figure 6C,F).
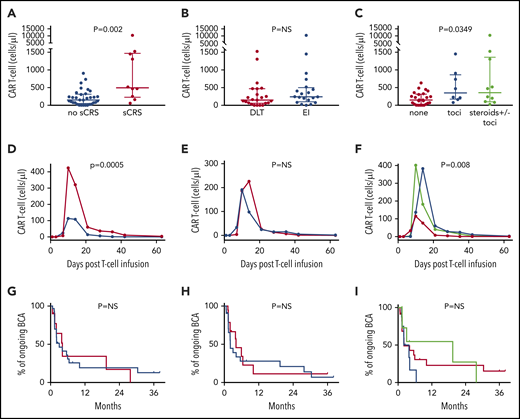
EI did not impact engraftment, expansion, or persistence of CAR T cells. All subjects were analyzed for engraftment and expansion of CAR T cells over time in the peripheral blood using flow cytometry. For analysis, all subjects were compared based on the occurrence of sCRS, on the intervention cohort assignment (DLT vs EI), and on the treatment received, regardless of the intervention cohort assignment. (A) The peak number of CAR T cells in the blood was higher in subjects who developed sCRS compared with those who did not. (B) The peak number of CAR T cells was not different between the intervention cohorts. (C) The peak number of CAR T cells was different among the 3 groups based on the immunomodulatory treatment received. (D) The area under the curve of CAR T-cell engraftment was higher in the group of subjects that experienced sCRS (red) vs no sCRS (blue). (E) The area under the curve of CAR T-cell engraftment was similar in the 2 intervention cohorts (red, DLT cohort; blue, EI cohort). (F) The area under the curve of CAR T-cell engraftment was enhanced in the groups that recieved immunomodulatory interventions (red, no intervention; blue, tocilizumab; green, steroids with or without tocilizumab). (G) The probability of having ongoing functional persistence of CAR T cells, as measured by BCA, is demonstrated by Kaplan-Meier curves. There was no difference between patients who developed sCRS (red) and those who did not (blue). There was no difference between the DLT (red) and EI cohorts (blue) (H) or among the immunomodulatory interventions received (red, no intervention; blue, tocilizumab; and green, steroids with or without tocilizumab) (I). NS, not significant; toci, tocilizumab.
EI did not impact engraftment, expansion, or persistence of CAR T cells. All subjects were analyzed for engraftment and expansion of CAR T cells over time in the peripheral blood using flow cytometry. For analysis, all subjects were compared based on the occurrence of sCRS, on the intervention cohort assignment (DLT vs EI), and on the treatment received, regardless of the intervention cohort assignment. (A) The peak number of CAR T cells in the blood was higher in subjects who developed sCRS compared with those who did not. (B) The peak number of CAR T cells was not different between the intervention cohorts. (C) The peak number of CAR T cells was different among the 3 groups based on the immunomodulatory treatment received. (D) The area under the curve of CAR T-cell engraftment was higher in the group of subjects that experienced sCRS (red) vs no sCRS (blue). (E) The area under the curve of CAR T-cell engraftment was similar in the 2 intervention cohorts (red, DLT cohort; blue, EI cohort). (F) The area under the curve of CAR T-cell engraftment was enhanced in the groups that recieved immunomodulatory interventions (red, no intervention; blue, tocilizumab; green, steroids with or without tocilizumab). (G) The probability of having ongoing functional persistence of CAR T cells, as measured by BCA, is demonstrated by Kaplan-Meier curves. There was no difference between patients who developed sCRS (red) and those who did not (blue). There was no difference between the DLT (red) and EI cohorts (blue) (H) or among the immunomodulatory interventions received (red, no intervention; blue, tocilizumab; and green, steroids with or without tocilizumab) (I). NS, not significant; toci, tocilizumab.
The duration of functional persistence, as measured by ongoing BCA, was not affected by the occurrence of sCRS (4.1 months for sCRS vs 3 months for no sCRS, P = .9), or the CRS intervention cohorts (2.1 months for DLT group vs 4.1 months for EI group, P = .5). Among the subjects treated with different immunomodulators, the group that received steroids had the longest median duration of functional persistence of CAR T cells, although it was not significant (2.1 vs 3.0 vs 19.4 months for no immunomodulation, tocilizumab, and steroids with or without tocilizumab, respectively, P = .4) (Figure 6G-I).
Discussion
CAR T-cell therapy has resulted in unprecedented remission rates in patients with B-ALL. However, the high frequency of immunologic toxicities, such as CRS, requires sophisticated critical care support that curtails deployment beyond tertiary care centers. Predisposition to immunologic toxicities, as well as antitumor potency, are likely affected by several variables. These include product composition of defined CD4:CD8 ratio, CAR type used (eg, CD28:zeta vs 4-1BB:zeta, and culture technique (which affects differentiation status).18-21 Our group has pursued the engineering of products with defined CD4:CD8 T-cell ratios and uniform expression of the CAR and generated culture systems that retard terminal differentiation of naive and memory cells into effector cells ex vivo. This manufacturing strategy has reduced the subject-to-subject variability in products.1,22
Varying rates of sCRS have been reported across trials.2,5,9,14 As we demonstrate here, the diverse grading systems for CRS have resulted in problematic comparisons of trials similar to PLAT-02. Using the CTCAE grading scale, 21% of subjects had grade 4 CRS; however, with the alternatively used grading systems, we encountered no cases of grade 4 CRS. This lack of occurrence of grade 4 CRS using alternative grading scales contrasts with contemporary trials of childhood acute lymphoblastic leukemia reporting that 14%,9 27%,23 and 25%2 of subjects experience grade 4 CRS. Previous publications have also proposed predictive markers for development of sCRS5,6 ; however, we were not able to identify similar predictive clinical or laboratory markers of sCRS. Therefore, we cannot address whether some subjects in the EI cohort would have been predicted to develop sCRS but did not because of EI. The inability to validate other groups’ predictive markers and clinical factors associated with sCRS or to identify our own may be related to the CAR T-cell product or to the varying definitions of sCRS. The field will benefit from the recently published consensus grading guidelines for CRS and neurotoxicity from the American Society for Transplantation and Cellular Therapy to allow for improved cross-trial comparisons.24
It is possible that our manufacturing platform, as well as our EI strategy, contributed to the low incidence of sCRS in our study. Our data do not permit a definitive analysis of the relative contribution of these 2 factors. The lack of statistical significance with regard to the reduction in sCRS cases using the EI strategy is noteworthy and may be due to small subject numbers or confounded by the dose-escalation design of the phase 1 study; fewer subjects in the EI cohort received the highest dose levels, warranting further investigation to confirm these findings. Most importantly, this EI strategy did not negatively impact the high rate of remission induction or subsequent durable engraftment of functional CAR T-cell grafts, nor did it impact the incidence of severe neurotoxicity.
At the time that we initiated PLAT-02, little was known about the impact of immunomodulatory agents on CAR T-cell efficacy, including induction of remission and long-term persistence. For this reason, the initial cohort of PLAT-02 subjects only received interventions when they reached a high level of toxicity. However, with gained experienced, we opted to move forward with a more aggressive intervention strategy, with a goal of preventing serious/life-threatening toxicity caused by CRS. Although this strategy results in doubling of the numbers of subjects exposed to tocilizumab and/or corticosteroids, we did not observe any concerning adverse events, including impairment of efficacy, exacerbating neurotoxicity, or heightened risk for infectious sequelae.
Corticosteroids are known to blunt T-cell antigen receptor–mediated activation signaling pathways and induce T-cell apoptosis.15 However, the high levels of ERK activation induced by CAR signaling is 1 possible pathway to glucocorticoid resistance seen with CAR T cells that requires further exploration.25,26 Although the data were not statistically significant, we observed that subjects exposed to glucocorticoids during CRS appear to have the longest duration of subsequent functional CAR T-cell persistence. This effect did not seem to be driven by the occurrence of sCRS, because the duration of persistence of the CAR T cells, when grouped by occurrence of sCRS, is not different from that in patients without sCRS. Additionally, half of the subjects in the group who received corticosteroids had mild CRS. It is possible that glucocorticoid exposure may affect CAR T cells in a manner that allows for prolonged T-cell survival, either by preventing exhaustion or asymmetrically preventing an antitransgene rejection response of host T cells. Both possibilities are the subject of ongoing studies in our laboratories.
Caution should be exercised when interpreting these results, because the intervention with tocilizumab and/or dexamethasone occurred after the clinical signs of CAR T-cell expansion were evident. It is unknown how these agents would impact CAR T-cell activation and proliferation if given prior to the onset of symptoms when transferred CAR T cells are in their initial phase of in vivo activation and proliferation. Tocilizumab was given prophylactically in 1 study of axicabtagene ciloleucel in patients with diffuse large B-cell lymphoma, and it was found to decrease the rates of sCRS but increase the rates of neurotoxicity.27 To our knowledge, there has not been any previous study dosing corticosteroids in a preemptive manner during the early phases of CRS.
The EI strategy described here is being systematically applied to a larger cohort of subjects receiving SCRI-CAR19v1 on our multisite PLAT-02 phase 2 arm. Optimal immunomodulatory treatment remains to be defined and could build upon the findings presented here. With the availability of a growing number of pharmaceuticals that affect the cytokines, receptors, and kinases that mediate CRS, additional efforts to diminish the incidence and severity of CRS are warranted. Despite progress with CRS, significant challenges exist in understanding the mechanisms and, hence, the management of neurotoxicity.7,8,28 As the field contemplates CAR T-cell immunotherapy earlier after diagnosis to reduce the reliance on cytotoxic therapies, the therapeutic index will need to be optimized, and uniform strategies will need to be applied.
For original data, please contact Rebecca Gardner (rebecca.gardner@seattlechildrens.org).
The online version of this article contains a data supplement.
The publication costs of this article were defrayed in part by page charge payment. Therefore, and solely to indicate this fact, this article is hereby marked “advertisement” in accordance with 18 USC section 1734.
Acknowledgments
This work was supported in part by a Stand Up to Cancer and St. Baldrick’s Pediatric Dream Team Translational Research Grant (SU2C-AACR-DT1113), National Institutes of Health, National Cancer Institute R01 CA136551-05, Alex’s Lemonade Stand Phase I/II Infrastructure Grant, a Conquer Cancer Foundation Career Development Award, the Washington State Life Sciences Discovery Fund, the Ben Towne Foundation, the William Lawrence & Blanche Hughes Foundation, and Juno Therapeutics, Inc., a Celgene company.
Authorship
Contribution: R.A.G., J.R.P., and M.C.J. designed, conducted, and analyzed the study and wrote the manuscript; F.C. analyzed the study and wrote the manuscript; D.H.L. analyzed the data and wrote the manuscript; J.R., C.S., A.T., J.G., C.A., K.J.L., K.T., and T.M.C. conducted the study and reviewed the manuscript; and O.C.F. and H.B. conducted and analyzed the study and reviewed the manuscript.
Conflict-of-interest disclosure: T.M.C. has a family member who is an employee of and has an equity interest in Juno Therapeutics, Inc., a Celgene company. D.H.L. is an employee of and has an equity interest in Juno Therapeutics, Inc., a Celgene company. M.C.J. has received consulting fees and grants from and is an inventor on patents licensed to Juno Therapeutics, Inc., a Celgene company. Seattle Children’s Hospital received funds from Juno Therapeutics, Inc., a Celgene company. The remaining authors declare no competing financial interests.
Correspondence: Rebecca A. Gardner, Cancer and Blood Disorders Center, Seattle Children’s Hospital, 4800 Sand Point Way NE, Seattle, WA 98105; e-mail: rebecca.gardner@seattlechildrens.org.

This feature is available to Subscribers Only
Sign In or Create an Account Close Modal