

Key Points
Loss of the N terminus of GATA1, associated with DBA, alters gene regulation through differential chromatin occupancy and modifications.
Erythropoiesis in Gata1s mutant embryos can be rescued by haploinsufficiency for Gata2.

Abstract
Mutations in GATA1, which lead to expression of the GATA1s isoform that lacks the GATA1 N terminus, are seen in patients with Diamond-Blackfan anemia (DBA). In our efforts to better understand the connection between GATA1s and DBA, we comprehensively studied erythropoiesis in Gata1s mice. Defects in yolks sac and fetal liver hematopoiesis included impaired terminal maturation and reduced numbers of erythroid progenitors. RNA-sequencing revealed that both erythroid and megakaryocytic gene expression patterns were altered by the loss of the N terminus, including aberrant upregulation of Gata2 and Runx1. Dysregulation of global H3K27 methylation was found in the erythroid progenitors upon loss of N terminus of GATA1. Chromatin-binding assays revealed that, despite similar occupancy of GATA1 and GATA1s, there was a striking reduction of H3K27me3 at regulatory elements of the Gata2 and Runx1 genes. Consistent with the observation that overexpression of GATA2 has been reported to impair erythropoiesis, we found that haploinsufficiency of Gata2 rescued the erythroid defects of Gata1s fetuses. Together, our integrated genomic analysis of transcriptomic and epigenetic signatures reveals that, Gata1 mice provide novel insights into the role of the N terminus of GATA1 in transcriptional regulation and red blood cell maturation which may potentially be useful for DBA patients.
Introduction
Germline mutations in GATA1 are associated with several benign hematopoietic disorders, including rare forms of dyserythropoietic anemia and thrombocytopenia as well as Diamond-Blackfan anemia (DBA).1 Somatic GATA1 mutations are more commonly seen in the myeloid disorders of Down syndrome, including transient myeloproliferative disorder (TMD) and acute megakaryocytic leukemia.1 The defects in GATA1 fall into 2 categories, including missense mutations that alter residues in the N-terminal zinc finger that reduce DNA binding2,3 or interaction with the essential cofactor FOG14,5 and indels or missense mutations that prevent expression of the full-length protein but allow for expression of shortened isoform named GATA1s.6,7 This isoform lacks 83 amino acids of the N terminus, which was initially described as a transcriptional activation domain.8 These latter mutations are the type observed in DBA, TMD, and Down syndrome-acute megakaryocytic leukemia.
Prior studies revealed that mice expressing only GATA1s develop a transient expansion of megakaryocytes with impaired erythropoiesis during embryonic hematopoiesis, which resembles TMD.9,10 These studies, coupled with the features of patients with GATA1s mutations, suggest that the N terminus of GATA1 is needed for proper development of both erythroid cells and megakaryocytes. Nevertheless, the specific defects in erythroid cells and the mechanistic basis for the phenotype have been unclear.
To understand how the N terminus of GATA1 regulates erythropoiesis and contributes to DBA, we performed an in-depth analysis of Gata1s mutant mice. We also leveraged cleavage under targets and release using nuclease-sequencing (CUT&RUN-seq), assay for transposase-accessible chromatin-sequencing (ATAC-seq), and RNA-sequencing (RNA-seq) to delve into the differences in transcriptional activity of GATA1 and GATA1s in erythroid progenitors. We discovered that GATA1s binds to many of the same sites as GATA1, but its binding is associated with aberrant trimethylation of H3K27, which leads to overexpression of genes that impair erythropoiesis such as Gata2 and Runx1. We demonstrated GATA2 involvement in the erythroid defect as haploinsufficiency of Gata2 rescued the erythroid defects of Gata1s mice, indicating that the N terminus is required for proper control of gene expression and maturation of developing red blood cells.
Materials and methods
Animals
Gata1Δex2 mice (referred to as Gata1s or G1s here), which have a deletion of exon 2 that results in unique expression of GATA1s, and Gata2het mice, which are haploinsufficient for Gata2, were provided by Stuart Orkin (Children’s Hospital, Boston, MA).9,11 Animal studies were approved by the Northwestern University and Chaim Sheba Medical Center at Tel Hashomer Institutional Animal Care and Use Committees.
Cell line culture
G1-ER cells12 were cultured in Iscove modified Dulbecco medium containing 15% (v/v) heat-inactivated fetal calf serum (Gibco, 10438-026), erythropoietin (EPO) 2 U/mL (Janssen), and kit-ligand conditioned medium. To induce activation of GATA1, cells were cultured in the presence of 20 nM β-estradiol (Sigma, E8875).
RNA-seq
Erythroblasts were sorted directly into TRIzol reagent (Invitrogen, 15596026), and RNA was extracted following manufacturer’s instructions. RNA quality was determined with the Agilent Bioanalyzer 2100, accepting RNA integrity numbers >7 and quantified using Qubit. Directional messenger RNA (mRNA) libraries were prepared using the Illumina TruSeq mRNA Sample Preparation Kit. Briefly, polyadenylated mRNAs were captured from total RNA using oligo-dT selection. Next, samples were converted to complementary DNA (cDNA) by reverse transcription, and each sample was ligated to Illumina sequencing adapters containing unique barcode sequences. Barcoded samples were then amplified by polymerase chain reaction (PCR) and the resulting cDNA libraries were quantified using quantitative PCR (qPCR). Last, equimolar concentrations of each cDNA library were pooled and sequenced on the Illumina HiSeq2500. Sequencing data were analyzed using the protocol by Anders et al.13 Briefly, raw reads were aligned by TopHat214 to the mouse reference genome UCSC mm10. Aligned reads were counted by HTSeq.15 Data normalization and differential gene expression were done by DESeq2.16 Clustering and principal component analysis (PCA) were performed in MATLAB. Gene set enrichment analysis (GSEA)17 was used to find groups of enriched genes between different groups of samples.
CUT&RUN-seq
Experiments were performed as described.18 Details are provided in the supplemental Materials and methods, available on the Blood Web site.
ATAC-seq
A total of 40 000 erythroblasts were sorted and ATAC-seq libraries were prepared as previously described.19,20 Details are provided in the supplemental Materials and methods.
RT-qPCR
RNA was extracted using TRIzol reagent (Invitrogen, 15596026). Reverse transcription was performed with SuperScript IV VILO Master Mix with ezDNase Enzyme kit (Invitrogen, 11766050). Real-time PCR was carried out with Perfecta SYBR green SuperMix with low ROX (Quanta Biosciences, 95056-500) on Applied Biosystems Fast 7500. Primers included Gata2 forward 5′-CACCCCTAAGCAGAG AAGCAA-3′, Gata2 reverse 5′-TGGCACCACAGTTGACACACT-3′, Gapdh forward 5′-GATGCCCCCATGTTTGTGAT-3′, and Gapdh reverse 5′-GGTCATGAGCCC TTCCACAAT-3′.
Colony-forming unit assays
For the assays in Figure 7, 10 000 E12.5 fetal liver cells were cultured in methylcellulose-based medium M3334 (Stemcell Technologies, 03334) supplemented with EPO. After 7 to 10 days of culture, BFU-E colonies were counted under microscope based on morphology. Benzidine staining was performed on E12.5 fetal liver cells and burst-forming unit-erythroid (BFU-E) colonies as described in Huo et al.21 For the assay in supplemental Figure 1, fetal liver cells from E13.5 embryos were suspended in sterile fluorescence-activated cell sorter buffer (1× phosphate-buffered saline, 0.5% bovine serum albumin, 2 mM EDTA), stained with biotin conjugated Ter119 antibody (eBioscience, 13-5921-85) for 15 minutes on ice. After washing away unbound antibody, streptavidin magnetic beads (BD Biosciences, 557812) were added and incubated for 15 minutes on ice. Ter119− cells were then collected from the supernatant. A total of 30 000 Ter119− cells were cultured in methylcellulose-based medium M3436 (Stemcell Technologies, 03436). After 7 days of culture, BFU-E colonies were counted under a microscope based on morphology. For colony-forming unit erythroid (CFU-E) assay, 20 000 Ter119− E13.5 fetal liver cells were cultured in methylcellulose-based medium M3334 and CFU-E colonies were counted under microscope based on morphology after 24 hours of culture.
Statistical analysis
All statistical analysis was performed with GraphPad Prism. For quantitative assays, different genotypes were reported as mean ± standard deviation (SD) and compared using the unpaired Student t test. P ≤ .05 was considered statistically significant.
Results
The N terminus of GATA1 is required for murine embryonic erythropoiesis
Gata1s (G1s) mice were engineered to express the short isoform of GATA1 in place of the full-length protein.9 Differential expression was confirmed by western blot (Figure 1A). Next, we performed a detailed characterization of embryonic hematopoiesis. We initially assayed yolk sac hematopoiesis, which is the first site of blood formation during mouse ontogeny.22 Yolk sac cells were isolated from E9.5 embryos, immunostained, and analyzed by flow cytometry for c-kit and Ter119 expression, an erythroid antigen expressed from early proerythroblasts to mature erythrocytes. Compared with wild-type (WT), the yolk sacs of Gata1s embryos harbored very few Ter119+ erythroid cells (Figure 1B-C). Because erythroid cells and megakaryocytes are derived from a common progenitor23 and because GATA1 plays important roles in both lineages, we next analyzed megakaryocyte lineage by staining for CD41, which is expressed in embryos in megakaryocytes and early progenitors.24,25 This staining revealed a striking increase in the megakaryocyte population but no significant change in erythro-myeloid progenitors (EMPs)26 (Figure 1C-D). These results reveal that there is a prominent defect in erythropoiesis at the yolk sack stage of development.
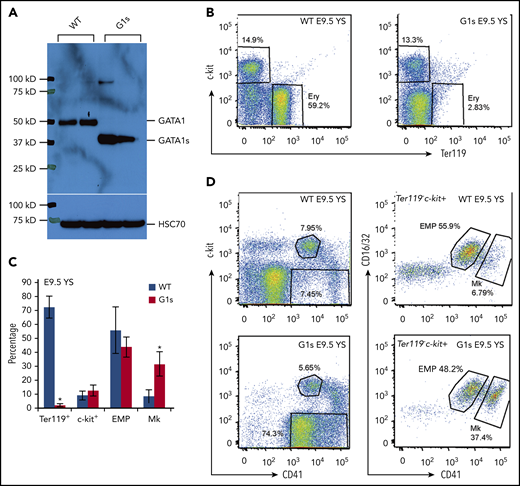
Impaired yolk sac erythropoiesis in Gata1s embryos. (A) Western blot to detect the expression of GATA1 full length (GATA1) in WT embryos and the short isoform (GATA1s) in Gata1s mutant embryos (G1s). Cell lysates were extracted from E13.5 total fetal liver cells. Heat shock protein family A member 8 (HSC70) is shown as a loading control. (B) Flow cytometry assessment of the erythroid (Ery) population in E9.5 yolk sac (YS) using double-staining with antibodies against c-kit and Ter119. (C) Bar graph depicting mean (± SD) percentages of Ter119 positive, c-kit positive, EMP) and megakaryocyte (Mk) populations from yolk sacs of E9.5 WT and G1s as determined by flow cytometry. N ≥ 3. (D) Representative flow cytometry plots of EMPs and Mk stained with antibodies against c-kit, CD16/32 (FcγRIII and II), Ter119, and CD41. *P ≤ .05 (unpaired Student t test).
Impaired yolk sac erythropoiesis in Gata1s embryos. (A) Western blot to detect the expression of GATA1 full length (GATA1) in WT embryos and the short isoform (GATA1s) in Gata1s mutant embryos (G1s). Cell lysates were extracted from E13.5 total fetal liver cells. Heat shock protein family A member 8 (HSC70) is shown as a loading control. (B) Flow cytometry assessment of the erythroid (Ery) population in E9.5 yolk sac (YS) using double-staining with antibodies against c-kit and Ter119. (C) Bar graph depicting mean (± SD) percentages of Ter119 positive, c-kit positive, EMP) and megakaryocyte (Mk) populations from yolk sacs of E9.5 WT and G1s as determined by flow cytometry. N ≥ 3. (D) Representative flow cytometry plots of EMPs and Mk stained with antibodies against c-kit, CD16/32 (FcγRIII and II), Ter119, and CD41. *P ≤ .05 (unpaired Student t test).
We next compared fetal liver hematopoiesis at E12.5 between WT and Gata1s embryos. Similar to published reports,9,10 we observed several significant defects that include a general reduction in the numbers of erythroblasts. Using CD71 and Ter119 double-staining strategy to distinguish different stages of erythroid differentiation,27 we observed a striking decrease in maturing erythroid cells (R3-R5, CD71hi-negTer119hi) along with an accumulation of less mature erythroid cells (R1 and R2, CD71hiTer119neg-low) in Gata1s embryos (supplemental Figure 1A-B). Moreover, the increase of CD41+CD42neg-hi cells was consistent with the observation of expansion of megakaryocyte lineage in the E9.5 yolk sac9 (supplemental Figure 1C). Of note, erythropoiesis improved in Gata1s embryos by E13.5, but nevertheless the changes remained significantly different from WT fetal livers (supplemental Figure 1D-G). Although the percentage of R1-3 erythroblasts from Gata1s fetal liver was comparable to WT on E13.5, there were significantly fewer cells per fetal liver as compared with WT (supplemental Figure 1F). Furthermore, colony forming unit assays using Ter119-depleted fetal liver cells from E13.5 embryos showed a modest decline in BFU-E, and a significant decrease in CFU-E colonies (supplemental Figure 1H-I). Gata1s derived CFU-E colonies were also smaller than WT (supplemental Figure 1J).
Comparison of transcriptomes of Gata1s and WT embryonic erythroblasts reveals dysregulation of erythroid lineage genes
GATA1 is a key regulator of erythroid and megakaryocytic gene expression. To investigate the dysregulated genes of erythropoiesis in Gata1s mice, we performed RNA-seq of purified embryonic erythroid cell populations. We collected CD71hiTer119neg-low (R1/2, less mature) and CD71hiTer119hi (R3, more mature) erythroblasts from both E12.5 and E14.5 fetal livers and then purified mRNA for next-generation sequencing. As seen by PCA, WT R1/2, WT R3, G1s R1/2, and G1s R3 samples clustered separately from one another (Figure 2A). Of note, however, within the groups, E12.5 and E14.5 samples were closely aligned. By GSEA analysis, we made a number of observations. First, not surprisingly, the absence of the N terminus of GATA1 resulted in the dysregulation of GATA1 target genes (WELCH GATA1 target gene set; Figure 2B). The analysis also revealed that gene signatures associated with heme metabolism and hematopoietic cell maturation negatively correlated with the transcriptional signature of Gata1s cells (Figure 2B). Moreover, Gata1s transcriptional signature is enriched with megakaryocytic pathways (GNATENKO_Platelet signature; Figure 2B). Consistent with these pathways, we observed reduced expression of genes involved in red blood cell differentiation, including Klf1, Zfpm1, Lmo2, and Ldb1, in R3 Gata1s erythroid cells as compared with WT cells (Figure 2C). These findings reveal that the N terminus of GATA1 is critical for erythroid differentiation by precise regulation of transcription of erythroid lineage genes.
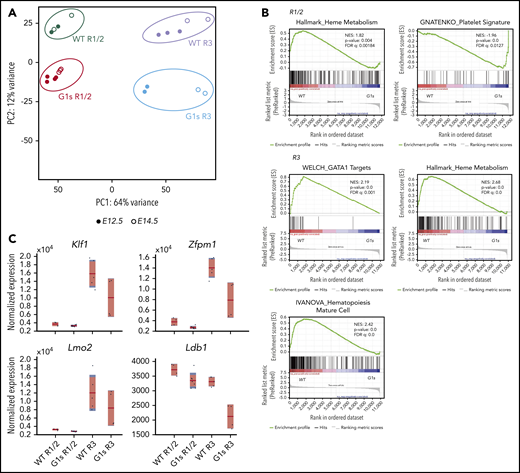
Dysregulation of gene expression in Gata1s mutant erythroid cells. (A) PCA of global gene expression changes as determined by RNA-seq of R1/2- and R3-sorted erythroblasts from WT and G1s at days E12.5 (●) and E14.5 (○). (B) GSEA of differentially expressed genes in WT R1/2 vs G1s R1/2, or WT R3 vs G1s R3 erythroid cells. NES, normalized enrichment score; FDR, false discovery rate. (C) Boxplots showing the normalized expression of selected erythroid lineage genes from the RNA-seq. The red horizontal line indicates the mean normalized expression, the light red box represents the 95% confidence interval for the mean, and the blue box represents ± 1 SD.
Dysregulation of gene expression in Gata1s mutant erythroid cells. (A) PCA of global gene expression changes as determined by RNA-seq of R1/2- and R3-sorted erythroblasts from WT and G1s at days E12.5 (●) and E14.5 (○). (B) GSEA of differentially expressed genes in WT R1/2 vs G1s R1/2, or WT R3 vs G1s R3 erythroid cells. NES, normalized enrichment score; FDR, false discovery rate. (C) Boxplots showing the normalized expression of selected erythroid lineage genes from the RNA-seq. The red horizontal line indicates the mean normalized expression, the light red box represents the 95% confidence interval for the mean, and the blue box represents ± 1 SD.
The N terminus of GATA1 is required for chromatin occupancy and transcriptional regulation of a subset of target genes
To further study the role of the N terminus of GATA1 in transcription, we compared chromatin occupancy of GATA1s vs GATA1 and evaluated chromatin accessibility in E13.5 R1/2 and R3 WT and G1s erythroblasts by performing CUT&RUN-seq and ATAC-seq, respectively.18,28 GATA1s had a similar occupancy on 79 910 sites genome-wide, whereas there were 3268 and 576 sites that lost or gained GATA1s binding, respectively (Figure 3A). Correspondingly, 329 sites (140 genes) gained GATA1s binding and chromatin accessibility, and 1844 sites (791 genes) lost GATA1s binding as well as chromatin accessibility compared with WT erythroid cells (Figure 3B). The altered sites were seen largely in gene body and intergenic regions (Figure 3C). DNA-binding motif analysis of the differentially bound loci revealed that the absence of the N terminus not only attenuated the binding to GATA motifs, but led to a gain in occupancy on many sites associated with other transcription factors such as NF-E2 and BACH1/2 (Figure 3D-E). This finding suggests that the differential GATA1/1s bound genes may also be coregulated by those transcriptional factors. The 140 gained genes were enriched in Hallmark_MTORC1 Signaling,29,30 Hallmark_Hypoxia,31,32 Hallmark_IL2 STAT5_Signaling,33-35 Hallmark_UV Response DN, and Reactome_Immune System (supplemental Figure 2). The 791 lost genes were enriched in Hallmark_Heme Metabolism,36,37 Hallmark_Mitotic Spindle, Hallmark_G2M Checkpoint, Reactome_Cell Cycle Mitotic,38,39 and Reactome_Developmental Biology (supplemental Figure 2). There was a strong overlap with the GSEA results of the RNA-seq experiment (Figure 2B; supplemental Figure 3). Two megakaryocytic genes, Fli1 and Mef2c, were among the genes that gained GATA1s occupancy and chromatin accessibility (Figure 3B). On the other hand, 2 erythroid genes, Lmo2 and Zfpm1, were deficient for GATA1s binding, and they were downregulated as seen in the RNA-seq experiment (Figures 2C and 3B). Together, the absence of the N terminus of GATA1 results in the dysregulation of many megakaryocytic and erythroid lineage genes during erythropoiesis.
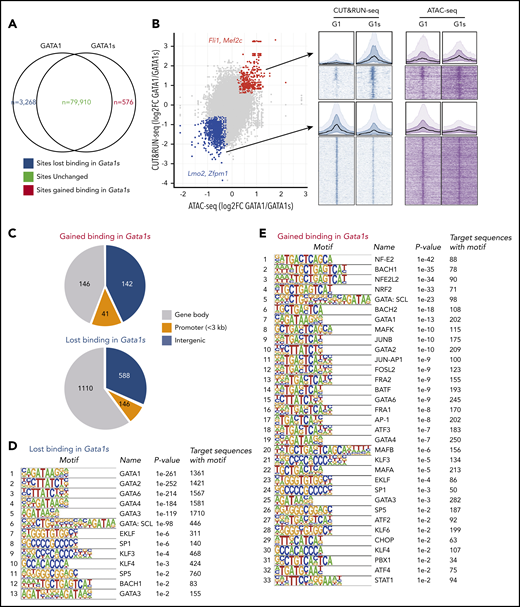
Loss of the N terminus of GATA1 alters its chromatin occupancy. (A) Venn diagram showing the numbers of binding sites of GATA1 full-length vs GATA1s in E13.5 erythroid cells as determined by CUT&RUN-seq of the endogenous GATA1 proteins. The absence of the N terminus did not alter binding to 79 910 sites (gray), but resulted in gain of GATA1s binding on 576 sites (red) and decreased GATA1s binding on 3268 sites (blue). (B) Integration of CUT&RUN-seq and ATAC-seq data highlights changes in occupancy and accessibility. A total of 329 of the 576 gained sites (red; eg, Fli1 and Mef2c loci) also gained chromatin accessibility, whereas 1844 sites (blue) that lost binding (eg, Lmo2 and Zfpm1 loci) also showed reduced chromatin accessibility. Aggregated binding signals are shown above the heatmaps for gained and lost sites by CUT&RUN-seq and ATAC-seq, respectively. (C) Pie charts showing the distribution of sites that were gained or lost by GATA1s. The rank lists of binding motifs of sites that lost (D) or gained (E) binding of GATA1s.
Loss of the N terminus of GATA1 alters its chromatin occupancy. (A) Venn diagram showing the numbers of binding sites of GATA1 full-length vs GATA1s in E13.5 erythroid cells as determined by CUT&RUN-seq of the endogenous GATA1 proteins. The absence of the N terminus did not alter binding to 79 910 sites (gray), but resulted in gain of GATA1s binding on 576 sites (red) and decreased GATA1s binding on 3268 sites (blue). (B) Integration of CUT&RUN-seq and ATAC-seq data highlights changes in occupancy and accessibility. A total of 329 of the 576 gained sites (red; eg, Fli1 and Mef2c loci) also gained chromatin accessibility, whereas 1844 sites (blue) that lost binding (eg, Lmo2 and Zfpm1 loci) also showed reduced chromatin accessibility. Aggregated binding signals are shown above the heatmaps for gained and lost sites by CUT&RUN-seq and ATAC-seq, respectively. (C) Pie charts showing the distribution of sites that were gained or lost by GATA1s. The rank lists of binding motifs of sites that lost (D) or gained (E) binding of GATA1s.
Gata1s erythroid cells are characterized by dysregulation of global H3K27 methylation
Given the striking differences in gene expression in Gata1s erythroid cells, we next investigated whether there were global differences in histone modifications in Gata1s vs WT cells. By western blot, we observed a differentiation dependent decrease of global trimethylation at histone H3 lysine 27 (H3K27), but no change of trimethylation at lysine 9 (H3K9) (Figure 4A). The downregulation of global H3K27me3 during maturation of red blood cells was also confirmed in the system of β-estradiol-induced G1-ER cell differentiation (Figure 4B).
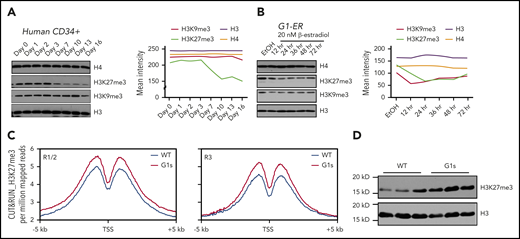
Perturbed H3K27 methylation in Gata1s mutant erythroid cells. (A) Western blot depicting the levels of H3K27me3 and H3K9me3 at different days of erythroid cell maturation from human CD34 cells. Total H3 and total H4 are shown as loading controls. The intensity of the bands was measured with ImageJ (right). (B) H3K27me3 and H3K9me3 levels were assayed in G1-ER cells at different time points following induction of differentiation by 20 nM β-estradiol. The intensity of the bands was measured with ImageJ (right). (C) Metaplots of H3K27me3 CUT&RUN signal comparing WT and Gata1s E13.5 erythroid cells plotted across a 10-kb window; the y-axis indicates depth per million mapped reads. (Left) R1/R2 population; (right) R3 population. (D) Western blot of the levels of H3K27me3 in fetal liver cells from WT and Gata1s E13.5 embryos.
Perturbed H3K27 methylation in Gata1s mutant erythroid cells. (A) Western blot depicting the levels of H3K27me3 and H3K9me3 at different days of erythroid cell maturation from human CD34 cells. Total H3 and total H4 are shown as loading controls. The intensity of the bands was measured with ImageJ (right). (B) H3K27me3 and H3K9me3 levels were assayed in G1-ER cells at different time points following induction of differentiation by 20 nM β-estradiol. The intensity of the bands was measured with ImageJ (right). (C) Metaplots of H3K27me3 CUT&RUN signal comparing WT and Gata1s E13.5 erythroid cells plotted across a 10-kb window; the y-axis indicates depth per million mapped reads. (Left) R1/R2 population; (right) R3 population. (D) Western blot of the levels of H3K27me3 in fetal liver cells from WT and Gata1s E13.5 embryos.
We performed CUT&RUN-seq to compare the global trimethylation of H3K27 in erythroid cells from WT and Gata1s E13.5 embryos. We observed a much higher degree of H3K27me3 genome wide in both the R1/R2 and R3 populations from Gata1s mice (Figure 4C). Next, using western blot analysis to compare the levels of H3K27me3 in the fetal liver cells from WT and Gata1s E13.5 embryos, we observed a striking increase in H3K27me3 in the mutant cells (Figure 4D).
Integrated analysis of changes in H3K27 trimethylation and differences in gene expression between WT and Gata1s erythroblasts returned a set of 123 overlapping genes. Gene ontology analysis of these genes revealed that chromatin modification and chromatin organization were among the most significantly enriched pathways (supplemental Figure 4). Of note, 75 of 123 genes belong to the chromatin modification pathway, which further suggests that alterations in chromatin are a major pathway involved in the Gata1s pathogenesis.
Retention of GATA1s at the Runx1 promoter correlates with elevated expression of RUNX1 in erythroid cells
In addition to the impaired expression of erythroid genes, the RNA-seq data showed that megakaryocyte lineage genes, such as Itga2b, Fli1, and Runx1, were upregulated in Gata1s erythroid cells (Figure 5A). RUNX1 is notable because prior studies have implicated it in balancing megakaryocyte and erythroid lineage specification through 2 downstream transcriptional factors, FLI1 and KLF1.40 RUNX1 has been found to activate Fli1 in megakaryocytes, but also to repress Klf1 via recruitment of EZH2.40 Western blot and intracellular immunostaining followed by flow cytometry confirmed the upregulation of RUNX1 at the protein level in Gata1s erythroid cells (Figure 5B-C). Combined with megakaryocyte or erythroid cell surface makers, we assayed the dynamic changes in RUNX1 protein levels during megakaryocyte or erythroid cell development. RUNX1 expression decreased during erythropoiesis, but increased during megakaryocyte maturation in the WT setting (Figure 5D-E). By contrast, RUNX1 was highly expressed throughout erythropoiesis in Gata1s mice. This persistent expression was associated with increased chromatin accessibility and reduced H3K27me3 in the R3 population of erythroblasts (Figure 5F). This result is at odds with the increased global methylation at H3K27, suggesting that there are distinct mechanisms that regulate expression of Runx1 expression.
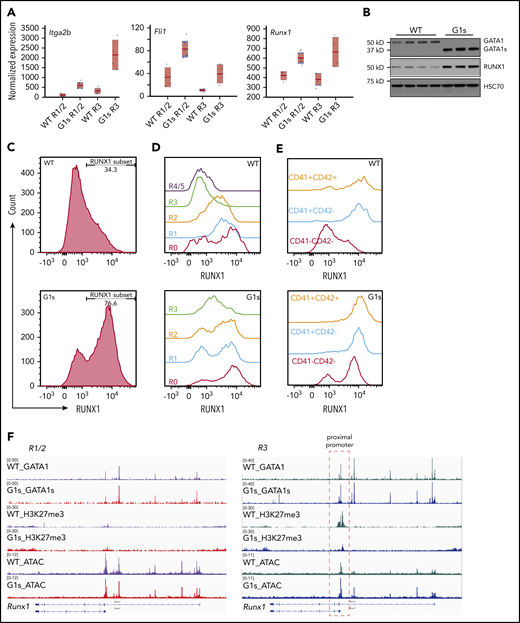
RUNX1 expression is aberrantly elevated in Gata1s erythroid cells. (A) Boxplots depicting the normalized expression of selected megakaryocyte lineage genes as determined by RNA-seq. The red horizontal line indicates the mean normalized expression, the light-red box represents the 95% confidence interval for the mean, and the blue box represents ± 1 SD. (B) Western blot of GATA1/GATA1s, RUNX1, and HSC70 in WT and G1s erythroid cells. Cell lysates were extracted from E13.5 total fetal liver cells. Each lane represents a different embryo. HSC70 is provided as a loading control. Fetal liver cells were isolated from E12.5 embryos and stained with erythroid surface markers (CD71 and Ter119) or megakaryocyte surface markers (CD41 and CD42), then assessed for RUNX1 expression by intracellular flow cytometry. Data from total fetal liver cells (C), individual stages of erythropoiesis (R0-R4/5) (D), and megakaryocytes (CD41−CD42− > CD41+CD42− > CD41+CD42+) (E) are shown. (F) Tracks of CUT&RUN-seq data corresponding to GATA1, GATA1s, and H3K27me3 as well as ATAC-seq at the Runx1 locus. Histograms were normalized to account for differences in the number of reads per library. The red dashed box (right) highlights the changes in recruitment of H3K27me3 and differential chromatin accessibility (ATAC-seq) at GATA1/GATA1s binding sites in the Runx1 proximal promoter.
RUNX1 expression is aberrantly elevated in Gata1s erythroid cells. (A) Boxplots depicting the normalized expression of selected megakaryocyte lineage genes as determined by RNA-seq. The red horizontal line indicates the mean normalized expression, the light-red box represents the 95% confidence interval for the mean, and the blue box represents ± 1 SD. (B) Western blot of GATA1/GATA1s, RUNX1, and HSC70 in WT and G1s erythroid cells. Cell lysates were extracted from E13.5 total fetal liver cells. Each lane represents a different embryo. HSC70 is provided as a loading control. Fetal liver cells were isolated from E12.5 embryos and stained with erythroid surface markers (CD71 and Ter119) or megakaryocyte surface markers (CD41 and CD42), then assessed for RUNX1 expression by intracellular flow cytometry. Data from total fetal liver cells (C), individual stages of erythropoiesis (R0-R4/5) (D), and megakaryocytes (CD41−CD42− > CD41+CD42− > CD41+CD42+) (E) are shown. (F) Tracks of CUT&RUN-seq data corresponding to GATA1, GATA1s, and H3K27me3 as well as ATAC-seq at the Runx1 locus. Histograms were normalized to account for differences in the number of reads per library. The red dashed box (right) highlights the changes in recruitment of H3K27me3 and differential chromatin accessibility (ATAC-seq) at GATA1/GATA1s binding sites in the Runx1 proximal promoter.
Impaired GATA switching in Gata1s erythroid cells
GATA2 expression is required for hematopoietic stem and progenitor cells but is downregulated during terminal maturation of erythroid cells. In our analysis of RNA-seq data, we noted that Gata2 levels were substantially higher in Gata1s erythroid cells than WT cells, especially in the R3 subset where GATA2 expression is typically very low (Figure 6A). We confirmed this upregulation at the mRNA level by reverse transcriptase qPCR (RT-qPCR), using fetal liver cells from E13.5 Gata1s and WT embryos (Figure 6B).
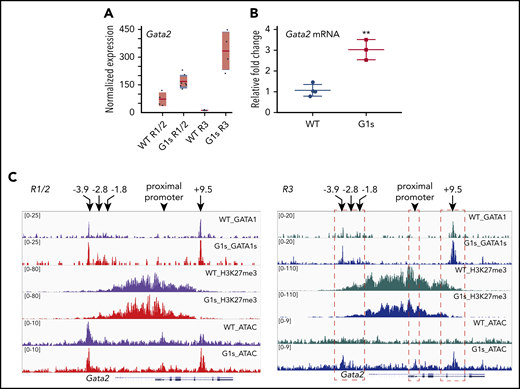
GATA2 is overexpressed in Gata1s erythroid cells. RNA-seq (A) and RT-qPCR (B) confirming the increased expression of GATA2 in G1s erythroid cells. Total mRNA was extracted from E13.5 fetal liver cells for RT-qPCR. (C) Tracks depicting CUT&RUN-seq of GATA1, GATA1s, and H3K27me3 as well as ATAC-seq at the genomic locus of Gata2 in the R1/2 and R3 populations. Histograms were normalized to account for differences in the number of reads per library. Four well-studied regulatory elements (−3.9 kb, −2.8 kb, −1.8 kb, and +9.5 kb) and the proximal promoter of Gata2 are indicated by arrows. Red dashed boxes (right) highlight the changes in H3K27me3 and differential chromatin accessibility (ATAC-seq) at GATA1/GATA1s-binding sites and the Gata2 proximal promoter. **P ≤ .01 (unpaired Student t test).
GATA2 is overexpressed in Gata1s erythroid cells. RNA-seq (A) and RT-qPCR (B) confirming the increased expression of GATA2 in G1s erythroid cells. Total mRNA was extracted from E13.5 fetal liver cells for RT-qPCR. (C) Tracks depicting CUT&RUN-seq of GATA1, GATA1s, and H3K27me3 as well as ATAC-seq at the genomic locus of Gata2 in the R1/2 and R3 populations. Histograms were normalized to account for differences in the number of reads per library. Four well-studied regulatory elements (−3.9 kb, −2.8 kb, −1.8 kb, and +9.5 kb) and the proximal promoter of Gata2 are indicated by arrows. Red dashed boxes (right) highlight the changes in H3K27me3 and differential chromatin accessibility (ATAC-seq) at GATA1/GATA1s-binding sites and the Gata2 proximal promoter. **P ≤ .01 (unpaired Student t test).
Our finding that GATA2 levels persisted during maturation of Gata1s erythroblasts led us to compare chromatin occupancy of GATA1/GATA1s, chromatin accessibility, and H3K27me3 enrichment along the Gata2 locus (Figure 6C). CUT&RUN-seq revealed that GATA1s bound to the −3.9 kb, −2.8 kb, −1.8 kb, and +9.5 kb sites to a similar degree as full-length GATA1. The 4 sites are well-studied GATA1- and GATA2-bound regulatory sites within the Gata2 locus. GATA2 occupies these regulatory elements in early proliferating erythroid precursors, and is then displaced by GATA1 as erythropoiesis progresses.41,42 This GATA1-mediated displacement of GATA2 from chromatin is termed “GATA switching” and the GATA1- and GATA2-occupied sites are known as GATA switch sites. Furthermore, consistent with the elevated level of expression, GATA switch site regions showed a greater degree of accessibility as assayed by ATAC-seq. This increased accessibility was accompanied by a decrease in the levels of H3K27 trimethylation. Differences were less notable in the R1/2 cells.
Together, although GATA1s binds as well as GATA1 at most of binding sites, the lack of the N terminus alters H3K27 methylation and chromatin accessibility at many loci. Of note, in contrast to the global increase in H3K27m3 seen in Gata1s cells (Figure 4C-D), the Gata2 locus, like that of Runx1 (Figure 5F), showed a striking loss in this repressive mark (Figure 6C).
Haploinsufficiency of Gata2 rescues the defect of fetal erythropoiesis in Gata1s mice
Given that overexpression of GATA2 can block the late differentiation of red blood cells and the increased accessibility of GATA2 locus in G1s erythroid cells at this stage (Figure 6C), we investigated whether downregulation of GATA2 in the Gata1s background could improve erythropoiesis. To test the effect of reduced expression of GATA2 on Gata1s erythropoiesis defect, we crossed Gata1s knock-in mice expressing only GATA1s with Gata2 heterozygous knockout mice (supplemental Figure 5).
The number and functionality of erythroid cells was measured in fetal liver cells from E12.5 male embryos of the 4 genotypes by flow cytometry (Figure 7A-C) and by erythroid colony formation (Figure 7D). Flow cytometry using the erythroid marker Ter119 showed a marked increase in Ter119-expressing cells in Gata1s/Gata2het fetal livers compared with Gata1s/Gata2 (45% compared with 24%, respectively) (Figure 7A-B). Moreover, the ratio of early/late erythrocytes, as measured by the combined expression of Ter119 and CD71, was reduced by twofold from 3.8 in Gata1s/Gata2 to 1.9 in Gata1s/Gata2het fetal liver cells, demonstrating a partial rescue of the erythroid differentiation block (Figure 7C). Furthermore, cells were harvested and cultured in methylcellulose supplemented with EPO. On average, 150 BFU-E colonies were observed in cultures of Gata1s/Gata2het fetal liver cells, compared with 31 from Gata1s/Gata2, demonstrating a fivefold increase in colony number and complete rescue of the erythroid colony formation defect (Figure 7D). To mark hemoglobin-expressing erythroid cells, colonies and fetal liver cells were stained with benzidine. Notably, >40% of fetal liver cells from Gata1s/Gata2het mice were positive for benzidine, whereas <10% of fetal liver cells from Gata1s/Gata2 mice were stained (Figure 7E). Similarly, colonies generated from fetal liver cells showed a rescue phenotype, with significantly more benzidine-stained colonies from Gata1s/Gata2het cultured cells compared with Gata1s/Gata2 (21% compared with 3%, respectively) (Figure 7F). Taken together, reduced expression of GATA2 in Gata1s embryos improved the defect of fetal erythropoiesis by promoting the proliferation of BFU-E progenitors and the maturation of erythroblasts.

Haploinsufficiency of Gata2 improves erythropoiesis in Gata1s embryos. (A) Bar graph depicts the mean percentage of Ter119 expressing fetal liver cells from Gata1/Gata2 (G1/G2), Gata1/Gata2het (G1/G2het), Gata1s/Gata2 (G1s/G2), and Gata1s/Gata2het (G1s/G2het) embryos. (N > 3). (B) Representative flow cytometry plots of CD71/Ter119 erythroid staining of fetal liver cells isolated from male embryos of each genetic background. (C) Bar graph depicting the mean ratio of early erythroblasts (Ter119+/CD71+) vs late differentiated erythroid cells (Ter119+/CD71−) in panel B. (D) E12.5 fetal liver cells were isolated and cultured in methylcellulose medium supplemented with EPO to support erythroid colony formation. Bar graph represents the number of BFU-E of each of the genotypes. Mean ± SD are shown (N = 3). (E) Representative images of fetal liver erythroid cells after benzidine staining. Arrows indicate dark stained hemoglobin-containing cells. Bar graph represents mean number of benzidine stained cells out of the total fetal liver cells counted for each genotype. (F) Representative images of colonies from G1s/G2 and G1s/G2het. A total of 5000 E12.5 fetal liver cells were cultured in methylcellulose supplemented with EPO and colonies were stained with benzidine. Dark staining indicates hemoglobin-containing colonies. Bar graph depicts mean number of benzidine-stained colonies from each genotype. **P ≤ .01, ****P ≤ .0001 (unpaired Student t test). Original magnification ×10 (E) and ×4 (F).
Haploinsufficiency of Gata2 improves erythropoiesis in Gata1s embryos. (A) Bar graph depicts the mean percentage of Ter119 expressing fetal liver cells from Gata1/Gata2 (G1/G2), Gata1/Gata2het (G1/G2het), Gata1s/Gata2 (G1s/G2), and Gata1s/Gata2het (G1s/G2het) embryos. (N > 3). (B) Representative flow cytometry plots of CD71/Ter119 erythroid staining of fetal liver cells isolated from male embryos of each genetic background. (C) Bar graph depicting the mean ratio of early erythroblasts (Ter119+/CD71+) vs late differentiated erythroid cells (Ter119+/CD71−) in panel B. (D) E12.5 fetal liver cells were isolated and cultured in methylcellulose medium supplemented with EPO to support erythroid colony formation. Bar graph represents the number of BFU-E of each of the genotypes. Mean ± SD are shown (N = 3). (E) Representative images of fetal liver erythroid cells after benzidine staining. Arrows indicate dark stained hemoglobin-containing cells. Bar graph represents mean number of benzidine stained cells out of the total fetal liver cells counted for each genotype. (F) Representative images of colonies from G1s/G2 and G1s/G2het. A total of 5000 E12.5 fetal liver cells were cultured in methylcellulose supplemented with EPO and colonies were stained with benzidine. Dark staining indicates hemoglobin-containing colonies. Bar graph depicts mean number of benzidine-stained colonies from each genotype. **P ≤ .01, ****P ≤ .0001 (unpaired Student t test). Original magnification ×10 (E) and ×4 (F).
Discussion
The human GATA1 gene has 2 natural products, full-length GATA1 and GATA1s, the latter of which results from alternative splicing and alternative translation. GATA1 mutations that lead to exclusive production of the GATA1s isoform have been modeled in mice.9 This mouse displays transient expansion of the megakaryocytic lineage and perturbed erythropoiesis during gestation, but no distinguishable phenotypes were reported after birth.9,10 We performed a number of molecular studies to characterize the mechanism by which this Gata1 alteration impairs erythropoiesis. We found that both erythroid and megakaryocytic lineage genes are dysregulated in the absence of N terminus of GATA1. Of note, a critical defect of Gata1s mutant erythroid cells is aberrant upregulation of GATA2. We observed phenotypic rescue of erythropoiesis by reducing the dosage of GATA2 to heterozygosity in G1s embryos. Consistent with this rescue, a number of prior studies have shown that increased GATA2 blocks erythropoiesis. Although GATA2 is dispensable for terminal differentiation of erythroid cells,43 overexpression of GATA2 maintains erythroblasts in a self-renewing state and blocks erythroid differentiation in a dose-dependent manner.44,45
GATA1 acts as both activator and suppressor depending on its cofactors (eg, NuRD, MeCP1, and PCR2 complexes),46-51 suggesting that lineage-specific GATA1 cofactor associations by N terminus of GATA1 are essential for epigenetic programming, transcriptional regulation, and differentiation. We discovered that the absence of the N terminus of GATA1 reduced its binding at erythroid genes (eg, Lmo2 and Zfpm1), but enhanced its binding activity at some megakaryocytic genes (eg, Fli1 and Mef2c). Of note, 2 prior studies compared the chromatin occupancy of GATA1 and GATA1s in the G1ME cell line,52 which can differentiate into erythroid cells or megakaryocytes. These studies concluded that GATA1s occupancy was reduced at a number of erythroid specific genes but not altered at megakaryocytic genes.53,54 This impaired chromatin occupancy was then implicated in the dysregulation of erythroid gene expression and suppression of erythropoiesis. Our results extend the results to primary cells and confirm that there is some degree of differential chromatin occupancy, although the primary deficiency is in the inability of GATA1s to properly control methylation of H3K27 at certain sites.
There have been many reports that describe GATA1 chromatin occupancy in erythroid cells.50,55-57 Among these publications, several have correlated GATA1 binding with epigenetic modifications. For example, Papadopoulos et al reported that GATA1 associates with changes in specific modifications, such as H3K27 acetylation and H3K4 dimethylation.58 By contrast, Cheng et al reported that GATA1 bound target genes tended to have high levels of H3K4 monomethylation and low levels of H3K27 trimethylation, regardless of the expression levels of the genes.57 This latter study is consistent with our global histone modification analysis, which showed that there was a substantial decrease in H3K27 trimethylation in the more differentiated subset of erythroid genes.
A number of elegant studies have described the GATA switch, which is defined as the exchange of GATA2 and GATA1 on regulatory elements of genes that control erythropoiesis, including GATA2 itself.42,59-61 The switch allows GATA1 to repress a number of target genes, such as GATA2. Our CUT&RUN-seq results suggest that the GATA switch is active in Gata1s mutant erythroblasts because we observed that GATA1s bound to Gata2 switch sites to a similar extent as the full-length protein. Nevertheless, the shorter isoform is unable to repress GATA2, which is the most well-studied GATA switch-dependent gene. This persistent GATA2 expression is associated with a reduced degree of trimethylation of H3K27 and gained chromatin accessibility in Gata1s mutant cells compared with WT. One explanation for why GATA2 expression is not downregulated could be that there is impaired recruitment of PRC2 to the Gata2 locus caused by the loss of the GATA1 N terminus. This would be consistent with the previous report that GATA1 binds components of the PRC2 complex46,50 and might explain why the N terminus is critical. However, we failed to detect an interaction between GATA1 and EZH2 or SUZ12 in extracts from erythroid cell lines. Thus, our observations suggest that the N terminus is involved in other mechanisms that drive recruitment of PRC2 to chromatin. For example, differential binding of PRC2 associated RNAs or noncore subunits may be one possibility.62
Therefore, an important question that remains is what features of GATA1’s N terminus are critical for the differential gene regulation that results from its deletion. A recent paper by Liang et al showed that the deubiquitinase USP7 stabilizes GATA1 by removing K48-linked polyubiquitin chains and regulates human terminal erythroid differentiation.63 GATA1s lacks the substrate site of USP7, which suggests that GATA1s may be differentially regulated during erythropoiesis. With respect to protein partners, few factors that bind to the N terminus have been described. One report showed that Rb interacts with GATA1 at the LNCME motif within the N terminus.64 Loss of the interaction 'with Rb may partially explain the impaired erythropoiesis in Gata1s embryos, but does not inform about differences in chromatin occupancy or histone modifications. Therefore, further identification of factors whose binding depends on the N terminus of GATA1 or residues in the N terminus whose modification regulate GATA1 function will shed further light on the mechanism by which GATA1 mutations cause hematologic diseases.
CUT&RUN-seq, ATAC-seq, and RNA-seq datasets have been deposited in the Gene Expression Omnibus database (accession number GSE130156).
For original data, please contact the corresponding authors at jcrispino@northwestern.edu or sizraeli@gmail.com.
The online version of this article contains a data supplement.
The publication costs of this article were defrayed in part by page charge payment. Therefore, and solely to indicate this fact, this article is hereby marked “advertisement” in accordance with 18 USC section 1734.
Acknowledgments
The next-generation sequencing reactions were performed by the Northwestern University NGS Core Facility. The authors also thank Steven Henikoff (Fred Hutchinson Cancer Research Center, Seattle, WA) for providing CUT&RUN protocol and related reagents and Itamar Kanter for contributing to RNA-seq data analysis.
This work was supported by the National Institutes of Health, National Institute of Diabetes and Digestive and Kidney Diseases (DK101329), the Samuel Waxman Cancer Research Foundation, the US Department of Defense (W81XWH-15-1-0227) (S.I.), the Israel US Binational Science Foundation, the DBA Foundation, the European Hematology Association, the Larger than Life Foundation, the Israel Science Foundation (ICORE 1902/12 and grants 1634/13 and 2017/13), the Israel Cancer Association (grant 20150911), the Israel Ministry of Health (grant 3-10146), an Israel Ministry of Science-DKFZ grant, and the EU-FP7 (Marie Curie International Reintegration Grant, 618592).
Authorship
Contribution: T.L., Y.B., M.J.S., W.C., C.F., E.K., K.Z., H.P., J.W.S., and Y.A.G. performed the experiments, analyzed the data, interpreted the results, and contributed to writing the manuscript; N.B.-H., T.K., A.R., N.K., and L.Z. analyzed the data, interpreted the results, and contributed to writing the manuscript; and S.I. and J.D.C. designed the experiments, analyzed the data, interpreted the results, and contributed to writing the manuscript.
Conflict-of-interest disclosure: J.D.C. receives research funding from Scholar Rock and Forma Therapeutics and is a consultant for Sierra Oncology. S.I. is a consultant of SIGHTDX. The remaining authors declare no competing financial interests.
Correspondence: John D. Crispino, Northwestern University, 303 East Superior St, Lurie 5-123, Chicago, IL 60611; e-mail: j-crispino@northwestern.edu; and Shai Izraeli, Division of Pediatric Hematology and Oncology, Schneider Children’s Hospital of Israel, Petach Tikva 49202, Israel; e-mail: sizraeli@gmail.com.
