

Key Points
We investigated all 3 subtypes of BL by WGS and transcriptome sequencing.
Experimental validation through CRISPR screening and mouse models provides a better functional understanding of BL genetic drivers.

Abstract
Burkitt lymphoma (BL) is an aggressive, MYC-driven lymphoma comprising 3 distinct clinical subtypes: sporadic BLs that occur worldwide, endemic BLs that occur predominantly in sub-Saharan Africa, and immunodeficiency-associated BLs that occur primarily in the setting of HIV. In this study, we comprehensively delineated the genomic basis of BL through whole-genome sequencing (WGS) of 101 tumors representing all 3 subtypes of BL to identify 72 driver genes. These data were additionally informed by CRISPR screens in BL cell lines to functionally annotate the role of oncogenic drivers. Nearly every driver gene was found to have both coding and non-coding mutations, highlighting the importance of WGS for identifying driver events. Our data implicate coding and non-coding mutations in IGLL5, BACH2, SIN3A, and DNMT1. Epstein-Barr virus (EBV) infection was associated with higher mutation load, with type 1 EBV showing a higher mutational burden than type 2 EBV. Although sporadic and immunodeficiency-associated BLs had similar genetic profiles, endemic BLs manifested more frequent mutations in BCL7A and BCL6 and fewer genetic alterations in DNMT1, SNTB2, and CTCF. Silencing mutations in ID3 were a common feature of all 3 subtypes of BL. In vitro, mass spectrometry–based proteomics demonstrated that the ID3 protein binds primarily to TCF3 and TCF4. In vivo knockout of ID3 potentiated the effects of MYC, leading to rapid tumorigenesis and tumor phenotypes consistent with those observed in the human disease.
Introduction
Burkitt lymphoma (BL) is one of the most rapidly proliferating cancers that has been described so far and is characterized by the translocation of the MYC gene to the immunoglobulin heavy or light chain loci resulting in its overexpression. BL has 3 recognized subtypes with distinct clinical presentations and geographic prevalence: sporadic, endemic, and immunodeficiency-associated. BLs were first described in Africa, and endemic BL remains the most common pediatric malignancy in sub-Saharan Africa. Sporadic BL occurs throughout the world, including in the Western Hemisphere. A third subtype occurs in immunodeficient patients, most commonly those with HIV infection.
Here, we applied whole-genome sequencing (WGS) and transcriptome sequencing of 101 tumor-normal pairs to comprehensively investigate the genomic basis of all 3 subtypes of BL. In addition, the role of oncogenic drivers was functionally annotated through CRISPR screens in BL cell lines. Several genes were implicated as being involved in BL tumorigenesis, including IGLL5, BACH2, SIN3A, and DNMT1. Similar genetic profiles were observed in sporadic and immunodeficiency-associated BL. In contrast, endemic BL manifested more frequent mutations in BCL7A and BCL6 and less frequent genetic alterations in DNMT1, SNTB2, and CTCF. Silencing mutations in ID3 were a common feature of all 3 subtypes of BL, as observed previously.1-4 Our in vitro and in vivo experiments confirm a role for ID3 in potentiating the effects of MYC overexpression in tumor proliferation.
Methods
Sample acquisition and processing
All samples were deidentified and processed in accordance with a protocol approved by the Institutional Review Board at Duke University. BL tumor and paired normal samples were collected—60 sporadic, 32 endemic, and 9 HIV—totaling 101 samples, which were used in the study (supplemental Table 1, available on the Blood Web site). The pathology diagnosis of all patients was confirmed by separate review by a panel of qualified pathologists using current World Health Organization criteria. WGS was performed on all tumor-normal pairs, and RNA was available for 82 of the 101 patients.
DNA sequencing analysis
FASTQ files comprising reads from WGS were first tested for quality using FastQC v.0.11.7 (www.bioinformatics.babraham.ac.uk/projects/fastqc). Adaptor sequences and low-quality reads were trimmed using Trimmomatic v.0.36.5 Next, alignment was performed using BWA v.0.7.156 to map reads to the human GRCh38 reference genome. Polymerase chain reaction (PCR) duplicates were marked using Picard v.2.8.2 (http://broadinstitute.github.io/picard/).
Somatic variant identification and filtering
Somatic variant calling was performed with Mutect27 from GATK4 software using the default parameters. The obtained variant call format files were merged and normalized using bcftools and then annotated using Annovar v.2017Jul16.8 Next, the variants were filtered by first considering only the PASS filter in at least 1 sample. We excluded variants that had <3 supporting reads for the alternative allele in the tumor samples and 4 supporting reads for the reference allele in the control samples. We removed variants found in the repetitive and low-complexity regions reported in RepeatMasker and genomic Super Dups databases, and we eliminated variants with a high population allele frequency (>0.01) reported in ExAC, gnomAD exome, and gnomAD genome databases. Finally, we filtered out variants that had an average median base quality and average median mapping quality lower than 10.
RNA-seq analysis
FASTQ files comprising reads from RNA sequencing (RNA-seq) were first tested for quality using FastQC v.0.11.7. Adaptor sequences and low-quality reads were trimmed using Trimmomatic v.0.36.5 We used STAR v.2.5.1a9 aligner to map reads to the human transcriptome. PCR duplicates were marked using Picard v.2.8.2. The transcript abundances were calculated using RSEM v1.3.0.10 The final output was a matrix of fragments per kilobase per million mapped reads units per transcript. Custom scripts were used to perform differential analysis. Gene set enrichment analysis (GSEA) was performed.5,6 All statistical analyses and plots were generated using R v3.4.4.
CNV analysis
Copy number variation (CNV) analysis was performed on WGS samples (n = 101; tumor-normal pairs). We used the copy number workflow from the GATK4 toolkit (v4.0.1.1) to make CNV calls as described on https://software.broadinstitute.org/gatk/documentation/article?id=11682. The tool uses a standardized and denoised read-depth method to detect CNVs and produce copy number ratios and a Gaussian-kernel binary-segmentation algorithm to detect copy number segments for each sample.
Identification of clusters of genomic alterations
We implemented a custom Python script to identify genomic clusters (ie, regions in the genome with at least 4 variants and where the variants are at most 200 base pairs [bp] apart from adjacent variants). For each identified genomic cluster, we computed the number of unique samples that have variants in the specific cluster. We manually curated the clusters by analyzing their location in the genome and the quality of the variants involved, and we performed visual tests using IGV. Next, using bedtools, we intersected the filtered cluster regions with locations of the genes and their promoters (2000 bps before the gene) using data obtained from UCSC Table Browser.
Translocation identification
We identified translocations by using Delly211 and by querying discordant reads (ie, read pairs that map to 2 different chromosomes). We clustered the discordant reads on the basis of the positions on both chromosomes. We considered translocations that had a cluster of at least 2 pairs of discordant reads with good mapping quality (>30).
EBV identification
We identified the presence of Epstein-Barr virus (EBV) using Diamond v0.9.18.12 EBV subtype calls were made for EBV+ samples by determining the proportion of type 1 (B95-8) vs type 2 EBNA-2 (AG876) sequences among unmapped reads. All patients were verified using in situ hybridization for EBER if material was available.
CRISPR screening
Three BL cell lines (BJAB, BL41, and Jijoye) were subjected to a CRISPR screen using the GeCKO v2.0 CRISPR library system, which contains more than 120 000 single guide RNAs (sgRNAs) that target more than 19 000 genes. Infected cell lines were harvested 3 days posttransduction (early) and 3 weeks posttransduction (late); DNA was isolated, and targeted sequencing of the sgRNAs was performed. More detailed protocols can be found in the supplemental Methods.
ID3 and TCF4 cell line experiments
First, ID3 was tagged with a 3xFLAG amino acid sequence and overexpressed in BL cell lines. Cells were expanded and then harvested for mass spectrometry, with experiments conducted as previously described13-15 with some modifications in sample preparation. Next, we used CRISPR targeting ID3 and TCF4 to silence protein function. Subsequent 5-bromo-2′-deoxyuridine (BrdU) analysis was performed on ID3 and TCF4 silenced cells and compared with wild-type (WT) cells. These methods are described in more detail in the supplemental Methods.
Mouse breeding
In the first cohort, we crossed Eµ-Myc+ mice with standard Id3 knockout strain mice and tracked survival over 200 days. In the second cohort, Eµ-Myc+ mice were crossed with the floxed Id3 conditional strain combined with the AID-Cre strain, restricting deletion of Id3 to germinal center (GC) cells. Tumors that arose were flash frozen for sectioning and disaggregated and then filtered into single-cell suspensions for flow analysis. Sections were stained with either hematoxylin and eosin or Ki-67 and Hoechst33342.
Results
Somatic genomic alterations identified from WGS of BL
We performed WGS of 101 BL tumor samples and their matched controls. Of these 101 BL patients, 60 had sporadic, 9 had HIV-associated, and 32 had endemic BL (supplemental Table 1). These tumor-normal pairs were subjected to WGS, targeting a mean genome-wide coverage of 75×. In all, we identified more than 2 million variants from these patients, including 228 010 somatic variants7 that were further analyzed (supplemental Table 2).
We developed an approach for identifying the genomic regions that had a high density of somatic variants representing clusters of alterations occurring anywhere in the BL genome. We identified 220 such genomic clusters that included both exonic and non-coding regions, which included at least 4 variants from any disease subtype within 200 bp of each other and affected at least 3 samples. We found 620 filtered somatic mutations (26.87%) that were associated with AID activity (ie, mutation was present within 3 bp of an AID recognition site WRCY). We integrated these findings into a model16 that we previously used 17 to identify genetic drivers.
Figure 1 shows a Circos diagram18 of the human genome with chromosomes and their respective ideograms. Genomic clusters are shown in the outer track as circles with the radius representing the number of affected samples. Notably, MYC, IGLL5, BACH2, ID3, and BTG2 were identified as prominent genomic clusters with multiple somatic events in both coding and non-coding regions of these genes (supplemental Table 3). The largest genomic cluster was identified in the oncogene MYC, containing 242 somatic events from 59 tumor samples in a 4011-bp window, consistent with the well-described role of MYC.
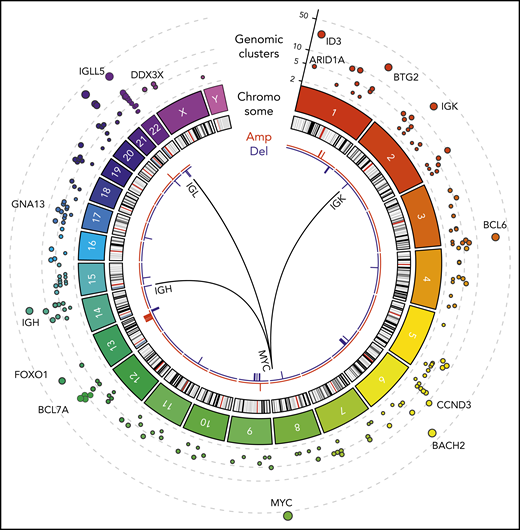
WGS of BL (N = 101). Tracks, from outside to inside, on the Circos plot: genomic clusters containing at least 4 somatic variants in at least 3 samples (y-axis shows the unique samples count) scaled by the mutated sample counts and CNVs represented as amplifications (red) and deletions (blue). The internal arches represent the 3 translocations involved in the disease between MYC gene (chr8) and immunoglobulin genes IGH (chr14), IGK (chr2), and IGL (chr22).
WGS of BL (N = 101). Tracks, from outside to inside, on the Circos plot: genomic clusters containing at least 4 somatic variants in at least 3 samples (y-axis shows the unique samples count) scaled by the mutated sample counts and CNVs represented as amplifications (red) and deletions (blue). The internal arches represent the 3 translocations involved in the disease between MYC gene (chr8) and immunoglobulin genes IGH (chr14), IGK (chr2), and IGL (chr22).
We also identified structural variations, including somatic recurrent copy number alterations (both amplifications and deletions; frequency in at least 3 samples), and chromosomal translocations. Chromosomal translocations involving MYC were also assessed in all patients as part of the clinical diagnosis. As expected, MYC translocations with IGH, IGK, or IGL were observed in all patients (Figure 1). In addition, next-generation sequencing identified a novel translocation between MYC (chromosome 8q24) and ACTB (chromosome 7p22). This translocation was confirmed using Sanger sequencing (supplemental Figure 1; supplemental Table 4). Somatic copy number alterations were identified by comparing tumor samples to a pool of normal samples taken from the same 101 patients. We identified a high prevalence of copy number alterations in IGLL5 (deletions) and MCL1 (gains).
Landscape of driver genes and their association with subtypes
In all, we identified a total of 72 driver genes in BL by using approaches that we developed previously.17 The heatmap of genetic alterations shows driver genes found in at least 15 BL patients ordered by their subtype and mutational frequency (Figure 2A; supplemental Table 5).
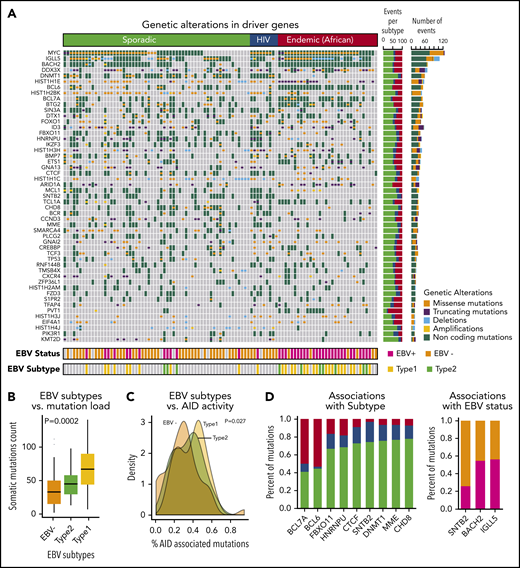
Landscape of genetic drivers in BL subtypes. (A) Heatmap of genetic alterations across BLs for the driver genes mutated in at least 15 samples. The bar plot on the right shows the sample counts for each of the driver genes. (B) Box plots showing the differential mutation load across the EBV subtypes. (C) Distribution of the proportion of AID-associated mutations for EBV status. (D) Bar plots showing genetic alterations significantly associated with BL subtypes (left) and EBV status (right).
Landscape of genetic drivers in BL subtypes. (A) Heatmap of genetic alterations across BLs for the driver genes mutated in at least 15 samples. The bar plot on the right shows the sample counts for each of the driver genes. (B) Box plots showing the differential mutation load across the EBV subtypes. (C) Distribution of the proportion of AID-associated mutations for EBV status. (D) Bar plots showing genetic alterations significantly associated with BL subtypes (left) and EBV status (right).
The patterns of mutations and structural alterations provided important clues to the oncogenic behavior of these driver genes (supplemental Figure 2). In addition to translocations, somatic mutations also occurred commonly in MYC as missense alterations sparing the helix-loop-helix (HLH) domain. BCL6 and MCL1 show a similar enrichment of missense mutations and amplifications consistent with a gain-of-function of these oncogenes. Conversely, DDX3X, ARID1A, and ID3 manifested frequent truncating mutations and deletions consistent with a loss-of-function of these tumor suppressors.
Non-coding mutations were a major feature of the mutational landscape of BLs, with a majority of the driver genes showing multiple non-coding events. More than 90% of the samples had non-coding genetic alterations in the driver genes. The high prevalence of non-coding mutations, even in known driver genes, underscores the importance of WGS for characterizing the driver events in BL. Interestingly, we observed that many non-coding variants associated with driver genes occurred in the promoter region or in the first intron. For 10 of the 72 driver genes, specifically IGLL5, BACH2, BTG2, BCL6, BCL7A, TCL1A, IRF8, CXCR4, ZFP36L1, and S1PR2, we identified patterns consistent with somatic hypermutation.19
Separately, we examined the profile of driver events in the context of WGS of diffuse large B-cell lymphoma (DLBCL)20 and found strong overlap between both coding and non-coding events in GC B-cell (GCB) DLBCL, including those affecting BCL6, DNMT1, BCL7A, IRF8, and FOXO1 (P < .01, χ2 test), implicating shared lineage from GCBs as a major influence in the acquisition of driver events.21
EBV is known to be a critical contributor to the pathogenesis of BLs. Not unexpectedly, EBV+ patients were significantly enriched in the endemic subtype (81% EBV+; P < .001, χ2 test). Among the sporadic BL patients, 20% were EBV+ (Figure 2A).
We further analyzed the association between somatic mutation load and EBV status. We found that EBV+ patients had a significantly higher mutation load compared with EBV– patients (P < 10−5, Wilcoxon test). This association was also observed when we stratified the patients by BL subtype, indicating a strong nexus between EBV infection and downstream genetic events. We further examined the effects of EBV subtype and found that patients with type 1 EBV+ had a significantly higher mutation load compared with those who had type 2 EBV+ tumors (Figure 2B; P = .0002, analysis of variance).
The observed high mutational burden led us to examine the relationship between AID-associated mutations and EBV subtypes. EBV+ BLs were associated with a higher proportion of AID-associated mutations compared with EBV– BLs (Figure 2C; P = .027, analysis of variance).
We analyzed the mutational spectrum that contributed to the somatic mutations (supplemental Figure 3) and identified 3 mutational signatures that are broadly associated with BLs. We compared these mutational signatures to the database of published signatures.22 EBV– endemic BLs were associated with a strand bias for C>T mutations, whereas EBV+ endemic BLs were associated with dysregulation of AID activity during somatic hypermutation. Conversely, somatic mutations in sporadic and HIV BL samples resembled a signature correlated with a transcriptional strand bias for C>A mutations.22 We further identified genetic alterations that were associated with 1 or more BL clinical subtypes or EBV status (Figure 2D; supplemental Table 6). We found that BCL7A and BCL6 genetic events were enriched in the endemic subtype, whereas DNMT1, SNTB2, and CTCF mutations occurred more frequently in HIV and sporadic patients (P < .05). SNTB2 mutations were associated with EBV– patients, and IGLL5 and BACH2 mutations were associated with EBV+ patients (P < .05).
Expression patterns associated with driver mutations in BL
We examined the downstream changes in gene expression associated with the driver mutations. To identify differentially expressed genes and pathways associated with genetic alterations in each of the driver genes, we performed logistic regression modeling by using BL subtype as a covariate to account for the differences between the subtypes. We next performed gene set enrichment (GSE) using described gene ontologies23,24 with odds ratios (logistic regression coefficients) as the ranked metric for enrichment analysis (Figure 3A; supplemental Tables 7 and 8).
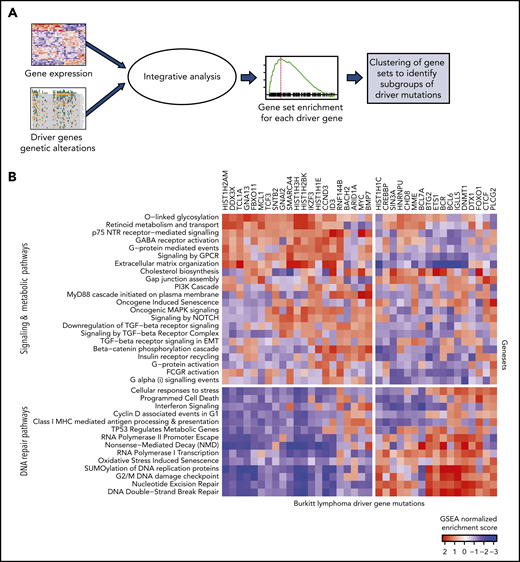
Expression patterns across BL. (A) Schematic showing the integrative analysis of driver gene mutations and gene expression profiles for BL. (B) Heatmap showing enrichment scores for gene sets associated with genetic alterations in each of the driver genes shows 2 clusters of gene sets: signaling and metabolic pathways and DNA repair.
Expression patterns across BL. (A) Schematic showing the integrative analysis of driver gene mutations and gene expression profiles for BL. (B) Heatmap showing enrichment scores for gene sets associated with genetic alterations in each of the driver genes shows 2 clusters of gene sets: signaling and metabolic pathways and DNA repair.
The normalized enrichment scores from GSE were then visualized as a heatmap for each of the driver genes (Figure 3B). We found that the gene sets clustered into 2 main groups involving signaling and metabolic pathways and DNA repair. Signaling pathways, including G-protein–mediated events, were enriched in GNA13 driver mutations. Mutations in DNMT1 and BCL6 were associated with DNA repair pathways.
Comparison of genetic alterations and gene expression of BL and DLBCL
BL and DLBCL are both aggressive B-cell lymphomas with overlapping morphology, immunophenotypes, and genetics. This overlap can make distinguishing between BL and DLBCL challenging. Given the vast differences in treatment for BL and DLBCL, the distinction is clinically important. We therefore compared the genetic alterations and gene expression of BL and DLBCL by using publicly available data from 1001 patients with DLBCL.17
We first compared the mutational profiles of BL and DLBCL. The overlap of the driver genes is shown as a Venn diagram (Figure 4A) and as a bar plot showing mutational frequencies for the top driver genes in BL and DLBCL (Figure 4B). Roughly 40% of the BL driver genes (31 of 72) are shared with DLBCL, and the remaining 60% are altered predominantly in BL, suggesting divergence in mutational patterns for these 2 lymphomas.
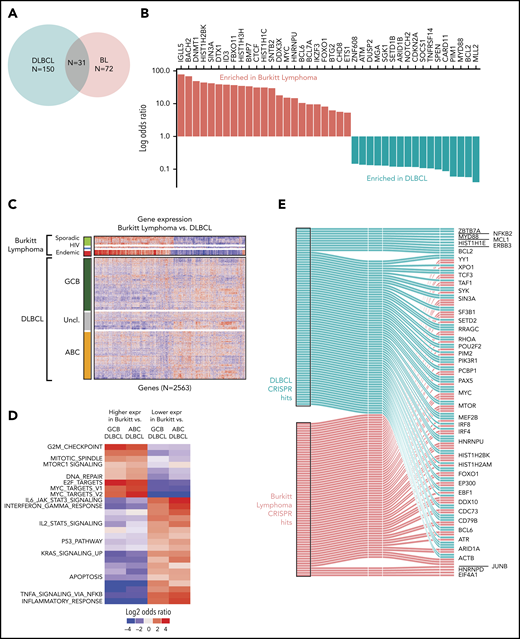
Comparison of BL to DLBCL. (A) Comparison of mutational driver in BL vs DLBCL are shown in a Venn diagram. (B) Bar plot showing contrasting mutational frequencies. (C) Heatmap of differential genes is shown for BL and DLBCL subgroups. (D) Heatmap of differential gene sets for BL vs ABC and GCB DLBCL. (E) Essential genes in BL and DLBCL identified by CRISPR knockout screen. Essential genes are grouped as BL-specific, DLBCL-specific, or shared (effects in both) effects upon knockout.
Comparison of BL to DLBCL. (A) Comparison of mutational driver in BL vs DLBCL are shown in a Venn diagram. (B) Bar plot showing contrasting mutational frequencies. (C) Heatmap of differential genes is shown for BL and DLBCL subgroups. (D) Heatmap of differential gene sets for BL vs ABC and GCB DLBCL. (E) Essential genes in BL and DLBCL identified by CRISPR knockout screen. Essential genes are grouped as BL-specific, DLBCL-specific, or shared (effects in both) effects upon knockout.
We further compared the expression profiles of BLs and DLBCLs. We first identified differential genes for each of the BL subtypes and compared these to the cell-of-origin–based DLBCL subtypes, activated B-cell-like (ABC DLBCL) and GCB-like (GCB DLBCL). We identified a total of 2563 differentially expressed genes that distinguished at least 2 BL subtypes from DLBCL (Figure 4C; supplemental Table 9). In general, we observed that the gene expression patterns of DLBCL were more heterogeneous than those of BLs, even when BL subtype differences were taken into account. As expected, GCB DLBCLs were closer in gene expression to BLs compared with ABC DLBCLs.
We plotted the gene set enrichment analysis (GSEA) results separately for differentially expressed genes associated with ABC DLBCL and GCB DLBCL, and by the direction of the effect (upregulated or downregulated). These significantly enriched gene sets are shown in Figure 4D (supplementary Table 10). As expected, MYC target genes were more strongly associated with BL compared with DLBCL. In addition, cell cycle and MTORC1 signaling had higher expression in BL compared with DLBCL, whereas apoptosis and JAK-STAT pathways were more highly expressed in DLBCL.
CRISPR screening to functionally annotate BL driver genes
To better understand the functional effects of the identified driver genes, we used a genome-wide human sgRNA library containing more than 120 000 sgRNAs targeting 19 050 protein coding genes in 3 BL cell lines (BJAB, BL41, Jijoye)25 and compared it to 3 DLBCL cell lines (SUDHL4, Ly3, HBL1). We transduced 3 replicate populations from each cell line with the complete sgRNA library and sequenced replicate populations at 2 time points (1 and 14 population doublings posttransduction) to observe changes in sgRNA frequency over time.
Genes whose knockout led to depletion at the late time point were deemed to be essential genes similar to those described previously.26 Broadly, BL-essential genes were observed to be enriched for cancer-related functions, including MYC targets, cell cycle and DNA repair, and other critical cellular processes, including ribosome biosynthesis, translation, and the metabolism of RNA and messenger RNA (supplemental Figure 4; supplemental Table 11). We noted that 15 BL driver genes were among these essential genes. Essential genes shared among BL and DLBCL included MYC, BCL6, and ARID1A (Figure 4E). We observed fewer BL-specific essential genes than DLBCL-specific genes, likely owing to the greater genetic heterogeneity of DLBCLs compared with BL.
Defining the biological effects of ID3
ID3 continued to stand out as one of the most recurrently silenced genes across all 3 BL subtypes, with mutations clustered within the HLH region (Figure 5A). Because ID3 lacks a DNA-binding domain, we reasoned that the effects of WT ID3 are largely exercised through HLH domain interactions at the protein level. We engineered the BJAB BL cell line to overexpress ID3 coupled to a FLAG epitope and performed co-immunoprecipitation followed by mass spectrometry–based proteomics to identify other proteins that were bound to ID3 in BL cells. Interestingly, we found that, in addition to the previously described interactions with TCF3,27 ID3 also binds the E2F proteins TCF4 and TCF12, accounting for 85% of all peptides detected, with TCF3 and TCF4 represented in roughly equal fractions (Figure 5B). No mutations were observed in TCF4 or TCF12, although both genes are highly expressed in BL.
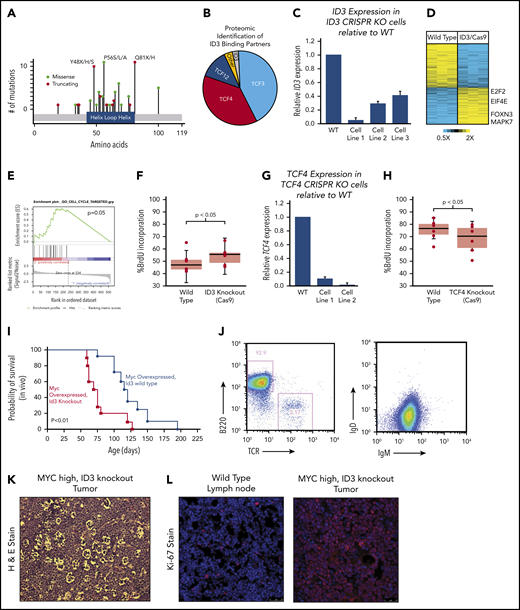
Characterization of ID3 loss in BL. (A) The mutational landscape of ID3 mutations found in BL with all 3 subtypes manifesting similar mutational patterns. (B) Proteomics analysis of proteins bound to WT ID3 in BL cell lines. (C) Quantitative PCR (qPCR) data showing diminished ID3 expression in CRISPR knockout (KO) cell lines. (D) RNA-seq data revealing differentially expressed genes between WT and ID3 CRISPR-engineered cell lines. (E) GSEA-identified cell cycle genes as being upregulated in ID3 CRISPR-engineered cells lines. (F) ID3 silencing is associated with increased incorporation of BrdU, indicating increased proliferation. (G) qPCR data showing diminished TCF4 expression in CRISPR- engineered cell lines. (H) TCF4 silencing is associated with decreased incorporation of BrdU, indicating decreased proliferation. (I) Tumor development and overall survival in Eµ-Myc+; Id3+/− (n = 10) mice compared with Eµ-Myc+; Id3+/+ (n = 8) mice. (J) Flow cytometry analysis of B220/TCR and IgD/IgM of Id3fl/+; AID-Cre+; Eµ-MycTg/0 tumors. (K) Tumors from Id3fl/+; AID-CreTg/0; Eµ-MycTg/0 conditional knockout crosses show a starry sky pattern. (L) Tumors from Id3fl/+; AID-CreTg/0; Eµ-MycTg/0 conditional knockout crosses have high Ki-67 expression. H&E, hematoxylin and eosin. Error bars represent standard error of the mean. Microscopy images are at ×10 magnification.
Characterization of ID3 loss in BL. (A) The mutational landscape of ID3 mutations found in BL with all 3 subtypes manifesting similar mutational patterns. (B) Proteomics analysis of proteins bound to WT ID3 in BL cell lines. (C) Quantitative PCR (qPCR) data showing diminished ID3 expression in CRISPR knockout (KO) cell lines. (D) RNA-seq data revealing differentially expressed genes between WT and ID3 CRISPR-engineered cell lines. (E) GSEA-identified cell cycle genes as being upregulated in ID3 CRISPR-engineered cells lines. (F) ID3 silencing is associated with increased incorporation of BrdU, indicating increased proliferation. (G) qPCR data showing diminished TCF4 expression in CRISPR- engineered cell lines. (H) TCF4 silencing is associated with decreased incorporation of BrdU, indicating decreased proliferation. (I) Tumor development and overall survival in Eµ-Myc+; Id3+/− (n = 10) mice compared with Eµ-Myc+; Id3+/+ (n = 8) mice. (J) Flow cytometry analysis of B220/TCR and IgD/IgM of Id3fl/+; AID-Cre+; Eµ-MycTg/0 tumors. (K) Tumors from Id3fl/+; AID-CreTg/0; Eµ-MycTg/0 conditional knockout crosses show a starry sky pattern. (L) Tumors from Id3fl/+; AID-CreTg/0; Eµ-MycTg/0 conditional knockout crosses have high Ki-67 expression. H&E, hematoxylin and eosin. Error bars represent standard error of the mean. Microscopy images are at ×10 magnification.
We further investigated the downstream effects of ID3 interactions using a CRISPR-based genetic engineering approach to introduce frameshift deletion events within the HLH region (oligos used are listed in supplemental Table 12). The deletion events induced by Cas9/sgRNA were confirmed by Sanger sequencing (supplemental Figure 5A) and the reduced gene expression was observed (Figure 5C). We then performed transcriptome sequencing (RNA-seq) on WT and corresponding ID3 knockout cell lines and found 96 genes to be differentially expressed between the 2 groups (Figure 5D). GSEA strongly implicated cell cycle as the main biological process affected by ID3 silencing (Figure 5E; q = 0.1, GSEA). We then validated these findings experimentally by performing cell cycle analysis by measuring BrdU incorporation in WT and ID3 knockout cells. Compared with WT cell lines, ID3 knockout cells had significantly more BrdU incorporation (Figure 5F; P < .05), indicating that ID3 knockout serves to accelerate cell cycle progression, even in established BL cells.
Given the identified proteomic interaction with TCF4, we also investigated the effects of TCF4 loss on cell cycle progression. We used the CRISPR method to introduce early frameshift deletions in the HLH domain of the TCF4 gene in Burkitt cell lines. Deletion events were confirmed by Sanger sequencing (supplemental Figure 5B), and subsequent reduced expression was observed through quantitative PCR (qPCR) analysis (Figure 5G). Cell cycle analysis on WT and knockout cells revealed that TCF4 knockout cells displayed reduced BrdU incorporation compared with WT cells (Figure 5H; P < .05), indicating reduced cell cycle progression. Thus, ID3 has pro-proliferative effects in BL, and its effects seem to oppose those of its binding partner TCF4, consistent with an inhibitory role for ID3 on both TCF3 and TCF4.
In vivo effects of ID3 loss
We sought to characterize the effect of ID3 loss in vivo using mouse models. Interestingly, Id3 knockout mice do not develop B-cell lymphomas and have relatively preserved lifespans. We therefore explored the possibility that ID3 loss collaborates with MYC gain of function in vivo. First, we crossed Id3+/+ or Id3+/− mice onto the Eµ-Myc background. Eµ-Myc;Id3+/− mice manifested large abdominal tumors similar to the clinical presentation of BL tumors in patients who live in the Western Hemisphere. Eµ-Myc;Id3+/− mice also demonstrated greatly reduced latency to tumor development compared with Eµ-Myc;Id3+/+ littermates (median survival, 70.5 days vs 114.0 days, respectively; Figure 5I) manifesting early B-cell phenotypes similar to those reported previously.28 Because BL is a GC-derived tumor, we also investigated the effect of Id3 loss specifically in the GC compartment. We crossed mice expressing a floxed version of Id3 with mice expressing Eµ-Myc and a Cre transgene driven by activation-induced cytidine deaminase (Aidca [AID-Cre]). Mice aged 3 months were injected with sheep red blood cells to simulate antigen exposure and the induction of GCBs. These mice also developed tumors, albeit at a later age (average, 5.9 months). The tumors in these mice exhibited a B220+IgM+IgDlow phenotype (Figure 5J). In addition, B-cell tumors that arose in these mice had a starry sky appearance (Figure 5K) and were almost uniformly Ki-67+ (Figure 5L), consistent with BL characteristics. Together, these data provide the first in vivo confirmation of the role of ID3 loss in potentiating the effects of MYC in BL pathogenesis.
Discussion
The 3 subtypes of BL have distinct clinical presentations. Through WGS and transcriptome sequencing of all 3 subtypes, we identified 72 driver genes in all 3 subtypes, with both coding and non-coding mutations. Interestingly, the sporadic and HIV subtypes were much more closely related to each other at both the genetic and transcriptional level than the endemic subtype. Notably, WGS identified a number of non-coding mutations in nearly all genetic drivers in BL, indicating that WGS greatly expands our understanding of genetic events that converge in BL subtypes.
CRISPR screening in BL cell lines indicated both oncogenes and tumor suppressor genes that have a role in cell proliferation. ID3 is one of the most commonly silenced genes in all 3 BL subtypes. Our in vitro and in vivo approaches indicated a role for ID3 in regulating cell proliferation through deregulation of TCF3 and TCF4 in BL cells. Interestingly, BL cell lines are known to be among the most proliferative of all cancer cell lines. Even in that setting, loss of ID3 and TCF4 had measurable effects in cell cycle progression. Our data suggest that TCF4 can potentially compensate for the loss of TCF3 function. The in vivo studies provide the first models, suggesting that synergy between ID3 and MYC emulates the pathogenesis of BL in B cells.
Our data have several clinical implications. First, the genomic landscape of BL identifies expression and genetic markers that enable the sometimes challenging but clinically important task of distinguishing BL from DLBCL. Evolving technologies might enable their direct measurement through DNA-seq and RNA-seq, obviating the need for several of the individual markers currently needed to distinguish DLBCLs in clinical pathology. Second, our data indicate that the clinically distinct BL subgroups arise from highly shared genetic origins. Thus, therapeutic approaches and clinical trials that are relevant to one subgroup are relevant to the other subgroups. For instance, a clinical trial conducted in sporadic BL in the Western Hemisphere is relevant to HIV patients with BL as well as BL patients in sub-Saharan Africa, even though the latter groups may be logistically difficult to enroll in a trial. Finally, our data support the continued evaluation of EBV status in BL patients. Our study thus provides a comprehensive examination of the genomic alterations in BL subtypes and provides a rich starting point for viable models of the disease and understanding its biology.
Primary sequencing data are publicly available through the European Genome-Phenome Archive (EGA) with accession number EGAD00001005781. This EGA entry also includes exome sequencing data that were not part of the analysis in this study.
The online version of this article contains a data supplement.
The publication costs of this article were defrayed in part by page charge payment. Therefore, and solely to indicate this fact, this article is hereby marked “advertisement” in accordance with 18 USC section 1734.
Authorship
Contribution: S.S.D. designed the research with help from Y.Z., M.A.L., and N.J.C.; S.S.D., C.L.L., J.R.S., R.I.P., and A.R. helped write the manuscript, design the figures, and generate the tables; C.L.L., J.R.S., G.L., B.C.P., V.S., and Y.-Y.L. performed the research; R.I.P., A.R., A.W., T.D., H.S., M.M., and D.T., analyzed the sequencing data; J.A.B., A.M.M., J.A.O., J.M.O., C.I.O., K.M.S.S., N.M., Y.F., K.L.R., G.R., R.R.M., B.A., G.B., C.R.F., S.L.O., E.D.H., W.W.L.C., R.K.H.A.-Y., G.L., W.H., H.M., and R.D.G. graciously contributed samples; and S.Y.K., S.L., M.A., M.B.M., and D.B.D. offered core laboratory services toward this project.
Conflict-of-interest disclosure: C.R.F. has served as a consultant for AbbVie, AstraZeneca, Bayer, BeiGene, Celgene (unpaid), Denovo Biopharma, Genentech/Roche (unpaid), Gilead, OptumRx, Karyopharm, Pharmacyclics/Janssen, and Spectrum and has received research funding from AbbVie, Acerta, BeiGene, Celgene, Gilead, Genentech/Roche, Janssen Pharmaceuticals, Millennium/Takeda, Pharmacyclics, TG Therapeutics, Burroughs Wellcome Fund, Eastern Cooperative Oncology Group, National Cancer Institute, and the V Foundation. E.D.H. has received research support from and served on scientific advisory panels for AbbVie, Eli Lilly, Seattle Genetics, and Celgene. G.L. has received honoraria from Bayer, Celgene, Gilead, Hexal, Janssen, and Roche; has participated in a consulting or advisory role for Amgen, Bayer, Bristol-Myers Squibb, Celgene, Gilead, Hexal, Janssen, Morphosys, Novartis, and Roche; has been on a speaker’s bureau for Bayer, Celgene, Gilead, Janssen, and Roche; has received research funding from AstraZeneca, Bayer, Celgene, Gilead, Janssen, and Roche; and has had travel, accommodation, and expenses reimbursed by Bayer, Celgene, Gilead, Hexal, Janssen, and Roche. S.S.D. owns equity in Data Driven Bioscience. The remaining authors declare no competing financial interests.
Correspondence: Sandeep S. Dave, Duke University, 101 Science Dr, Box 3382, Durham, NC 27710; e-mail: sandeep.dave@duke.edu.

This feature is available to Subscribers Only
Sign In or Create an Account Close Modal