

Key Points
Small-molecule GSIs increase BCMA surface expression on myeloma cells, resulting in enhanced CAR T-cell efficacy.

Abstract
B-cell maturation antigen (BCMA) is a validated target for chimeric antigen receptor (CAR) T-cell therapy in multiple myeloma (MM). Despite promising objective response rates, most patients relapse, and low levels of BCMA on a subset of tumor cells has been suggested as a probable escape mechanism. BCMA is actively cleaved from the tumor cell surface by the ubiquitous multisubunit γ-secretase (GS) complex, which reduces ligand density on tumor cells for CAR T-cell recognition and releases a soluble BCMA (sBCMA) fragment capable of inhibiting CAR T-cell function. Sufficient sBCMA can accumulate in the bone marrow of MM patients to inhibit CAR T-cell recognition of tumor cells, and potentially limit efficacy of BCMA-directed adoptive T-cell therapy. We investigated whether blocking BCMA cleavage by small-molecule GS inhibitors (GSIs) could augment BCMA-targeted CAR T-cell therapy. We found that exposure of myeloma cell lines and patient tumor samples to GSIs markedly increased surface BCMA levels in a dose-dependent fashion, concurrently decreased sBCMA concentrations, and improved tumor recognition by CAR T cells in vitro. GSI treatment of MM tumor-bearing NOD/SCID/γc−/− mice increased BCMA expression on tumor cells, decreased sBCMA in peripheral blood, and improved antitumor efficacy of BCMA-targeted CAR T-cell therapy. Importantly, short-term GSI administration to MM patients markedly increases the percentage of BCMA+ tumor cells, and the levels of BCMA surface expression in vivo. Based on these data, a US Food and Drug Administration (FDA)-approved clinical trial has been initiated, combining GSI with concurrent BCMA CAR T-cell therapy. This trial was registered at www.clinicaltrials.gov as #NCT03502577.
Introduction
Despite improvements in the treatment of multiple myeloma (MM) with novel agents and autologous stem cell transplantation, relapse remains nearly inevitable. No curative therapies exist, and the projected survival for high-risk MM patients remains short.1-11 Adoptive cell therapy with T cells engineered to express chimeric antigen receptors (CARs) is transforming therapy for patients with refractory acute lymphoblastic leukemia, chronic lymphocytic leukemia, and non-Hodgkin lymphoma,12-17 and is an attractive approach for MM. B-cell maturation antigen (BCMA) is a tumor necrosis family (TNF) receptor superfamily member (TNFRSF17) expressed on normal and malignant plasma cells and some subsets of mature B cells that is being studied as a target for CAR T cells.18-20 BCMA binds B-cell activating factor and a proliferation-inducing ligand to promote differentiation of normal B cells and growth and survival of malignant myeloma cells.21-25 Treatment of MM with autologous T cells expressing a BCMA-specific CAR with either CD28 or 4-1BB costimulatory domains has resulted in response rates of 64% to 85%.26-29 However, only 8% to 39% of patients had a sustained very good partial response or (stringent) complete response. Detailed analysis of escape has not been reported, but 2 studies found low BCMA expression on residual myeloma cells after BCMA CAR T therapy.27,28 Target antigen density may thus limit efficacy as has been observed in patients with B-cell malignancies receiving CD19- or CD22-specific CAR T cells,30-32 supporting the need for combination approaches that increase antigen density.
Surface BCMA is modulated by γ-secretase (GS), a multisubunit protease that mediates protein cleavage, resulting in release of a soluble BCMA (sBCMA) fragment composed of the extracellular domain and part of the transmembrane region.33 GS-mediated cleavage of BCMA may limit efficacy of BCMA-directed CAR T cells both by lowering target antigen density and providing a soluble decoy that could bind to the CAR. We show that small-molecule GS inhibitors (GSIs), developed for Alzheimer disease and cancer,34,35 can be repurposed to reduce shedding of BCMA from MM cells, increase BCMA surface expression, and enhance CAR T-cell recognition of MM in vitro and in vivo. Administering a GSI to MM patients increased the fraction of BCMA+ tumor cells and BCMA surface expression up to 157-fold. These results provide rationale for combining a GSI with BCMA CAR T cells to improve therapeutic benefits to patients.
Methods
Cell lines
Lenti-X cells (Clontech) were cultured as described.36 K562, Raji, RPMI 8226, U266B1, and MM.1R were obtained from the ATCC and cultured in RPMI 1640 supplemented with 100 U/mL penicillin/streptomycin and 5% to 10% fetal bovine serum. MOLP8, L-363, and KMS-12-BM were obtained from Deutsche Sammlung von Mikroorganismen and Zellkulturen GmbH and cultured in RPMI 1640 supplemented with 100 U/mL penicillin/streptomycin and ≤20% fetal bovine serum. Generation of K562 transfectants and firefly luciferase cell lines is described in supplemental Methods (available on the Blood Web site). All cells were tested bimonthly to confirm absence of mycoplasma.
Patient samples
Peripheral blood and bone marrow were obtained from healthy donors or patients with hematological malignancies. Peripheral blood mononuclear cells and T-cell subsets were isolated as described.37 CD138+ myeloma cells were enriched by immunomagnetic separation (Miltenyi Biotec) from bone marrow of MM patients. Bone marrow plasma was obtained by centrifuging heparinized bone marrow aspirates (BMAs) and stored at −80°C. Healthy donors and patients provided written informed consent for research protocols approved by the institutional review board of the Fred Hutchinson Cancer Research Center.
Lentiviral vectors, virus preparation, transduction of T cells, and functional assays
CD19-specific 4-1BB/CD3ζ and SLAMF7-specific CD28/CD3ζ CARs were previously described.38,39 BCMA CARs were constructed from codon-optimized sequences of the C11D5.3 (C11) antibody variable heavy (VH) and light (VL) chains in both VH-VL and VL-VH orientations40 with a (G4S)3 linker between VL and VH sequences. Single-chain variable fragments (scFvs) were linked to a modified immunoglobulin G4 (IgG4) hinge with a serine to proline substitution at position 10, the CD28 transmembrane region, a 4-1BB (CD137) or CD28 costimulatory endodomain, and the CD3ζ endodomain. Spacer sequences consisted of either a short (12-aa) IgG4 hinge, long (229-aa) IgG4 hinge-CH2-CH3NQ domain,38 or an IgG4 hinge with 1 or more 9-aa Strep-tag II (STII; NWSHPQFEK) sequences fused with (G4S) linkers.41 CAR constructs were cloned into a lentiviral vector epHIV7 containing truncated epidermal growth factor receptor (EGFRt) linked to the CAR transgene by a T2A sequence.42
Primary human T cells were activated, transduced with lentivirus, enriched, and expanded as described.36,38,43,44 CAR T cells were assayed 12 days after expansion for cytotoxicity by chromium-release assay, cytokine production by enzyme-linked immunosorbent assay (ELISA), and proliferation using carboxyfluorescein succinimidyl ester (CFSE) dilution.37 Intracellular cytokine staining was performed after T-cell stimulation for 4 hours at 37°C with tumor cells (effector-to-target [E:T] ratio, 4:1 or 5:1). GSIs, RO4929097 (Selleckchem or Apexbio), or LY3039478 (Eli Lilly) were dissolved in dimethyl sulfoxide and added to cultures at various concentrations. Recombinant BCMA (Peprotech) was added to cultures at various concentrations. sBCMA ELISA was performed according to the manufacturer’s recommendations (R&D Systems).
Immunophenotyping
T cells were stained with biotin-conjugated anti-EGFR monoclonal antibody (mAb; ImClone Systems Incorporated), recombinant BCMA/Fc-allophycocyanin (APC) (Creative Biomart), and mAbs specific for CD4 (RPA-T4) and CD8 (RPA-T8). Cell lines and CD138+ enriched BMAs were stained with mAbs specific for BCMA (19F2), CD138 (MI15), CD45 (HI30), CD19 (HIB19), propidium iodide (Invitrogen), or corresponding isotype controls. Mean fluorescence intensity (MFI) of BCMA on primary MM samples was corrected for isotype staining, and fold increase of surface BCMA was defined as GSI-treated MFIBCMA/control-MFIBCMA. For intracellular staining, cells were fixed and permeabilized using the FoxP3 staining kit (ThermoFisher) and stained with mAbs specific for interferon-γ (IFN-γ; B27), interleukin-2 (IL-2; MQ1-17H12), TNF (MAb11), or Ki67 (B56). For Annexin V staining, cells were washed with Annexin V–binding buffer and stained for Annexin V (BioLegend). Flow cytometry was performed on a FACSCantoII or FACSCelesta and data were analyzed with FlowJo (Treestar). For patient samples, BCMA antibody-binding capacity (ABC) and the percentage of positive plasma cells before and after GSI were measured as described previously.45
NSG mouse models
NOD/SCID/γc−/− (NSG) mice were purchased from The Jackson Laboratory or bred at Fred Hutchinson Cancer Research Center. Male mice (8-10 weeks old) were irradiated (275 Gy) and injected IV with 5 × 10⁶ MM.1R/eGFP-ffluc cells the following day. In other experiments, 5 × 10⁶ RPMI 8226/eGFP-ffluc cells were injected subcutaneously into the flank. Tumor engraftment was monitored by bioluminescence imaging and mice were assigned to treatment groups so that each group possessed equal average tumor luminescence.37 On days 19 to 20 (MM.1R) or day 24 (RPMI 8226) after tumor inoculation, mice received either GSI alone, CAR T cells, or both. RO4929097 was formulated in 1% hydroxypropyl cellulose, 0.5% Tween 80, 5% dimethyl sulfoxide; LY3039478 was formulated in 1% carboxymethylcellulose and 0.25% Tween 80. Both compounds were suspended by probe and waterbath sonication. GSIs were administered by oral gavage prior to and after IV administration of CAR T cells, for up to 90 days. LY3039478 concentrations in peripheral blood were measured as described.46 BCMA expression on myeloma cells in bone marrow and sBCMA levels in serum were analyzed after euthanasia. The institutional animal care and use committee approved of all mouse experiments.
Statistical analyses
Student paired and unpaired t tests, 1-way analysis of variance (ANOVA) with the Dunnett or Tukey posttest, the Mann-Whitney test, and the log-rank (Mantel-Cox) test were performed using Prism 7.0c (GraphPad). Linear regression analyses were conducted using R software (version 3.4.1) to show the correlation between BCMA and IFN-γ. Results with a P value of <.05 were considered significant.
Results
Characterization of BCMA-specific CARs
CARs were constructed using VH and VL from the BCMA-specific C11 antibody (Figure 1A).37,40 CD8+ T cells expressing the VH/VL (HL) 4-1BB/CD3ζ CAR produced more IFN-γ upon recognition of K562 cells transfected to express BCMA (K562-BCMA) or BCMA-expressing RPMI 8226 cells (8226), compared with those expressing the VL/VH (LH) 4-1BB/CD3ζ CAR (Figure 1B). The composition of the extracellular spacer can affect CAR T-cell recognition,38 thus, spacer lengths of the HL 4-1BB/CD3ζ CAR were varied by eliminating portions of the IgG4 Fc and/or incorporating STII sequences, which can enhance CAR function41 (Figure 1C). CARs varying in spacer length from 48 to 228 amino acids exhibited increased IFN-γ production in response to BCMA+ myeloma cell lines compared with a CAR with a short 12-aa IgG4 hinge spacer (Figure 1D).
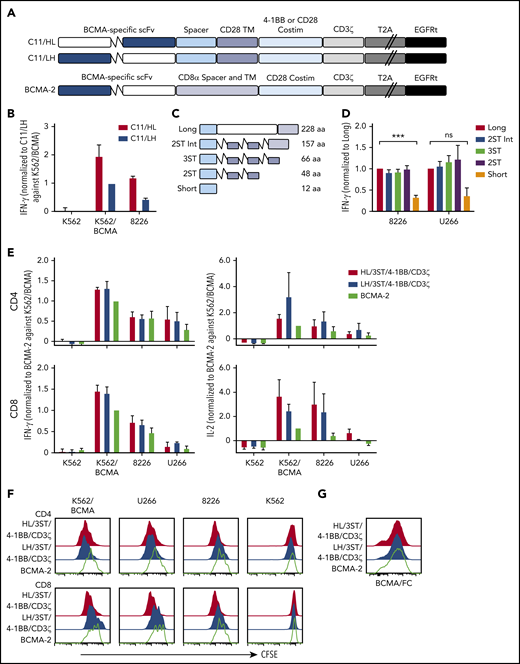
BCMA CAR design and optimization. (A) Schematic of CAR constructs containing the C11 scFv in VH/VL or VL/VH configuration (HL or LH), 4-1BB, or CD28 costimulatory domain (costim), CD3ζ signaling domain, T2A ribosomal skip sequence, and EGFRt. The previously described BCMA-2 CAR40 is also depicted, and contains a CD8α hinge and transmembrane (TM) domain, and a CD28 costimulatory domain. (B) CD8+ T cells were transduced with C11/HL and C11/LH 4-1BB/CD3ζ CARs containing a long spacer sequence (IgG4 hinge-CH2-CH3NQ) and selected for EGFRt expression. IFN-γ production in supernatants of CAR T cells after stimulation with K562, K562/BCMA, and 8226 cells for 24 hours was measured by ELISA. T cells were prepared from 2 different donors and values were normalized to production of C11/LH/4-1BB/CD3ζ against K562/BCMA. (C) Schematic of various spacers used in the C11/HL/4-1BB/CD3ζ BCMA-CARs. (D) IFN-γ production in supernatants of CD8+ BCMA CAR T cells with the indicated spacers after stimulation with 8226 and U266 myeloma cell lines for 24 hours as measured by ELISA. IFN-γ was normalized to production of long spacer CAR against 8226 or U266, respectively. (E) IFN-γ (left) and IL-2 (right) in supernatants of CD4+ and CD8+ T cells expressing C11/HL/3ST/4-1BB/CD3ζ, C11/HL/3ST/CD28/CD3ζ, or BCMA-2 CARs after 24 hours coculture with the indicated BCMA− and BCMA+ target cells. Values were normalized to BCMA-2 against K562/BCMA. (F) Proliferation of CD4+ and CD8+ BCMA CAR T cells after stimulation with target cells for 72 hours analyzed by CFSE dilution assay. (G) Representative CAR expression on CD8+ BCMA CAR T cells after isolation and expansion as measured by BCMA/Fc conjugated to APC. The E:T ratio was 2:1 in all assays. Data in panels D through G are summarized (D-E) or representative (F-G) of 2 or more individual experiments with T cells prepared from different donors. Data depicted in bar graphs represent mean plus standard error of the mean (SEM). ***P < .001; as determined by 1-way ANOVA with the Dunnett posttest. ns, not significant.
BCMA CAR design and optimization. (A) Schematic of CAR constructs containing the C11 scFv in VH/VL or VL/VH configuration (HL or LH), 4-1BB, or CD28 costimulatory domain (costim), CD3ζ signaling domain, T2A ribosomal skip sequence, and EGFRt. The previously described BCMA-2 CAR40 is also depicted, and contains a CD8α hinge and transmembrane (TM) domain, and a CD28 costimulatory domain. (B) CD8+ T cells were transduced with C11/HL and C11/LH 4-1BB/CD3ζ CARs containing a long spacer sequence (IgG4 hinge-CH2-CH3NQ) and selected for EGFRt expression. IFN-γ production in supernatants of CAR T cells after stimulation with K562, K562/BCMA, and 8226 cells for 24 hours was measured by ELISA. T cells were prepared from 2 different donors and values were normalized to production of C11/LH/4-1BB/CD3ζ against K562/BCMA. (C) Schematic of various spacers used in the C11/HL/4-1BB/CD3ζ BCMA-CARs. (D) IFN-γ production in supernatants of CD8+ BCMA CAR T cells with the indicated spacers after stimulation with 8226 and U266 myeloma cell lines for 24 hours as measured by ELISA. IFN-γ was normalized to production of long spacer CAR against 8226 or U266, respectively. (E) IFN-γ (left) and IL-2 (right) in supernatants of CD4+ and CD8+ T cells expressing C11/HL/3ST/4-1BB/CD3ζ, C11/HL/3ST/CD28/CD3ζ, or BCMA-2 CARs after 24 hours coculture with the indicated BCMA− and BCMA+ target cells. Values were normalized to BCMA-2 against K562/BCMA. (F) Proliferation of CD4+ and CD8+ BCMA CAR T cells after stimulation with target cells for 72 hours analyzed by CFSE dilution assay. (G) Representative CAR expression on CD8+ BCMA CAR T cells after isolation and expansion as measured by BCMA/Fc conjugated to APC. The E:T ratio was 2:1 in all assays. Data in panels D through G are summarized (D-E) or representative (F-G) of 2 or more individual experiments with T cells prepared from different donors. Data depicted in bar graphs represent mean plus standard error of the mean (SEM). ***P < .001; as determined by 1-way ANOVA with the Dunnett posttest. ns, not significant.
We compared the HL/3ST CAR with either a 4-1BB/CD3ζ or CD28/CD3ζ signaling domain to a VL/VH (LH)/CD28/CD3ζ CAR (BCMA-2) with a CD8α spacer and transmembrane domain that has efficacy in the clinic26,27,40 (Figure 1A). T cells expressing HL/3ST CARs with either signaling domain exhibited similar IFN-γ and IL-2 production, and greater proliferation upon coculture with BCMA+-cell lines than the BCMA-2 CAR (Figure 1E-F). The surface expression of each CAR, as measured by staining with recombinant Fc/BCMA, was similar (Figure 1G), indicating that the differences in effector function were due to scFv orientation and/or differences in spacer, transmembrane, and costimulatory sequences. The HL/3ST/4-1BB/CD3ζ CAR was used for subsequent experiments and is hereafter referred to as BCMA CAR.
Recognition of primary myeloma cells by CAR T cells correlates with surface BCMA levels
Primary myeloma cells vary in BCMA surface expression.20, We assessed BCMA expression on CD138+ cells from MM patient bone marrow. BCMA was detected on 21 of 22 samples (95%) with 12 (54%) showing more than a twofold increase in MFI over isotype (BCMA++), 9 (41%) expressing moderate levels (1.25-fold to twofold; BCMA+), and 1 (5%) dim or negative (<1.25-fold; BCMA+/−) (Figure 2A). Notably, higher BCMA expression on patient samples (n = 9) positively correlated with IFN-γ production in BCMA CAR T-cell cocultures (Figure 2B). These data suggest that surface BCMA is a determinant of tumor cell recognition by CAR T cells.
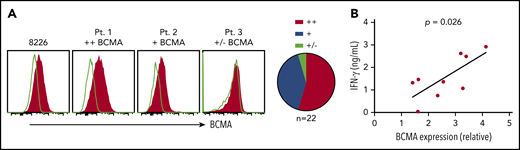
BCMA CARs recognize patient CD138+ myeloma cells in vitro. (A) Staining of BCMA on 8226 and 3 representative primary MM samples. Open histograms depict staining with isotype control. All plots are gated on CD38+ (thawed) or CD138+ (fresh) CD45−propidium iodide (PI)− singlet cells after Ficoll separation and CD138+ enrichment of freshly collected BMAs. Summarized data for all evaluable primary MM samples (n = 22) are shown as pie charts. (B) IFN-γ concentrations in supernatants of CD8+ BCMA CAR T cells after stimulation with primary CD138+ myeloma cells for 24 hours at a ratio of 2:1 as measured by ELISA. BCMA CAR T cells were generated from different allogeneic donors. Untransduced T cells or T cells transduced with an irrelevant CAR from the same donor were included as a control for alloreactivity as well as the CD138-depleted fraction from patient samples as a control for BCMA specificity. Supernatants from control cultures were <275 pg/mL in all assays. Correlation between BCMA and IFN-γ is depicted with P values by linear regression.
BCMA CARs recognize patient CD138+ myeloma cells in vitro. (A) Staining of BCMA on 8226 and 3 representative primary MM samples. Open histograms depict staining with isotype control. All plots are gated on CD38+ (thawed) or CD138+ (fresh) CD45−propidium iodide (PI)− singlet cells after Ficoll separation and CD138+ enrichment of freshly collected BMAs. Summarized data for all evaluable primary MM samples (n = 22) are shown as pie charts. (B) IFN-γ concentrations in supernatants of CD8+ BCMA CAR T cells after stimulation with primary CD138+ myeloma cells for 24 hours at a ratio of 2:1 as measured by ELISA. BCMA CAR T cells were generated from different allogeneic donors. Untransduced T cells or T cells transduced with an irrelevant CAR from the same donor were included as a control for alloreactivity as well as the CD138-depleted fraction from patient samples as a control for BCMA specificity. Supernatants from control cultures were <275 pg/mL in all assays. Correlation between BCMA and IFN-γ is depicted with P values by linear regression.
sBCMA inhibits CAR T-cell recognition
MM patients have elevated levels of sBCMA in blood,22,47 and we anticipated sBCMA would be present in the bone marrow, the primary site where CAR T cells encounter tumor. BCMA was detected at concentrations of 10 to 5419 ng/mL (median, 338 ng/mL) in the supernatant of BMA from MM patients (n = 15), and was below 20 ng/mL in BMA from patients with other hematological malignancies (n = 5) (Figure 3A). sBCMA was highest in samples with >2% CD138+ cells (range, 3% to 33.1%), and 5 samples had concentrations over 1000 ng/mL (Figure 3A).
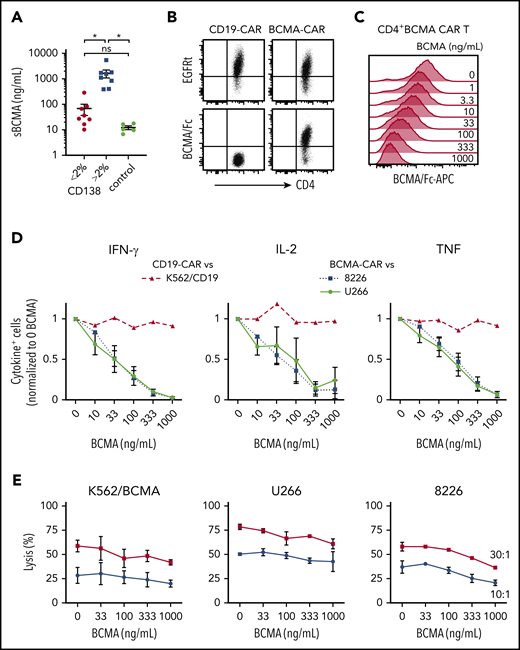
sBCMA binds BCMA CAR T cells and inhibits cytokine production. (A) sBCMA concentration in plasma from MM and control patient BM measured by ELISA. Samples were stratified by the percentage of CD138+ cells of live BMMCs as measured by flow cytometry for MM patient samples. (B) Surface staining of CD4+ BCMA− and CD19 CAR T cells with APC-conjugated BCMA/Fc and anti-EGFR Ab. (C) Staining with APC-conjugated BCMA/Fc of CD4+ BCMA CAR T cells after 30 minutes preincubation with exogenous recombinant BCMA. (D) Intracellular IFN-γ (left), IL-2 (middle), or TNF (right panel) staining of CD4+ T cells after 5 hours of stimulation with 8226 or U266 (BCMA CAR T) or K562-CD19 (CD19 CAR T) in the presence and absence of exogenous recombinant BCMA at an E:T ratio of 4:1. (E) Cytolytic activity of CD4+ BCMA CAR T cells against K562/BCMA (left), U266 (middle), and 8226 (right) at varying concentrations of recombinant BCMA analyzed by a 4-hour 51Cr-release assay at an E:T ratio of 30:1 (squares) and 10:1 (circles). Data in panels B and C are representative of 2 independent experiments with T cells from different donors; data in panels D and E show summarized data with T cells from 2 different donors. Error bars represent mean plus SEM. *P < .05; as determined by 1-way ANOVA with the Tukey posttest. Data for CD8+ T cells are shown in supplemental Figure 1A.
sBCMA binds BCMA CAR T cells and inhibits cytokine production. (A) sBCMA concentration in plasma from MM and control patient BM measured by ELISA. Samples were stratified by the percentage of CD138+ cells of live BMMCs as measured by flow cytometry for MM patient samples. (B) Surface staining of CD4+ BCMA− and CD19 CAR T cells with APC-conjugated BCMA/Fc and anti-EGFR Ab. (C) Staining with APC-conjugated BCMA/Fc of CD4+ BCMA CAR T cells after 30 minutes preincubation with exogenous recombinant BCMA. (D) Intracellular IFN-γ (left), IL-2 (middle), or TNF (right panel) staining of CD4+ T cells after 5 hours of stimulation with 8226 or U266 (BCMA CAR T) or K562-CD19 (CD19 CAR T) in the presence and absence of exogenous recombinant BCMA at an E:T ratio of 4:1. (E) Cytolytic activity of CD4+ BCMA CAR T cells against K562/BCMA (left), U266 (middle), and 8226 (right) at varying concentrations of recombinant BCMA analyzed by a 4-hour 51Cr-release assay at an E:T ratio of 30:1 (squares) and 10:1 (circles). Data in panels B and C are representative of 2 independent experiments with T cells from different donors; data in panels D and E show summarized data with T cells from 2 different donors. Error bars represent mean plus SEM. *P < .05; as determined by 1-way ANOVA with the Tukey posttest. Data for CD8+ T cells are shown in supplemental Figure 1A.
We then evaluated whether sBCMA bound to CD4+ and CD8+ BCMA CAR T cells using a competitive Fc/BCMA-binding assay. We observed that Fc/BCMA-APC binding was reduced in a dose-dependent fashion by the addition of nonfluorescent recombinant BCMA (Figure 3B-C; supplemental Figure 1A). To determine whether sBCMA binding affected recognition of BCMA+ target cells, cytokine production and cytolysis were measured after coculture of BCMA or CD19 CAR T cells with 8226, U266, or K562/CD19 cells in the presence of exogenous recombinant BCMA. Recombinant BCMA in concentrations as low as 10 ng/mL reduced the frequency of cytokine-producing BCMA CAR T cells (Figure 3D; supplemental Figure 1B), but did not impair CD19 CAR T cells. Only high concentrations (333-1000 ng/mL) of recombinant BCMA affected cytolytic activity of CAR T cells against 1 of 3 BCMA+ cell lines, consistent with the lower threshold for cytolysis compared with cytokine production (Figure 3E; supplemental Figure 1C).48
Inhibition of GS increases BCMA on myeloma cells
The escape of antigen low/negative tumor is a mechanism of failure after therapy with antigen-specific T cells.13,49,50 We hypothesized that treatment of myeloma cells with a GSI would increase surface BCMA and improve CAR T-cell recognition. We confirmed expression of GS subunits in myeloma cell lines with different levels of BCMA expression (supplemental Figures 2 and 3A), and found that culturing these cell lines with GSI RO4929097 for 24 hours exhibited a dose-dependent increase in surface BCMA that was maximal above 0.1 μM (Figure 4A-B). Increased surface BCMA was accompanied by decreased sBCMA in supernatant, consistent with inhibition of GS-mediated cleavage as the mechanism of action (Figure 4C). The increase in surface BCMA was rapid, with a threefold to sixfold increase after 5 hours of exposure to RO4929097; and reversible, with a return to baseline 3 hours after drug removal (Figure 4D). RO4929097 also increased surface BCMA levels on primary CD138+ myeloma cells from patients (n = 7) with a concentration of ≥0.1 μM, resulting in a threefold to 10-fold increase after 4 hours (Figure 4E-F).
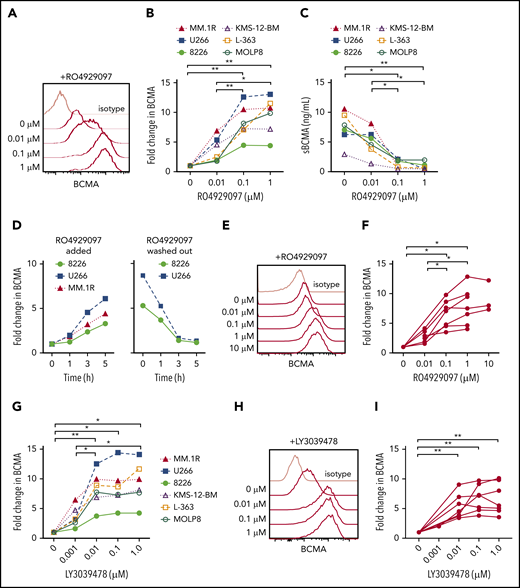
GSI decreases shedding of BCMA from myeloma cell lines and primary samples. (A) Surface BCMA staining of MM.1R after 24-hour incubation with increasing concentrations of RO4929097. (B) Fold change in surface BCMA on myeloma cell lines after 24-hour incubation with increasing concentrations of RO4929097. (C) Concentration of sBCMA in supernatant of cell lines cultured in increasing concentrations of RO4929097 for 24 hours as measured by ELISA. (D) Fold change of surface BCMA expression on myeloma cell lines cultured in 1 μM RO4929097 at various time points (hours) and after RO4929097 was washed out and cells were cultured in media without GSI (left and right panel, respectively). (E-F) Representative staining (E) and fold increase of BCMA (F) on CD138+ primary myeloma cells (n = 7) after 4-hour incubation with increasing amounts of RO4929097. (G) Fold change in surface BCMA on myeloma cell lines after 24-hour incubation with increasing concentrations of LY3039478. (H-I) Representative staining (H) and fold increase of BCMA (I) on CD138+ primary myeloma cells (n = 7) after 4-hour incubation with increasing amounts of LY3039478. Primary cells and cell lines were cultured at 0.5 × 10⁶ cells per milliliter. Fold change in BCMA is defined as treated (MFIBCMA)/control (MFIBCMA) and isotype corrected for primary samples. Data in panels A through D and G are representative of 3 independent experiments. *P < .05, **P < .01, as determined by repeated measures 1-way ANOVA with the Tukey posttest.
GSI decreases shedding of BCMA from myeloma cell lines and primary samples. (A) Surface BCMA staining of MM.1R after 24-hour incubation with increasing concentrations of RO4929097. (B) Fold change in surface BCMA on myeloma cell lines after 24-hour incubation with increasing concentrations of RO4929097. (C) Concentration of sBCMA in supernatant of cell lines cultured in increasing concentrations of RO4929097 for 24 hours as measured by ELISA. (D) Fold change of surface BCMA expression on myeloma cell lines cultured in 1 μM RO4929097 at various time points (hours) and after RO4929097 was washed out and cells were cultured in media without GSI (left and right panel, respectively). (E-F) Representative staining (E) and fold increase of BCMA (F) on CD138+ primary myeloma cells (n = 7) after 4-hour incubation with increasing amounts of RO4929097. (G) Fold change in surface BCMA on myeloma cell lines after 24-hour incubation with increasing concentrations of LY3039478. (H-I) Representative staining (H) and fold increase of BCMA (I) on CD138+ primary myeloma cells (n = 7) after 4-hour incubation with increasing amounts of LY3039478. Primary cells and cell lines were cultured at 0.5 × 10⁶ cells per milliliter. Fold change in BCMA is defined as treated (MFIBCMA)/control (MFIBCMA) and isotype corrected for primary samples. Data in panels A through D and G are representative of 3 independent experiments. *P < .05, **P < .01, as determined by repeated measures 1-way ANOVA with the Tukey posttest.
We tested a structurally distinct more potent GSI (LY3039478) with a 50% inhibitory concentration of 0.4 nM compared with 4 nM for RO4929097. Treatment of myeloma cell lines with LY3039478 showed a similar fivefold to 10-fold surface BCMA upregulation, but induced near maximum BCMA levels at a lower concentration (0.01 μM) than RO4909297 (Figure 4G). Surface BCMA also increased by threefold to ninefold on patient CD138+ myeloma cells (n = 7) cultured in ≥ 0.01 μM LY3039478 for 4 hours (Figure 4H-I). We did not observe alterations in myeloma cell viability or expression of other surface markers, including CD38, SLAMF7, CD80, CD86, PD-L1, and CD138, even after longer exposure to RO4929097 or LY3039478 (supplemental Figure 3B-D). Collectively, these data demonstrate that inhibiting cleavage of BCMA with GSIs increases surface density of BCMA on myeloma cells.
BCMA CAR T-cell recognition of myeloma cells is enhanced by GSI treatment
We next evaluated the effects of GSI on recognition of myeloma cells by BCMA CAR T cells. Pretreatment of MOLP8, which expresses low BCMA levels, with GSI significantly increased the frequency of T cells that produced cytokines and improved lysis by BCMA CAR T cells (Figure 5A; supplemental Figure 4A). Lysis of MOLP8 by SLAMF7 CAR T cells was not increased by GSI treatment. GSI treatment of KMS-12-BM and L-363, which express intermediate BCMA levels, also increased BCMA CAR T-cell cytokine production. T-cell cytokine production and lysis of MM.1R, which expresses high levels of BCMA without GSI, was not improved by GSI treatment (supplemental Figures 4B and 5). These data suggest there is a threshold of BCMA expression beyond which CAR T-cell activity is not further increased. Importantly, we did not observe an increase in the frequency of CAR T cells undergoing activation-induced cell death (AICD) after exposure to myeloma cell lines (8226 and MM.1R) that express high levels of BCMA after GSI treatment (supplemental Figure 6).
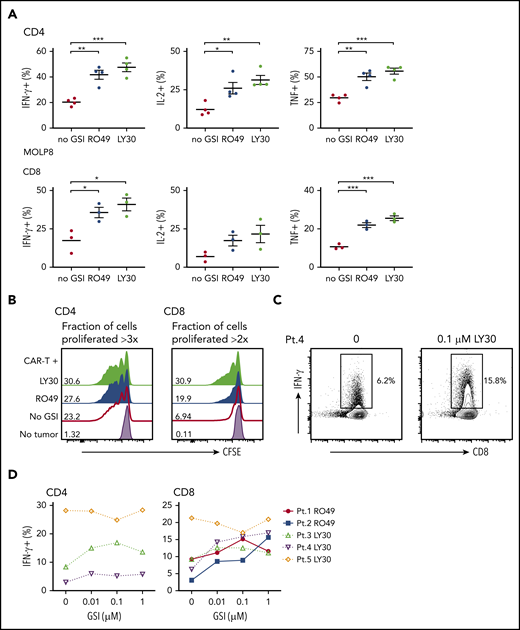
GSI pretreatment leads to increased CAR T-cell reactivity to myeloma cell line and primary myeloma samples. (A) Percentage of cytokine+ of CD4+ (top) or CD8+ (bottom panels) BCMA CAR T cells after stimulation with MOLP8 myeloma cell line pretreated with 10 μM RO4929097 or 0.1 μM LY3039478 for 4 hours. (B) Proliferation of CD4+ or CD8+ BCMA CAR T cells measured by CFSE dilution after 72 hours of stimulation with primary myeloma cells (E:T 2:1) that were pretreated with 1 μM RO4929097 (blue histogram) or 1 μM LY3039478 (light green histogram) for 4 hours. No GSI control is indicated by the red line and T cells only by the lavender histogram. Fraction of cells proliferated >3 times (CD4) or >2 times (CD8) is indicated per histogram. Data shown are representative of n = 3. (C) Representative contour plot of intracellular IFN-γ staining of CD8+ BCMA CAR T cells stimulated for 4 hours with patient primary myeloma cells pretreated with 0.1 μM LY3039478 at an E:T ratio of 5:1. (D) Percentage of IFN-γ+ CD4+ or CD8+ BCMA CAR T cells after stimulation with patient primary myeloma cells pretreated with various concentrations of RO4929097 or LY3039478. Data in panel A are summarized from 2 independent experiments with BCMA CAR T cells prepared from at least 3 different donors. Error bars represent mean plus SEM. *P < .05, **P < .01, ***P < .001 as determined by 1-way ANOVA with the Tukey posttest.
GSI pretreatment leads to increased CAR T-cell reactivity to myeloma cell line and primary myeloma samples. (A) Percentage of cytokine+ of CD4+ (top) or CD8+ (bottom panels) BCMA CAR T cells after stimulation with MOLP8 myeloma cell line pretreated with 10 μM RO4929097 or 0.1 μM LY3039478 for 4 hours. (B) Proliferation of CD4+ or CD8+ BCMA CAR T cells measured by CFSE dilution after 72 hours of stimulation with primary myeloma cells (E:T 2:1) that were pretreated with 1 μM RO4929097 (blue histogram) or 1 μM LY3039478 (light green histogram) for 4 hours. No GSI control is indicated by the red line and T cells only by the lavender histogram. Fraction of cells proliferated >3 times (CD4) or >2 times (CD8) is indicated per histogram. Data shown are representative of n = 3. (C) Representative contour plot of intracellular IFN-γ staining of CD8+ BCMA CAR T cells stimulated for 4 hours with patient primary myeloma cells pretreated with 0.1 μM LY3039478 at an E:T ratio of 5:1. (D) Percentage of IFN-γ+ CD4+ or CD8+ BCMA CAR T cells after stimulation with patient primary myeloma cells pretreated with various concentrations of RO4929097 or LY3039478. Data in panel A are summarized from 2 independent experiments with BCMA CAR T cells prepared from at least 3 different donors. Error bars represent mean plus SEM. *P < .05, **P < .01, ***P < .001 as determined by 1-way ANOVA with the Tukey posttest.
We next pretreated CD138+ primary myeloma cells with RO4929097 or LY3039478 prior to coculture with BCMA CAR T cells. GSI pretreatment of primary myeloma cells increased proliferation of BCMA CAR T cells (Figure 5B), and all but 1 sample induced a greater proportion of CAR T cells to produce IFN-γ by intracellular staining (Figure 5C-D). The effect on IFN-γ was observed at concentrations as low as 0.01 μM RO4929097 and LY3039478. The 1 sample for which recognition was not augmented had the highest baseline BCMA expression (data not shown), and induced IFN-γ production in >20% of CAR T cells without GSI. Together, these data demonstrate that increased surface density of BCMA on CD138+ primary myeloma cells and cell lines with LY3039478 or RO4929097 improves recognition and activation of BCMA CAR T cells.
To confirm that the effects of GSI on BCMA expression were due to inhibition of cleavage, we constructed mutants with a CD28 transmembrane region (BCMA28tm). GSI treatment of K562 cells transfected with wild-type BCMA increased surface BCMA and reduced sBMCA, whereas K562 cells transfected with BCMA28tm expressed higher levels of BCMA at baseline and exhibited minimal upregulation with GSI treatment (supplemental Figure 7A-B). The K562-BCMA and K562-BCMA28tm transfectants both expressed high levels of BCMA, and like MM1.R, lysis by CAR T cells was not increased by GSI treatment (supplemental Figure 7C).
Effects of GSI on T-cell function
A theoretical concern for using GSI to augment BCMA levels is that T-cell effector functions might be altered by inhibition of the Notch pathway.51,52 We evaluated the effects of GSI on CD19 CAR T cells because CD19 levels are not altered by GSI (Figure 6A). CD19 CAR T cells were cocultured with K562/CD19 cells in the presence of GSI, and T-cell viability and effector functions were measured. RO4929097 and LY3039478 did not impair viability or cytolytic activity of CD19 CAR T cells (Figure 6B-C). However, both GSIs reduced IL-2 production by CD19 CAR T cells after stimulation with K562/CD19, and inhibition was reversible after removal of the GSI from the culture (Figure 6D-E). Proliferation of CD19 CAR T cells was also reduced when concentrations of RO4929097 or LY3039478 exceeded 1 μM or 0.1 μM, respectively, whereas lower concentrations did not affect T-cell entry into cell division or the number of divisions that occurred over 4 days after tumor cell stimulation (Figure 6F).
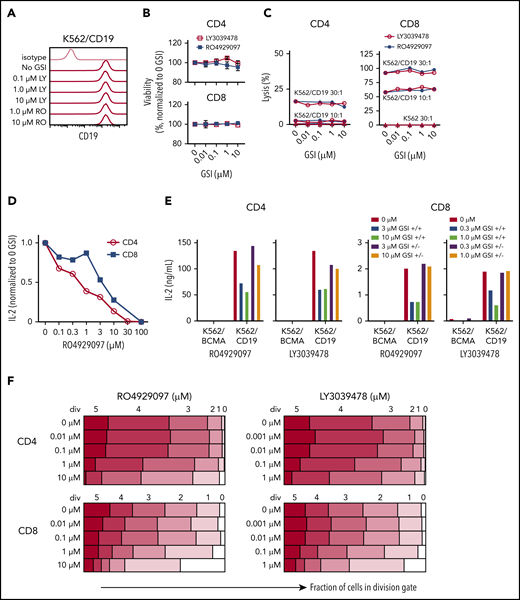
Inhibition of T-cell function by GSIs is dose dependent. (A) RO4929097 or LY3039478 do not affect cell surface CD19 expression on K562/CD19. Cells were cultured with or without GSI for 16 to 18 hours and stained with anti-CD19 and isotype control antibodies. (B) Viability of CD4+ and CD8+ CD19 CAR T cells incubated with GSI for 24 hours measured by propidium iodide staining, normalized to percentage of no GSI condition. (C) Cytolytic activity of CD4+ and CD8+ CD19 CAR T cells incubated for 4 hours with K562/CD19 (circles) or K562 control (triangles) with varying concentrations of RO4929097 (filled circles) or LY3039478 (open circles) at an E:T ratio of 30:1 and 10:1 as measured by 51Cr release assay. (D) IL-2 secretion by CD4+ and CD8+ CD19 CAR T cells stimulated with K562/CD19 at an E:T ratio of 2:1 for 18 hours in the presence of various concentrations of RO4929097. (E) IL-2 secretion by CD4+ and CD8+ CD19 CAR T cells stimulated with K562/CD19 or K562/BCMA at an E:T ratio of 2:1. CAR T cells were preincubated with the indicated concentrations of RO4929097 or LY3039478. GSI was either washed out (+/−) or present during the assay (+/+). IL-2 production was measured after 18 hours coculture with K562/BCMA or K562/CD19. (F) Proliferation of CD4+ and CD8+ CD19 CAR T cells stimulated with K562/CD19 or K562/BCMA in the indicated concentrations of RO4929097 (left panels) or LY3039478 (right panels) determined by CFSE dilution after 96 hours. Data from panels A through F are representative of ≥2 independent experiments. Error bars represent mean plus SEM.
Inhibition of T-cell function by GSIs is dose dependent. (A) RO4929097 or LY3039478 do not affect cell surface CD19 expression on K562/CD19. Cells were cultured with or without GSI for 16 to 18 hours and stained with anti-CD19 and isotype control antibodies. (B) Viability of CD4+ and CD8+ CD19 CAR T cells incubated with GSI for 24 hours measured by propidium iodide staining, normalized to percentage of no GSI condition. (C) Cytolytic activity of CD4+ and CD8+ CD19 CAR T cells incubated for 4 hours with K562/CD19 (circles) or K562 control (triangles) with varying concentrations of RO4929097 (filled circles) or LY3039478 (open circles) at an E:T ratio of 30:1 and 10:1 as measured by 51Cr release assay. (D) IL-2 secretion by CD4+ and CD8+ CD19 CAR T cells stimulated with K562/CD19 at an E:T ratio of 2:1 for 18 hours in the presence of various concentrations of RO4929097. (E) IL-2 secretion by CD4+ and CD8+ CD19 CAR T cells stimulated with K562/CD19 or K562/BCMA at an E:T ratio of 2:1. CAR T cells were preincubated with the indicated concentrations of RO4929097 or LY3039478. GSI was either washed out (+/−) or present during the assay (+/+). IL-2 production was measured after 18 hours coculture with K562/BCMA or K562/CD19. (F) Proliferation of CD4+ and CD8+ CD19 CAR T cells stimulated with K562/CD19 or K562/BCMA in the indicated concentrations of RO4929097 (left panels) or LY3039478 (right panels) determined by CFSE dilution after 96 hours. Data from panels A through F are representative of ≥2 independent experiments. Error bars represent mean plus SEM.
To assess effects of prolonged exposure of CAR T cells to GSI, we expanded CD19 CAR T cells in the presence of increasing concentrations of RO4929097 or LY3039478 and tested their function after GSI removal. CD19 CAR T cells cultured with RO4929097 or LY3039478 showed dose-dependent decreases in expansion over 7 days (supplemental Figure 8A-B). However, upon tumor restimulation in the absence of GSI, CD19 CAR T cells produced similar levels of IFN-γ as CAR T cells cultured without GSI (supplemental Figure 8C-D). These data suggest that GSI dosing in MM patients treated with BCMA CAR T cells may need to be titrated to avoid adverse effects on CAR T-cell function.
GSI increases the antitumor efficacy of BCMA CAR T cells in vivo
To establish an in vivo dose of GSI that would not exceed concentrations where decreases in T-cell function were observed in vitro, NSG mice were administered 2 doses of LY3039478 (1 or 3 mg/kg) 24 hours apart (Figure 7A). Peak serum drug concentrations after the 3 mg/kg dose reached 0.388 to 0.499 μM, in excess of the >0.1 μM concentration that inhibited T-cell function in vitro. In contrast, the 1 mg/kg dose resulted in peak serum concentrations of 0.046 to 0.08 μM, and was selected for further experiments.
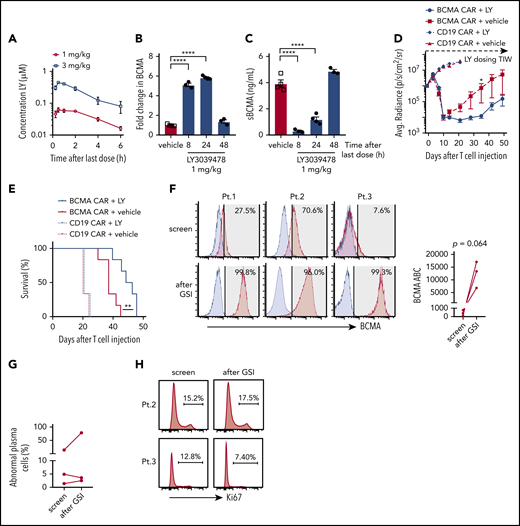
In vivo administration of GSI prevents BCMA shedding and increases BCMA CAR efficacy. (A) Concentration of LY3039478 in peripheral blood of mice at various time points after administration of 2 doses of 1 or 3 mg/kg LY3039478 36 hours apart. (B-C) Mice were engrafted with MM.1R for 27 days, treated with 1 mg/kg LY3039478 (filled circles) or vehicle (open squares) twice 18 hours apart and euthanized at various time points after the second dose. (B) Fold change in BCMA expression on CD138+GFP+ cells from bone marrow was determined, as well as sBCMA levels (C) in peripheral blood serum of mice. (D) Quantified bioluminescence imaging and (E) survival of mice engrafted with MM.1R cells and treated with 7.5 × 10⁵ cells BCMA-CAR or CD19 CAR T cells 20 days after tumor injection; 1 mg/kg LY3039478 or vehicle was administered 3 times a week (TIW) starting at day −1 before T-cell treatment. (F) Staining of BCMA (red histograms) on 3 primary MM samples at screening for enrollment and 4 to 6 hours after 3 doses of 25 mg of LY3039478. LY3039478 was dosed orally on days 1, 3, and 5 and flow cytometry was performed on screen and day 5 samples. Time between the screening and day 5 samples is at most 39 days. Blue histograms depict staining with fluorescence minus 1 (FMO) control. Shaded area indicates positive above background, with BCMA+ percentages in top right corner. BCMA ABC is depicted in the right panel. Plots are gated on abnormal plasma cells of freshly collected BMAs. Significance was tested by the 2-tailed paired Student t test. (G) Percentage of abnormal plasma cells from samples shown in panel F. (H) Ki67 stain on samples from patients 2 and 3. Percentage of Ki67+ cells is depicted. *P < .05 as tested by the Mann-Whitney test. ****P ≤ .0001 as tested by 1-way ANOVA with the Dunnett posttest. **P ≤ 0.01 as tested by the log-rank (Mantel-Cox) test.
In vivo administration of GSI prevents BCMA shedding and increases BCMA CAR efficacy. (A) Concentration of LY3039478 in peripheral blood of mice at various time points after administration of 2 doses of 1 or 3 mg/kg LY3039478 36 hours apart. (B-C) Mice were engrafted with MM.1R for 27 days, treated with 1 mg/kg LY3039478 (filled circles) or vehicle (open squares) twice 18 hours apart and euthanized at various time points after the second dose. (B) Fold change in BCMA expression on CD138+GFP+ cells from bone marrow was determined, as well as sBCMA levels (C) in peripheral blood serum of mice. (D) Quantified bioluminescence imaging and (E) survival of mice engrafted with MM.1R cells and treated with 7.5 × 10⁵ cells BCMA-CAR or CD19 CAR T cells 20 days after tumor injection; 1 mg/kg LY3039478 or vehicle was administered 3 times a week (TIW) starting at day −1 before T-cell treatment. (F) Staining of BCMA (red histograms) on 3 primary MM samples at screening for enrollment and 4 to 6 hours after 3 doses of 25 mg of LY3039478. LY3039478 was dosed orally on days 1, 3, and 5 and flow cytometry was performed on screen and day 5 samples. Time between the screening and day 5 samples is at most 39 days. Blue histograms depict staining with fluorescence minus 1 (FMO) control. Shaded area indicates positive above background, with BCMA+ percentages in top right corner. BCMA ABC is depicted in the right panel. Plots are gated on abnormal plasma cells of freshly collected BMAs. Significance was tested by the 2-tailed paired Student t test. (G) Percentage of abnormal plasma cells from samples shown in panel F. (H) Ki67 stain on samples from patients 2 and 3. Percentage of Ki67+ cells is depicted. *P < .05 as tested by the Mann-Whitney test. ****P ≤ .0001 as tested by 1-way ANOVA with the Dunnett posttest. **P ≤ 0.01 as tested by the log-rank (Mantel-Cox) test.
To determine whether GSI administration upregulated BCMA expression on myeloma cells in vivo, NSG mice were engrafted IV with MM.1R cells and administered 2 doses of LY3039478, RO4929097, or vehicle. Surface BCMA expression on MM.1R harvested from mice 8 hours after the second GSI dose showed a fivefold increase compared with vehicle-treated mice (Figure 7B; supplemental Figure 9A). Serum concentrations of sBCMA dropped below 0.4 ng/mL 8 hours after the second dose of GSI but not after vehicle (Figure 7C; supplemental Figure 9B). GSI effects were transient as both surface BCMA expression and sBCMA returned to baseline within 48 hours of treatment cessation. These kinetics were similar for LY3039478 and RO4929097 and both agents upregulated surface BCMA on tumor cells while reducing levels of sBCMA in peripheral blood.
We focused subsequent experiments on addressing whether GSIs improve antitumor efficacy of BCMA CAR T cells on LY3039478 since this molecule was available for clinical translation. Because BCMA was upregulated for 24 hours after GSI in MM.1R-bearing NSG mice, LY3039478 or vehicle was administered 3 times per week in combination with a single subcurative dose of BCMA or control CD19 CAR T cells. Mice receiving BCMA CAR T cells with either LY3039478 or vehicle showed reduction in tumor bioluminescence on days 7 and 10 (Figure 7D). After day 10, tumors began to progress in mice receiving vehicle, whereas mice receiving LY3039478 had sustained tumor control until day 35, and prolonged survival (Figure 7E). At the time that all mice receiving BCMA CAR T cells alone had died of tumor progression, 60% of animals in the group receiving BCMA CAR T plus LY3039478 were still alive. LY3039478 had no effect on tumor growth in groups treated with control CD19 CAR T cells.
We then asked whether LY3039478 could improve BCMA CAR T-cell efficacy in a second model using RPMI 8226 myeloma cells injected into the flank. By day 42, all mice treated with BCMA CAR T cells alone had progressive tumors, whereas mice that received BCMA CAR plus LY3039478 had cleared tumors completely and remained tumor-free (supplemental Figure 9C-D). Together, these data demonstrate that GSI administration enhances the antitumor efficacy of BCMA-specific CAR T cells in xenograft tumor models.
GSI administration to patients markedly increases BCMA on myeloma cells
To assess whether administering LY3039478 to patients altered BCMA expression on myeloma cells in vivo, we gave 3 oral doses (25 mg each) of LY3039478 over 5 days to 3 patients with refractory MM who were eligible for a clinical trial combining BCMA CAR T cells and GSI (NCT03502577). BCMA expression on myeloma cells was assessed in BMAs obtained prior to and 4 to 6 hours following the third dose of LY3039478. The percentage of BCMA+ MM cells increased from a median of 27.5% to 99.3% and the expression level of BCMA increased a median of 33-fold (range, 8.7-fold to 157-fold) (Figure 7F). The frequency of myeloma cells and expression of Ki67 was not significantly altered, consistent with the lack of a major antitumor effect of GSI in this dosing regimen (Figure 7G-H). Thus, orally administered GSI upregulates BCMA expression and increases the frequency of BCMA+ myeloma cells in MM patients.
Discussion
CAR T cells have shown impressive antitumor activity in clinical trials, but incomplete tumor eradication remains an obstacle.30-32 A factor contributing to recurrent disease is the failure to eliminate tumor cells with low target antigen expression.27,48,53 CARs constructed from scFvs that have higher ligand affinity can facilitate recognition of low antigen-bearing tumor cells in some circumstances, but do not achieve the sensitivity of TCR recognition.48,53 An alternative to improve CAR T-cell efficacy is to increase the target density on tumor cells, and our results show how such a strategy can be applied to BCMA in MM.
BCMA targeting with CAR T-cell and antibody-based approaches is currently in clinical trials,20,28,54-57 and inter- and intrapatient heterogeneity of BCMA expression on myeloma cells poses a barrier to efficacy.27 BCMA is cleaved from tumor cells by GS and the release of sBCMA may contribute to the immunodeficiency in MM by sequestering B-cell activating factor and a proliferation-inducing ligand.58 Our data show that BCMA cleavage can also interfere with CAR T-cell recognition of tumor cells both by lowering target density on the tumor cell and binding of sBCMA to the CAR. Shedding of BCMA is blocked effectively on myeloma cells in vitro and in vivo by exposure to GSIs used in the clinic for treatment of Notch-overexpressing cancers and Alzheimer disease.34,35,46,59 Although mild-to-moderate gastrointestinal toxicity was observed with higher doses of LY3039478,46 blocking of BCMA shedding can be achieved at lower nontoxic doses. Increasing BCMA surface expression on myeloma cells with GSI correlates with increased CAR T-cell effector function in vitro including cytokine release and proliferation, and improved in vivo antitumor activity in preclinical models. Pisklakova et al60 reported that RO4929097 reduced MM growth in a preclinical model by inhibition of Notch signaling, associated with reduced angiogenesis and downregulation of transforming growth factor β1. In our models, we did not observe a direct antitumor effect of GSI, but this might be due to a difference in dosing.
The initial clinical trials targeting BCMA with CAR T cells used stringent criteria for BCMA surface expression (>50% BCMA+) for patient enrollment.26,27 We show that administration of LY3039478 to MM patients with low BCMA expression can result in a marked increase in the frequency of BCMA+ tumor cells and BCMA target density on tumor cells, which may obviate the need to exclude patients with low BCMA expression at baseline, and enhance the therapeutic activity of BCMA-targeting agents in patients with heterogeneous expression. GSI treatment could also be considered for patients with antigen-low relapse after BCMA-targeted therapies, or to restimulate CAR T-cell proliferation at later time points to boost antitumor activity.
There are potential limitations to this strategy that will require careful evaluation in clinical trials. Inhibition of BCMA cleavage by GS is reversible, and if drug exposure is too short, tumor cells may still escape CAR T-cell recognition. We also show that CAR T-cell function can be reversibly inhibited by high concentrations of GSI and it may be necessary to maintain drug concentrations below inhibitory levels when combined with CAR T-cell therapy. It is also possible that upregulating ligand density on tumor cells could cause AICD of CAR T cells or increase the risk of cytokine release syndrome after CAR T-cell infusion. We did not observe increased AICD of CAR T cells in vitro. Clinical management of cytokine release syndrome after CAR T cells has improved with earlier intervention, and preventative agents have been identified,61,62 suggesting that this limitation may be manageable. CAR T cells are a disruptive approach to treating hematologic malignancies, but optimization is necessary to achieve maximal patient benefit. Our study suggests that combining CAR T cells targeting BCMA with a GSI is a promising approach to improve tumor cell elimination in MM, and we have initiated a clinical trial combining GSI with BCMA CAR T cells (NCT03502577).
Raw data and protocols will be provided upon request to sriddell@fhcrc.org.
The online version of this article contains a data supplement.
The publication costs of this article were defrayed in part by page charge payment. Therefore, and solely to indicate this fact, this article is hereby marked “advertisement” in accordance with 18 USC section 1734.
Acknowledgments
The authors thank D. Parilla, M. Jess, and L. King (Shared Resources, Fred Hutchinson Cancer Research Center) for performing mouse experiments; M. Nartea and S. Thomas for sample processing; and M. Biernacki and M. Bleakley for providing control bone marrow plasma samples.
This work was supported by a generous gift from Bard Richmond and grants from the Multiple Myeloma Opportunities in Research and Education (MMORE; D.J.G.), National Institutes of Health, National Cancer Institute grants CA136551 and CA018029 (S.R.R.), as well as research funding from Juno Therapeutics, a Celgene company (D.J.G.).
Authorship
Contribution: M.J.P., T.H., G.O.C., J.J.A., J.K., A.I.S., M.H., M.L.C., A.R., B.K.R.P., L.L., A.J.C., and B.L.W. acquired data (performed experiments or provided samples, plasmids, etc); J.M.V. and Q.W. performed statistical analysis of data; M.J.P., T.H., S.R.R., and D.J.G. conceived and designed the research; M.J.P., T.H., S.R.R., and D.J.G. wrote the paper; and M.J.P., S.R.R., and D.J.G. supervised the study.
Conflict-of-interest disclosure: A patent application covering applications of GSI for cellular therapy has been filed by T.H., S.R.R., and D.J.G. B.K.R.P. is employed by Eli Lilly and Company. A.J.C. has received research funding from Juno Therapeutics, a Celgene company, Janssen, AbbVie, and Sanofi; and has served as a consultant for Celgene. D.J.G. has received research funding and royalties from Juno Therapeutics, a Celgene company, and has served as an advisor to Juno Celgene, GlaxoSmithKline, and Seattle Genetics. S.R.R. is a founder of Juno Therapeutics, a Celgene company, and Lyell Immunopharma, and has served as an advisor to Juno Therapeutics, a Celgene company, Nohla, Adaptive Biotechnologies and Cell Medica. The remaining authors declare no competing financial interests.
The current affiliation for L.L. is School of Life Science, Fudan University, Shanghai, China.
Correspondence: Stanley R. Riddell, Fred Hutchinson Cancer Research Center, 1100 Fairview Ave N, D3-100, Seattle, WA 98109; e-mail: sriddell@fredhutch.org.

This feature is available to Subscribers Only
Sign In or Create an Account Close Modal