

Key Points
We discovered a circRNA, circMYBL2, that regulates FLT3 translation by recruiting PTBP1 to promote FLT3-ITD AML progression.
Targeting circMYBL2 specifically inhibits the proliferation and promotes differentiation of FLT3-ITD AML cells in vitro and in vivo.

Abstract
Internal tandem duplication (ITD) mutations within FMS-like tyrosine kinase-3 (FLT3) occur in up to 30% of acute myeloid leukemia (AML) patients and confer a very poor prognosis. The oncogenic form of FLT3 is an important therapeutic target, and inhibitors specifically targeting FLT3 kinase can induce complete remission; however, relapse after remission has been observed due to acquired resistance with secondary mutations in FLT3, highlighting the need for new strategies to target FLT3-ITD mutations. Recent studies have reported that the aberrant formations of circular RNAs (circRNAs) are biological tumorigenesis-relevant mechanisms and potential therapeutic targets. Herein, we discovered a circRNA, circMYBL2, derived from the cell-cycle checkpoint gene MYBL2. circMYBL2 is more highly expressed in AML patients with FLT3-ITD mutations than in those without the FLT3-ITD mutation. We found that circMYBL2 knockdown specifically inhibits proliferation and promotes the differentiation of FLT3-ITD AML cells in vitro and in vivo. Interestingly, we found that circMYBL2 significantly influences the protein level of mutant FLT3 kinase, which contributes to the activation of FLT3-ITD–dependent signaling pathways. Mechanistically, circMYBL2 enhanced the translational efficiency of FLT3 kinase by increasing the binding of polypyrimidine tract-binding protein 1 (PTBP1) to FLT3 messenger RNA. Moreover, circMYBL2 knockdown impaired the cytoactivity of inhibitor-resistant FLT3-ITD+ cells, with a significant decrease in FLT3 kinase expression, followed by the inactivation of its downstream pathways. In summary, we are the first to reveal a circRNA that specifically influences FLT3-ITD AML and regulates FLT3 kinase levels through translational regulation, suggesting that circMYBL2 may be a potential therapeutic target for FLT3-ITD AML.
Introduction
Acute myeloid leukemia (AML), which derives from the blockage of differentiation and the chaotic proliferation of immature myeloid progenitors, is a genetically diverse and aggressive hematological malignancy.1 Despite advances in therapy and considerable rates of remission, >50% of AML patients experience short-term recurrence accompanied by a reduced treatment response.2 The FMS-like tyrosine kinase 3 (FLT3) gene, often overexpressed in hematopoietic neoplasms, is frequently mutated in AML patients. Notably, the FLT3-ITD mutation, which is triggered by an internal tandem duplication (ITD) of the juxtamembrane domain–coding region, induces autophosphorylation at tyrosine residue Y591 and further induces the constitutive activation of downstream signaling pathways to promote leukemia progression.3,4 Moreover, mutations in the tyrosine kinase domain (TKD; FLT3-TKD mutations) have been described in AML.5,6 The FLT3-ITD mutation is associated with a poorer prognosis and a higher rate of relapse after a shorter duration of remission compared with the effects of other AML subtypes.1,2,7 Although FLT3 inhibitors, especially quizartinib, demonstrate single-agent efficacy by inducing complete remission,8 the utility of these inhibitors has been hampered by acquired resistance with secondary TKD mutations, illustrating the need for additional therapeutic targets.9,10
Accumulating studies have shown that noncoding RNAs (ncRNAs), such as microRNAs (miRNAs) and long noncoding RNAs (lncRNAs), play important roles in carcinogenesis and are expected to be therapeutic targets.11,12 For example, miR-155 was reported to promote FLT3-ITD–induced myeloid expansion and increase the proliferation of hematopoietic stem and progenitor cell compartments by reducing the growth inhibitory effects of the interferon (IFN) response,13 indicating that inhibition of miR-155 may be a promising new therapeutic approach for the treatment of FLT3-ITD AML. circular RNA (circRNA), which originates from prevalent backsplicing, is a newly discovered type of ncRNA that plays important roles in various biological processes, including the occurrence and development of cancers.14-16 circRNA is highly stable due to its circular form that lacks open ends and thus effectively resists degradation induced by exonucleases. Exonic circRNAs, which result from backspliced exons of the parental genes, account for a major portion of the circRNA family. It has been reported that exonic circRNAs preferentially localize to and function in the cytoplasm, where they can serve as miRNA sponges to affect translational processing or directly bind to proteins to regulate protein localization and function. For instance, circFOXO3 influences cell senescence, the cell cycle, and apoptosis by interacting with the antisenescence protein inhibitor of DNA binding 1 (ID-1), the cyclin-dependent kinase 2 (CDK2)-p21 complex, and the p53–murine double minute 2 (MDM2) complex, respectively.17-19
More importantly, a recent study showed that chromosomal translocations associated with cancer generate fusion circRNAs that contribute to cellular transformation and have tumor-promoting properties,20 illustrating that circRNA may be important in cancers harboring chromosomal translocations. In leukemia, circRNAs were also found independently of their parental genes by analyzing their expression patterns.21 However, the functions of circRNAs, especially in AML subtypes with poor prognosis, such as FLT3-ITD AML, remain largely unknown.
In this study, we discovered that circMYBL2, a circRNA generated from the circularization of the cell-cycle checkpoint gene MYBL2, is required for FLT3-dependent leukemia progression, and the knockdown of this circRNA significantly impairs the cytoactivity of FLT3-ITD AML cells, including quizartinib-resistant cells. We showed that circMYBL2 could play a role in the translational control of FLT3 kinase by interacting with the RNA-binding protein polypyrimidine tract-binding protein 1 (PTBP1). circMYBL2 is crucial to FLT3-ITD–mutant AML and may be a valuable therapeutic target in this AML subtype.
Materials and methods
Cell lines and AML samples
Human FLT3-ITD+ cells (MV4-11, MOLM-13), FLT3-ITD– cells (THP-1, HL60, NB4, and ML-2,U937, and K562), and 293t cells were purchased from ATCC and were cultured in RPMI 1640 (HyClone) and Dulbecco modified Eagle medium (HyClone), respectively, with 10% fetal bovine serum (Gibco). All cells were cultured at 37°C in a 5% CO2 atmosphere. The MOLM-13 cell line resistant to quizartinib (MOLM-13-RQ) was established through exposing MOLM-13 to continuous presence of stepwise escalating levels of quizartinib.22 After 3 months, MOLM-13-RQ can stably proliferate in a complete medium containing 40 nM quizartinib, and the D835Y mutation in FLT3 was validated by Sanger sequencing. All clinical samples were obtained with informed consent from the first Affiliated Hospital of Sun Yat-sen University and Guangdong Provincial People’s Hospital. Sample collection was approved by the Hospital’s Protection of Human Subjects Committee. The detailed clinicopathological characteristics of the patients are summarized in supplemental Table 1 (available on the Blood Web site). AML primary samples were cultured in Iscove modified Dulbecco medium containing 15% fetal bovine serum.
Screening circRNA
To seek out circRNAs that specifically influence FLT3-ITD AML progression, we analyzed a circRNA microassay data set GSE94591 from the Gene Expression Omnibus (GEO). As there was a limited number of samples in the data set (contains 3 FLT3-ITD+ and 3 FLT3-ITD– AML samples), we firstly decided to screen out circRNAs that had credible differences (P < .01) in expression level between FLT3-ITD+ and FLT3-ITD– cases, aiming to obtain more credible candidates. After first screening, 373 of 4573 circRNAs were left (supplemental Table 2). Then, we further sought out 28 circRNAs (supplemental Table 3) whose parental gene was previously reported to be associated with leukemia oncogenesis or progression and chose 28 circRNAs for further investigation.
Polysome profiling
Short hairpin RNA (shRNA), including sh-NC, sh-circMYBL2, or sh-PTBP1, constructed MV4-11 or MOLM-13 cells were exposed to cycloheximide (CHX; 200 µg/mL) for 15 minutes, and then 7 × 10⁷ cells were lysed in 300 µL of cytoplasmic lysis buffer containing 20 mM Tris, pH 7.4, 15 mM MgCl2, 200 mM KCl, 1% Triton X-100, 200 µg/mL CHX, 1 mM dithiothreitol, 1 mg/mL heparin, and 40 U/mL RNasin (Promega). Samples were centrifuged at 13 000 rpm at 4°C for 10 minutes. For fractionation, cytoplasmic lysates were loaded into 10% to 45% sucrose gradients and separated by ultracentrifugation with a SW41 rotor (Beckman) at 36 000 rpm at 4°C for 3 hours. Linear sucrose gradients were prepared with a Gradient Master (Biocomp) as indicated by the manufacturer. Distribution of ribosomes on the gradients was recorded using a BioComp Piston Gradient Fractionator equipped with a Bio-Rad Econo UV Monitor (set at 254 nm). RNA extracted from each fraction was used for quantitative reverse transcription polymerase chain reaction (qRT-PCR) analysis. Relative distribution of messenger RNA (mRNA) in each fraction was normalized with the sum of all fractions being 100% of the mRNA.
In vitro studies
RNA isolation, qRT-PCR, immunoblotting, circRNA overexpression vector construction, flow cytometry, colony assays, ribosome profiling and sequencing (GEO number GSE133925), transfer RNA scaffolded streptavidin aptamer (tRSA) RNA pulldown, and fluorescence in situ hybridization (FISH) were performed using standard procedures (see supplemental Methods for details).
Animal models
Five-week-old NOD-SCID mice were maintained under specific pathogen-free conditions in the Laboratory Animal Center of Sun Yat-sen University and procedures were performed according to the institutional ethical guidelines for animal experiments. NOD-SCID mice were randomly split in 3 groups and xenograft leukemia in mice was generated by injecting 5 × 10⁶ sh-NC or sh-circMYBL2 MOLM-13 cells in 150 µL of phosphate-buffered saline (PBS) or PBS alone into the tail vein. Three weeks after inoculation, xenografted mice were euthanized for analysis. Human cell engraftment (hCD45+ cells) in bone marrow (BM), peripheral blood, liver, and spleen was evaluated by flow cytometry (C6 cytometry; BD) or hematoxylin and eosin (H&E) staining performed as described.23 Cell differentiation was assessed in hCD45+ cells by CD11b/CD14 labeling and flow cytometry analysis. The remaining 4 mice were evaluated using the survival assay.
Statistics
Experiments were performed at least 3 times, and 1 representative experiment is shown in the results. Error bars represent the mean plus or minus standard error of the mean. Statistical analysis was performed using the paired or unpaired 2-tailed Student t test (*P < .05; **P < .01; ***P < .001). Kaplan-Meier survival curves for mice and P values were calculated using a log-rank (Mantel-Cox) test.
Results
Identification and characterization of circMYBL2, a circRNA that specifically showed a higher expression level in FLT3-ITD+ AML
To discover circRNAs specifically functioning in FLT3-ITD AML, we analyzed the circRNA microassay data set GSE9459124 to identify circRNAs with significant differences (P < .01) between FLT3-ITD+ and FLT3-ITD– AML patients. A total of 373 of the 4573 circRNAs in GSE94591 exhibited significant differences (P < .01), and 28 of these circRNAs (Figure 1A) were generated from parental genes previously reported to be associated with leukemia development, such as MYBL2,25,26 ZEB1,27,28 CARM1,29 and GLI3.30 Among the 28 candidates, circMYBL2 (known as hsa_circ_0006332) levels were significantly different between FLT3-ITD+ and FLT3-ITD– AML in GSE94591 and showed a higher level of expression in FLT3-ITD patients (P = .00652; supplemental Figure 1A). We further applied 6 FLT3-ITD+ AML patient samples and 45 FLT3-ITD– AML patient samples for further analysis. As shown in Figure 1B, circMYBL2 showed an approximately fivefold higher expression level in FLT3-ITD+ AML patient samples than in FLT3-ITD– samples. This result raises the question of whether the differential expression of circMYBL2 plays a role in the development of FLT3-ITD AML.
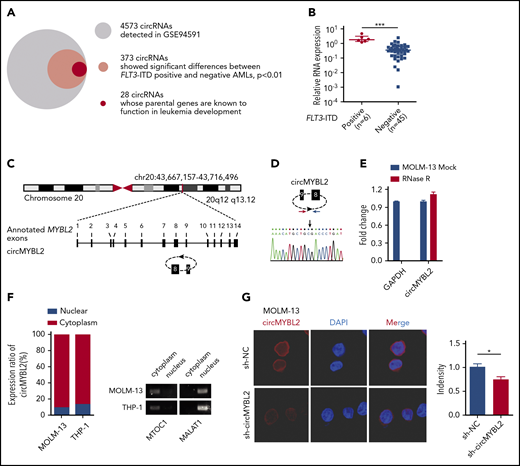
Identification and characterization of circMYBL2 in FLT3-ITD+ AML. (A) Identification of circRNAs having significant differences (P < .01) in FLT3-ITD+ AML compared with FLT3-ITD– AML. (B) Differential expression of circMYBL2 between FLT3-ITD+ and FLT3-ITD– AML patient samples. (C) Structures of the MYBL2 genome and transcript. circMYBL2 is produced by exons 8-9. (D) Identity of the junction point of circMYBL2. (E) RNase R treatment confirmed the circular form of circMYBL2. (F-G) Identification of circMYBL2 cytoplasmic distribution by qRT-PCR analysis and FISH. MTOC1 and MALAT1 were used as the cytoplasmic and nuclear markers, respectively. Cy3 dye and DAPI stain; original magnification ×63. DAPI, 4′,6-diamidino-2-phenylindole; GAPDH, glyceraldehyde-3-phosphate dehydrogenase.
Identification and characterization of circMYBL2 in FLT3-ITD+ AML. (A) Identification of circRNAs having significant differences (P < .01) in FLT3-ITD+ AML compared with FLT3-ITD– AML. (B) Differential expression of circMYBL2 between FLT3-ITD+ and FLT3-ITD– AML patient samples. (C) Structures of the MYBL2 genome and transcript. circMYBL2 is produced by exons 8-9. (D) Identity of the junction point of circMYBL2. (E) RNase R treatment confirmed the circular form of circMYBL2. (F-G) Identification of circMYBL2 cytoplasmic distribution by qRT-PCR analysis and FISH. MTOC1 and MALAT1 were used as the cytoplasmic and nuclear markers, respectively. Cy3 dye and DAPI stain; original magnification ×63. DAPI, 4′,6-diamidino-2-phenylindole; GAPDH, glyceraldehyde-3-phosphate dehydrogenase.
circMYBL2 is a 554-nt circRNA generated from the backsplicing of pre-RNA of the cell-cycle checkpoint gene MYBL2, involving exon 8-9 in reference to hg38, as shown in Figure 1C. The backspliced junction point of circMYBL2 was amplified with outward-facing primers and validated by Sanger sequencing (Figure 1D). To further characterize the circular form of circMYBL2, the exonuclease RNase R was used to examine the stability of this form. circMYL2 showed a strong resistance to digestion by RNase R, whereas the linear RNA of glyceraldehyde-3-phosphate dehydrogenase (GAPDH) was highly degraded (Figure 1E), indicating that circMYBL2 is indeed a circRNA. Nuclear separation experiments with qRT-PCR analysis and FISH showed that circMYBL2 is predominantly localized in the cytoplasm (Figure 1F-G). Together, these data describe the identification of a circRNA, circMYBL2, that shows increased expression levels in FLT3-ITD+ AML patients and may potentially contribute to leukemia progression.
Knockdown of circMYBL2 specifically impairs the proliferation of FLT3-ITD+ AML cells and overcomes acquired resistance to quizartinib
To investigate whether circMYBL2 is specifically required in AML cells harboring the FLT3-ITD mutation, we used small-interfering RNAs (siRNAs) (supplemental Table 4) specifically targeting the backspliced junction point of circMYBL2 to reduce its expression level in 6 myeloid cell lines (Figure 2A; supplemental Figure 1B). No effect on the MYBL2 level in MOLM-13 cells was observed (Figure 2B), suggesting that these siRNAs specifically target the corresponding circRNAs without off-target effects on the parental genes.
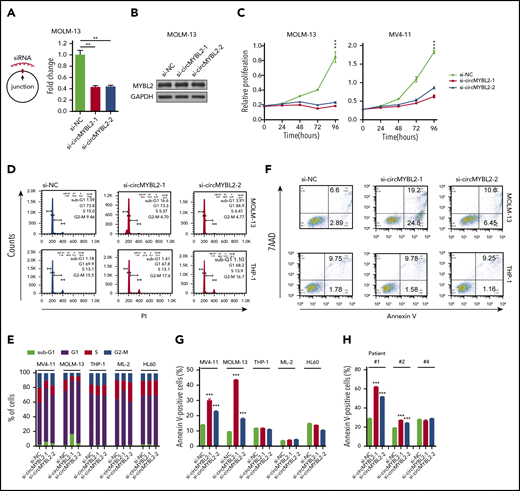
Requirement for circMYBL2 in FLT3-ITD AML cells. (A) Efficient knockdown of circMYBL2 in MOLM-13 cells. (B) Specific si-circMYBL2 did not influence parental gene expression. (C) Effect of circMYBL2 knockdown on proliferation in FLT3-ITD+ cells. (D-E) Flow cytometric analysis of cell-cycle progression in AML cells. The numbers indicate the percentages of cells. (F-G) Flow cytometric analysis of apoptosis. The numbers indicate the percentages of cells. (H) Flow cytometric analysis of apoptosis in primary AML patient cells including FLT3-ITD AML patient cells (#1 and #2), and FLT3-ITD– patient cells (#4). 7AAD, 7-Aminoactinomycin D; sub-G1, sub cell cycle gap 1 phase.
Requirement for circMYBL2 in FLT3-ITD AML cells. (A) Efficient knockdown of circMYBL2 in MOLM-13 cells. (B) Specific si-circMYBL2 did not influence parental gene expression. (C) Effect of circMYBL2 knockdown on proliferation in FLT3-ITD+ cells. (D-E) Flow cytometric analysis of cell-cycle progression in AML cells. The numbers indicate the percentages of cells. (F-G) Flow cytometric analysis of apoptosis. The numbers indicate the percentages of cells. (H) Flow cytometric analysis of apoptosis in primary AML patient cells including FLT3-ITD AML patient cells (#1 and #2), and FLT3-ITD– patient cells (#4). 7AAD, 7-Aminoactinomycin D; sub-G1, sub cell cycle gap 1 phase.
Next, we investigated the effects of circMYBL2 on leukemic cell proliferation and apoptosis. As shown in Figure 2C and supplemental Figure 2A, circMYBL2 knockdown substantially inhibited the proliferation of FLT3-ITD+ cell lines (MOLM-13 and MV4-11) but had a very limited influence on FLT3-ITD– cells, such as THP-1 and HL60, implying that circMYBL2 specifically affects the proliferation of FLT3-ITD leukemic cells. In addition, knockdown of circMYBL2 increased the percentage of cells in sub-G1 and G0/G1 phases and significantly decreased the percentage of FLT3-ITD+ cells in S phase and G2/M phase (Figure 2D-E; supplemental Figure 2B). We next determined the effect of circMYBL2 on apoptosis in FLT3-ITD leukemic cells and found that circMYBL2 suppression caused a dramatic increase in apoptosis, specifically in AML cell lines harboring the FLT3-ITD mutation (Figure 2F-G; supplemental Figure 2C). A similar apoptotic increase was observed in FLT3-ITD+ AML patient cells, and no effects were observed in FLT3-ITD– AML patient cells upon circMYBL2 knockdown (Figure 2H; supplemental Figure 2D). circMYBL2 knockdown also specifically inhibited colony formation in MOLM-13 (Figure 3A; supplemental Figure 2E). Notably, the knockdown of circMYBL2 upregulated CD11b expression and induced a more mature, macrophage-like morphology in MOLM-13 cells but not in wild-type FLT3 AML THP-1 cells (Figure 3B; supplemental Figure 2F). Together, these data show the functional relevance of circMYBL2 in the context of the FLT3-ITD mutation.
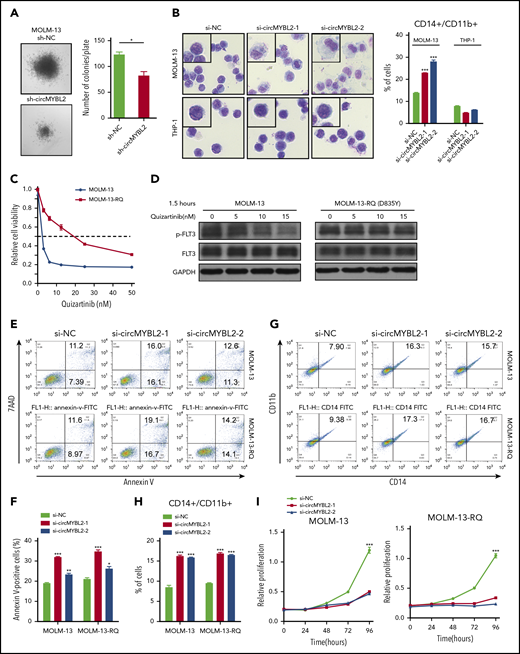
circMYBL2 knockdown impairs the cytoactivity of FLT3-ITD AML cells, including inhibitor-resistant cells. (A) Effect of circMYBL2 suppression in methylcellulose cultures of FLT3-ITD+ AML MOLM-13 cells. (B) Microscopic analysis of Wright-Giemsa–stained cytospin preparations of MOLM-13 and THP-1 cells. Original magnification ×400. Flow cytometric analysis of myeloid differentiation in MOLM-13 and THP-1 cells. The numbers indicate the percentages of cells. (C) Cell viability was measured with a CCK8 assay 48 hours after the addition of quizartinib at the indicated concentration. (D) Western blot measuring p-FLT3 in MOLM-13 or MOLM-13-RQ exposed to quizartinib at the indicated concentration. (E-F) MOLM-13-RQ cells were as sensitive to circMYBL2 knockdown as parental MOLM-13 cells in terms of apoptosis. (G-H) MOLM-13-RQ cells were as sensitive to circMYBL2 knockdown as parental MOLM-13 cells in terms of cell differentiation. (I) MOLM-13-RQ cells were as sensitive to circMYBL2 knockdown as parental MOLM-13 cells in terms of cell proliferation.
circMYBL2 knockdown impairs the cytoactivity of FLT3-ITD AML cells, including inhibitor-resistant cells. (A) Effect of circMYBL2 suppression in methylcellulose cultures of FLT3-ITD+ AML MOLM-13 cells. (B) Microscopic analysis of Wright-Giemsa–stained cytospin preparations of MOLM-13 and THP-1 cells. Original magnification ×400. Flow cytometric analysis of myeloid differentiation in MOLM-13 and THP-1 cells. The numbers indicate the percentages of cells. (C) Cell viability was measured with a CCK8 assay 48 hours after the addition of quizartinib at the indicated concentration. (D) Western blot measuring p-FLT3 in MOLM-13 or MOLM-13-RQ exposed to quizartinib at the indicated concentration. (E-F) MOLM-13-RQ cells were as sensitive to circMYBL2 knockdown as parental MOLM-13 cells in terms of apoptosis. (G-H) MOLM-13-RQ cells were as sensitive to circMYBL2 knockdown as parental MOLM-13 cells in terms of cell differentiation. (I) MOLM-13-RQ cells were as sensitive to circMYBL2 knockdown as parental MOLM-13 cells in terms of cell proliferation.
We next investigated whether circMYBL2 knockdown was effective against FLT3-ITD+ cells resistant to established FLT3 inhibitors. To this end, we continuously exposed MOLM-13 cells to stepwise escalating concentrations of quizartinib22 and established a MOLM-13 cell line resistant to quizartinib (named MOLM-13-RQ). As shown in Figure 3C-D and supplemental Figure 3A-B, MOLM-13-RQ exhibited a high level of resistance to quizartinib. However, under interference with circMYBL2 expression, both MOLM-13-RQ and MOLM-13 cells showed similar apoptosis, differentiation sensitivity, and proliferation inhibition (Figure 3E-I), indicating that circMYBL2 knockdown also impaired the cytoactivity of quizartinib-resistant cells.
circMYBL2 regulates mutant FLT3-ITD protein levels through controlling the translation of FLT3 kinase
We further investigated whether circMYBL2 is associated with FLT3-ITD expression or FLT3 signaling. As shown in Figure 4A, circMYBL2 knockdown leads to substantially reduced levels of FLT3 kinase in cells harboring the FLT3-ITD mutation, with no change (MV4-11 cells) or a slight reduction (MOLM-13 cells) in FLT3 mRNA levels (Figure 4B), similar to a previous report on SYNCRIP,31 which has different effects on the levels of the same target mRNAs in different cell lines. The consistent decrease in the FLT3 kinase level upon circMYBL2 suppression was further shown in primary FLT3-ITD patient cells (Figure 4C-D). circMYBL2 knockdown simultaneously decreased the level of phosphorylated FLT3 (p-FLT3) kinase in ITD mutation cells (Figure 4A,C) and further impaired the phosphorylation of STAT5 (p-STAT5) (Figure 4E-F), which is a specific downstream protein of FLT3 in FLT3-ITD+ AML and is crucial for disease progression.32,33 In addition, the expression of the STAT5-dependent protein c-MYC32,34 was reduced in response to circMYBL2 knockdown in both cell lines and in patient cells (Figure 4E-F), and the overexpression of c-MYC could significantly restore the apoptosis rate induced by circMYBL2 depletion in MV4-11 cells (Figure 4G; supplemental Figure 4A). THP-1, a FLT3-ITD signaling–independent cell line,32 was used as the control to exclude other impacts of circMYBL2 knockdown on c-MYC (supplemental Figure 4B).

circMYBL2 regulates FLT3-ITD–dependent signaling pathways by modulating the translation of mutant FLT3 kinase. (A) Western blot showing downregulation of FLT3 protein expression upon circMYBL2 knockdown in MOLM-13 and MV4-11 cells. (B) qPCR measuring the expression of FLT3 mRNA upon circMYBL2 knockdown in MOLM-13 and MV4-11 cells. (C) Downregulation of FLT3 protein expression upon circMYBL2 knockdown in FLT3-ITD AML patient samples. (D) qPCR measuring the expression of FLT3 mRNA upon circMYBL2 knockdown in FLT3-ITD AML patient samples. (E-F) Western blot showing the downregulation of STAT5 signaling activation upon circMYBL2 knockdown in MOLM-13 and MV4-11 cells and in AML patient samples. (G) Flow cytometric analysis of apoptosis in MV4-11 cells upon circMYBL2 knockdown or c-MYC overexpression. The numbers indicate the percentages of cells. (H) Western blot showing the decrease in FLT3 protein, p-STAT5, and c-MYC levels upon circMYBL2 knockdown in MOLM-13 and MOLM-13-RQ cells. (I) circMYBL2 knockdown reduced the levels of FLT3 kinase harboring the D835Y mutation in an AML patient sample. (J) Polysomes in cytoplasmic extracts of sh-NC and sh-circMYBL2 MV4-11 cells were fractionated through sucrose gradients, and the relative levels of FLT3 mRNA were analyzed by qRT-PCR in the gradient fractions. ns, not significant.
circMYBL2 regulates FLT3-ITD–dependent signaling pathways by modulating the translation of mutant FLT3 kinase. (A) Western blot showing downregulation of FLT3 protein expression upon circMYBL2 knockdown in MOLM-13 and MV4-11 cells. (B) qPCR measuring the expression of FLT3 mRNA upon circMYBL2 knockdown in MOLM-13 and MV4-11 cells. (C) Downregulation of FLT3 protein expression upon circMYBL2 knockdown in FLT3-ITD AML patient samples. (D) qPCR measuring the expression of FLT3 mRNA upon circMYBL2 knockdown in FLT3-ITD AML patient samples. (E-F) Western blot showing the downregulation of STAT5 signaling activation upon circMYBL2 knockdown in MOLM-13 and MV4-11 cells and in AML patient samples. (G) Flow cytometric analysis of apoptosis in MV4-11 cells upon circMYBL2 knockdown or c-MYC overexpression. The numbers indicate the percentages of cells. (H) Western blot showing the decrease in FLT3 protein, p-STAT5, and c-MYC levels upon circMYBL2 knockdown in MOLM-13 and MOLM-13-RQ cells. (I) circMYBL2 knockdown reduced the levels of FLT3 kinase harboring the D835Y mutation in an AML patient sample. (J) Polysomes in cytoplasmic extracts of sh-NC and sh-circMYBL2 MV4-11 cells were fractionated through sucrose gradients, and the relative levels of FLT3 mRNA were analyzed by qRT-PCR in the gradient fractions. ns, not significant.
We also investigated the FLT3 kinase pathway in quizartinib-resistant cells. As shown in Figure 4H and supplemental Figure 4C, circMYBL2 knockdown reduced FLT3 protein expression, decreased p-STAT5 levels in MOLM-13-RQ cells, and downregulated FLT3 kinase expression in an AML patient sample harboring the D835Y mutation, which is insensitive to quizartinib (Figure 4I), suggesting that circMYBL2 suppression could significantly impair the cytoactivity of quizartinib-resistant cells by reducing FLT3-ITD levels. In addition, previous studies have demonstrated that the FLT3-ITD mutation promotes and inhibits the expression of MCL1 and p27/Kip1, respectively, to foster apoptosis resistance and facilitate cell-cycle progression.33,35 Indeed, we found a significant decrease in MCL1 expression and an increase in p27/Kip1 expression in FLT3-ITD+ cells upon circMYBL2 knockdown (supplemental Figure 4D-E), further demonstrating that circMYBL2 suppression impairs the downstream pathways of FLT3-ITD. circMYBL2 knockdown also reduced the level of wild-type FLT3 (supplemental Figure 4F), consistent with previous reports suggesting that FLT3 inhibitors or drugs mediating FLT3 transcription or degradation also influenced wild-type FLT3.32,36
We next investigated the ways in which circMYBL2 regulates the protein levels of FLT3 kinase. Protein stability has been described as 1 of the major factors contributing to protein levels.37 We first used 50 µg/mL CHX to block FLT3 protein synthesis and found no significant differences in the FLT3 protein half-life between sh-NC and sh-circMYBL2 MOLM-13 cells (supplemental Figure 4G), suggesting that circMYBL2 does not affect FLT3 protein stability.
mRNA translation and mRNA stability are other major factors contributing to protein expression levels.38,39 Thus, actinomycin D was used to block transcription to examine RNA stability, and we found that the degradation rate of FLT3 mRNA was equivalent in both MOLM-13 and MV4-11 cells upon circMYBL2 knockdown or control treatment (supplemental Figure 4H). A previous study suggested that circMYBL2 interacts with eIF3A, a key component of the translation initiation complex, by a crosslinking-immunoprecipitation assay (GSE97382),40 implying that circMYBL2 may participate in translational processing. To directly test the possibility that circMYBL2 affects translation, polysome profiling was analyzed. Ribosomes in the cell lysate were divided into small (40S) and large (60S) ribosomal subunits and into monosomes (80S) and polysomes (Figure 4J; supplemental Figure 5B). We observed a significant enrichment of circMYBL2 in the polysome fractions, suggesting that circMYBL2 may influence FLT3 protein levels by controlling its translation (supplemental Figure 5A). Notably, circMYBL2 knockdown did not affect the distribution profile of polysomes, indicating that circMYBL2 does not influence global translation (Figure 4J; supplemental Figure 5B). Silencing of circMYBL2 significantly decreased FLT3 mRNA enrichment in the heavier polysome fractions, altering its distribution from the heavier to the lighter polysome fractions (Figure 4J; supplemental Figure 5B), whereas no change in the distribution profile of Actin mRNA was observed (supplemental Figure 5C). To further examine the influence of circMYBL2 knockdown on FLT3 translation efficiency, we performed ribosome sequencing, which revealed reduced ribosome occupancy on FLT3 mRNA in sh-circMYBL2 MOLM-13 cells relative to sh-NC cells (supplemental Figure 5E), further suggesting that circMYBL2 suppression affects FLT3 translation efficiency. We also found that circMYBL2 knockdown could affect ribosome occupancy efficiency of other genes, which were clustered by gene ontology (GO) analysis (supplemental Figure 5D; supplemental Tables 6 and 7). Altogether, we concluded that translational regulation is 1 of the important regulatory mechanisms by which circMYBL2 influences FLT3 kinase levels.
circMYBL2 directly interacts with the RNA-binding protein PTBP1, a nuclear shuttle protein that affects the proliferation of FLT3-ITD AML cells
We then investigated the mechanism by which circMYBL2 regulates the translation of FLT3 kinase. Cytoplasm-localized ncRNAs might participate in translational regulation by acting as competing endogenous RNAs or interacting with RNA-binding proteins (RBPs). To determine whether circMYBL2 functions as an miRNA sponge, we analyzed argonaut 2 (AGO2) crosslinking immunoprecipitation (GSE97382)40 and found that circMYBL2 does not bind to AGO2. An AGO2 reciprocal immunoprecipitation (RIP) assay further supported this observation (supplemental Figure 6A). Therefore, we next attempted to identify the proteins that interact with circMYBL2. We linearized circMYBL2 and fused the linear transcripts with tRSA41-43 to conduct RNA pulldown assays. circMYBL2 was linearized at the opposite site of the backspliced junction point (Figure 5A). tRSA alone was used as a control. The specific bands or whole eluted proteins enriched more appreciably by linearized circMYBL2 than by tRSA were identified by mass spectrometry (MS) (Figure 5B). A total of 204 and 192 proteins specifically interacting with circMYBL2 were identified (supplemental Tables 8 and 9). Then, we used GO enrichment analysis to cluster and characterize these proteins according to their biological processes (supplemental Figure 6B). Ultimately, 13 proteins associated with either translation or mRNA stability from specific bands were selected as candidates for further validation (Figure 5B). In addition, we found that 7 ribosomal proteins specifically interacted with circMYBL2 (supplemental Table 10), further suggesting that circMYBL2 might participate in translational regulation.
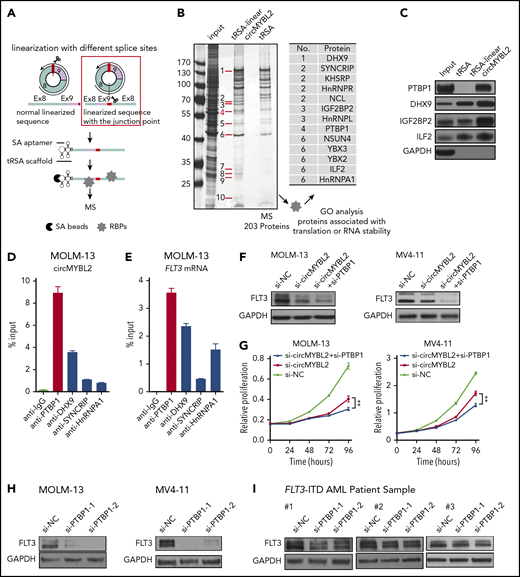
Identification of proteins that interact with circMYBL2. (A) Schematic of circMYBL2 linearization and the tRSA RNA pulldown assay. (B) Identification of translation-associated proteins that interact with circMYBL2 by silver staining and MS. (C) Detection of interactions between circMYBL2 and RBPs by western blot analysis. (D-E) RIP of RBPs using anti-IgG or anti-RBP (PTBP1, DHX9, SYNCRIP, or hnRNPA1) antibodies. The percentage of RIP-enriched circMYBL2 and FLT3 mRNA relative to the input value was calculated by qRT-PCR. (F) Western blot showing the augmented decrease in FLT3 kinase expression upon knockdown of both circMYBL2 and PTBP1 in MOLM-13 and MV4-11 cells. (G) Effect of knockdown of both circMYBL2 and PTBP1 on proliferation. (H-I) Western blot showing downregulation of FLT3 protein expression upon PTBP1 knockdown in MOLM-13 and MV4-11 cells and in FLT3-ITD AML patient samples. SA, streptavidin.
Identification of proteins that interact with circMYBL2. (A) Schematic of circMYBL2 linearization and the tRSA RNA pulldown assay. (B) Identification of translation-associated proteins that interact with circMYBL2 by silver staining and MS. (C) Detection of interactions between circMYBL2 and RBPs by western blot analysis. (D-E) RIP of RBPs using anti-IgG or anti-RBP (PTBP1, DHX9, SYNCRIP, or hnRNPA1) antibodies. The percentage of RIP-enriched circMYBL2 and FLT3 mRNA relative to the input value was calculated by qRT-PCR. (F) Western blot showing the augmented decrease in FLT3 kinase expression upon knockdown of both circMYBL2 and PTBP1 in MOLM-13 and MV4-11 cells. (G) Effect of knockdown of both circMYBL2 and PTBP1 on proliferation. (H-I) Western blot showing downregulation of FLT3 protein expression upon PTBP1 knockdown in MOLM-13 and MV4-11 cells and in FLT3-ITD AML patient samples. SA, streptavidin.
We subsequently found that PTBP1 strongly binds to circMYBL2 relative to the control (Figure 5C). In the following RIP assay, we found that PTBP1 not only interacted with circMYBL2 but also efficiently bound to FLT3 mRNA, in accordance with our RIP results (Figure 5D-E). PTBP1, an RNA-binding protein, modulates different aspects of mRNA metabolism, especially translational regulation. For example, several studies have shown that PTBP1 can regulate cap-independent protein translation or relieve translational inhibition by miRNAs.44,45 To investigate whether the effect of circMYBL2 on FLT3 protein levels is associated with PTBP1, we suppressed PTBP1 to examine its effects on the decrease in FLT3 kinase levels induced by circMYBL2 knockdown. The combination of circMYBL2 and PTBP1 knockdown led to a lower level of FLT3 than that observed with circMYBL2 suppression alone and triggered increased proliferation inhibition in MOLM-13 and MV4-11 cells (Figure 5F-G), suggesting that circMYBL2 affects FLT3 kinase levels by interacting with PTBP1. Moreover, PTBP1 knockdown with siRNA in FLT3-ITD AML cell lines and primary patient cells significantly reduced FLT3 protein levels while inducing variable reductions in FLT3 mRNA levels (Figure 5H-I; supplemental Figure 6C-E), similar to the effects of circMYBL2 knockdown. The same decrease in downstream p-STAT5 was observed in MOLM-13, MV4-11 cells, and primary cells in response to PTBP1 depletion (Figure 6A-B). In addition, we constructed PTBP1 and circMYBL2 overexpression plasmids and found that overexpressing circMYBL2 or PTBP1 increased the FLT3 kinase protein levels in MV4-11 and HL60 AML cells without changing the corresponding mRNA levels (Figure 6C-D; supplemental Figure 6F). Moreover, polysome profiling showed that PTBP1 knockdown significantly reduced the translation of FLT3 mRNA in MV4-11 cells (Figure 6E; supplemental Figure 7). These results suggest that PTBP1 presumably regulates FLT3 kinase levels in part by influencing FLT3 translation.
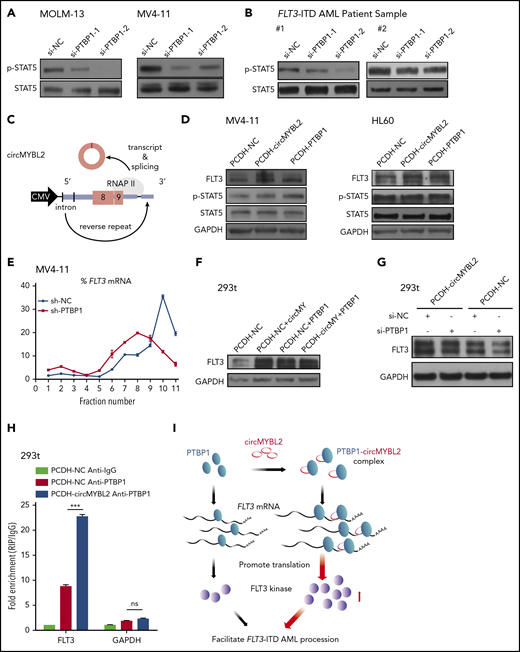
circMYBL2 interacts with PTBP1 to affect FLT3-ITD AML proliferation through promoting FLT3 kinase translation. (A-B) Western blot showing downregulation of STAT5 signaling activation upon PTBP1 knockdown in MOLM-13 and MV4-11 cells and in FLT3-ITD AML patient samples. (C) Schematic of the circMYBL2 overexpression vector. (D) Western blot showing upregulation of FLT3 protein expression upon overexpression of either circMYBL2 or PTBP1 in MV4-11 and HL60 cells. (E) Polysomes in cytoplasmic extracts of MV4-11 cells with PTBP1 knockdown or control treatment were fractionated through sucrose gradients, and the relative levels of FLT3 mRNA in the gradient fractions were analyzed by qRT-PCR. (F) Western blot showing upregulation of FLT3 protein expression upon overexpression of either circMYBL2 or PTBP1 in 293t cells. (G) Western blot measuring FLT3 protein expression in 293t cells with overexpression of circMYBL2 in the presence or absence of si-PTBP1. (H) RIP of PTBP1 using anti-PTBP1 or anti-IgG antibodies in 293t cells in the presence or absence of circMYBL2 overexpression. (I) Schematic depicting the dominant function of circMYBL2 in facilitating the translational efficiency of FLT3 kinase by enhancing the binding of PTBP1 to FLT3 mRNA, specifically promoting FLT3-ITD AML progression. CMV, cytomegalovirus.
circMYBL2 interacts with PTBP1 to affect FLT3-ITD AML proliferation through promoting FLT3 kinase translation. (A-B) Western blot showing downregulation of STAT5 signaling activation upon PTBP1 knockdown in MOLM-13 and MV4-11 cells and in FLT3-ITD AML patient samples. (C) Schematic of the circMYBL2 overexpression vector. (D) Western blot showing upregulation of FLT3 protein expression upon overexpression of either circMYBL2 or PTBP1 in MV4-11 and HL60 cells. (E) Polysomes in cytoplasmic extracts of MV4-11 cells with PTBP1 knockdown or control treatment were fractionated through sucrose gradients, and the relative levels of FLT3 mRNA in the gradient fractions were analyzed by qRT-PCR. (F) Western blot showing upregulation of FLT3 protein expression upon overexpression of either circMYBL2 or PTBP1 in 293t cells. (G) Western blot measuring FLT3 protein expression in 293t cells with overexpression of circMYBL2 in the presence or absence of si-PTBP1. (H) RIP of PTBP1 using anti-PTBP1 or anti-IgG antibodies in 293t cells in the presence or absence of circMYBL2 overexpression. (I) Schematic depicting the dominant function of circMYBL2 in facilitating the translational efficiency of FLT3 kinase by enhancing the binding of PTBP1 to FLT3 mRNA, specifically promoting FLT3-ITD AML progression. CMV, cytomegalovirus.
circMYBL2 recruits PTBP1 to promote FLT3 kinase translation
To further study the functions of circMYBL2 in the regulatory effect of PTBP1 on FLT3 expression, we used 293T cells to investigate the relationship among these molecules with regard to the expression level of FLT3 (supplemental Figure 8A). We observed a prominent reduction in FLT3 protein expression upon circMYBL2 or PTBP1 knockdown and an increase in the expression of this kinase when circMYBL2 or PTBP1 was overexpressed in 293T cells, without a corresponding change in the FLT3 mRNA level (Figure 6F; supplemental Figure 8B-D). Furthermore, PTBP1 knockdown inhibited circMYBL2-induced increases in the FLT3 protein level (Figure 6G), suggesting that the regulation of FLT3 translation by circMYBL2 is partially dependent on PTBP1. We further showed that the interaction between PTBP1 and FLT3 mRNA was notably enhanced by circMYBL2 overexpression, as determined by RIP assay (Figure 6H). In summary, we determined that circMYBL2 regulates the translation of FLT3 kinase by recruiting PTBP1 to bind to FLT3 mRNA and that circMYBL2 strongly enhances FLT3 kinase expression by facilitating the PTBP1-dependent translation of FLT3 protein.
circMYBL2 knockdown impairs the tumorigenesis and infiltration of FLT3-ITD AML cells in vivo
We further addressed the effect of circMYBL2 knockdown in vivo using NOD-SCID mice.46 Male NOD-SCID mice were injected via the tail vein with 5 × 10⁶ MOLM-13 cells with (sh-circMYBL2) or without (sh-NC) circMYBL2 knockdown (supplemental Figure 9A). Leukemia engraftment was confirmed by flow cytometry and smear 3 weeks after inoculation, and the results showed that MOLM-13 cells were present in the BM of mice (Figure 7A). Fewer lymph nodes from sh-circMYBL2–treated mice than from sh-NC–treated mice were observed to have tumor cell infiltration, suggesting that circMYBL2 regulates the infiltration of FLT3-ITD+ cells (Figure 7B). We further assessed the organ infiltration regulated by circMYBL2 via H&E staining. As shown in Figure 7C, compared with sh-NC mice, sh-circMYBL2–treated mice exhibited reduced levels of MOLM-13 in the BM, spleen, and liver, corresponding to a lower degree of disruption in the indicated organs. Consistent with these findings, flow cytometric analysis showed that sh-circMYBL2–treated mice exhibited lower percentages of hCD45+ cells in many organs than sh-NC–treated mice (Figure 7D-E; supplemental Figure 9B). Interestingly, the levels of both CD11b and CD14 were dramatically increased in sh-circMYBL2–treated mice compared with sh-NC–treated mice, indicating that circMYBL2 downregulation is necessary for FLT3-ITD myeloid differentiation (Figure 7D,F). Western blotting showed that the protein levels of FLT3, p-STAT5, and c-MYC in MOLM-13–infiltrated lymph nodes from sh-circMYBL2–treated mice were lower than those from control mice (supplemental Figure 9C). Notably, sh-circMYBL2 significantly extended the survival of the recipients from 26 days for sh-NC–treated mice to 38 days for sh-circMYBL2–treated mice (Figure 7G; P = .0019), suggesting that circMYBL2 knockdown inhibits FLT3-ITD leukemia progression. Moreover, circMYBL2 knockdown also improved overall survival in mice engrafted with quizartinib-resistant MOLM13-RQ cells (Figure 7H; supplemental Figure 9D). These results show that FLT3-ITD leukemia depends on circMYBL2 targeting the mutant FLT3 kinase and the corresponding kinase pathway for myeloid maintenance and progression.
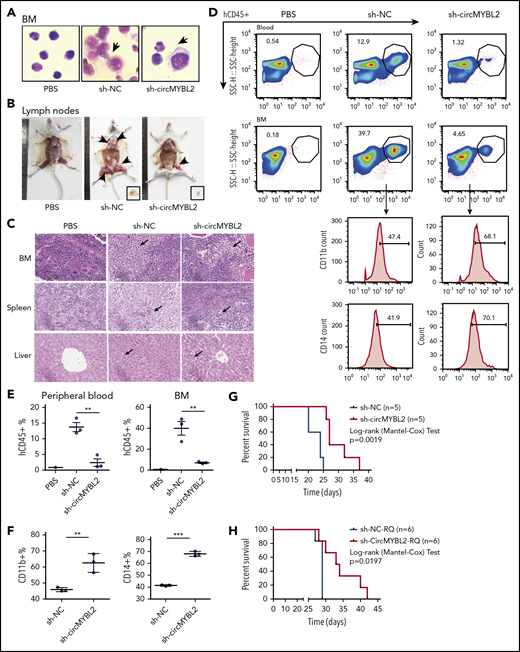
circMYBL2 knockdown impairs the tumorigenesis and infiltration of FLT3-ITD AML cells in vivo. (A) Wright-Giemsa staining of BM samples isolated from mice engrafted with human MOLM-13 cells cotransfected with sh-NC and sh-circMYBL2. hCD45+ cells in the mice are indicated by the black arrows. Original magnification ×400. (B) Representative images of lymph nodes from control and sh-circMYBL2-MOLM-13–treated mice. Reduced lymph node involvement in sh-circMYBL2-MOLM-13–treated mice compared with sh-NC-MOLM-13–treated control mice. (C) H&E staining showing infiltration of leukemic cells in the BM, spleen, and liver of mice engrafted with sh-circMYBL2 cells compared with that in control mice. hCD45+ cells in the tissues are indicated by the black arrows. (D) Flow cytometry showing substantially decreased levels of blasts in blood and BM samples from mice treated with circMYBL2-knockdown MOLM-13 cells relative to these levels in control mice. CD11b and CD14 marker expression was dramatically increased in sh-circMYBL2-MOLM-13–treated mice compared with that in sh-NC-MOLM-13–treated mice. (E-F) Scatter plots show the statistical values for panel D. (G) Kaplan-Meier survival curves for mice implanted with sh-NC or sh-circMYBL2 MOLM-13 cells (n = 5 mice per group). P values were calculated using a log-rank (Mantel-Cox) test. (H) Kaplan-Meier survival curves for mice implanted with sh-NC or sh-circMYBL2 MOLM-13-RQ cells (n = 6 mice per group). P values were calculated using a log-rank (Mantel-Cox) test. SSC, side scatter.
circMYBL2 knockdown impairs the tumorigenesis and infiltration of FLT3-ITD AML cells in vivo. (A) Wright-Giemsa staining of BM samples isolated from mice engrafted with human MOLM-13 cells cotransfected with sh-NC and sh-circMYBL2. hCD45+ cells in the mice are indicated by the black arrows. Original magnification ×400. (B) Representative images of lymph nodes from control and sh-circMYBL2-MOLM-13–treated mice. Reduced lymph node involvement in sh-circMYBL2-MOLM-13–treated mice compared with sh-NC-MOLM-13–treated control mice. (C) H&E staining showing infiltration of leukemic cells in the BM, spleen, and liver of mice engrafted with sh-circMYBL2 cells compared with that in control mice. hCD45+ cells in the tissues are indicated by the black arrows. (D) Flow cytometry showing substantially decreased levels of blasts in blood and BM samples from mice treated with circMYBL2-knockdown MOLM-13 cells relative to these levels in control mice. CD11b and CD14 marker expression was dramatically increased in sh-circMYBL2-MOLM-13–treated mice compared with that in sh-NC-MOLM-13–treated mice. (E-F) Scatter plots show the statistical values for panel D. (G) Kaplan-Meier survival curves for mice implanted with sh-NC or sh-circMYBL2 MOLM-13 cells (n = 5 mice per group). P values were calculated using a log-rank (Mantel-Cox) test. (H) Kaplan-Meier survival curves for mice implanted with sh-NC or sh-circMYBL2 MOLM-13-RQ cells (n = 6 mice per group). P values were calculated using a log-rank (Mantel-Cox) test. SSC, side scatter.
Discussion
Despite advances in therapy, the 5-year survival rate of AML patients with FLT3-ITD remains very low, only ∼20%.2 FLT3-ITD itself is an important therapeutic target, and several small molecule FLT3 kinase inhibitors have been developed to treat FLT3-mutant AML patients. Although FLT3 inhibitors, especially quizartinib, have demonstrated single-agent efficacy by inducing complete remission, the utility of these agents has been hampered by acquired resistance with secondary TKD mutations, highlighting the necessity of new strategies for targeting FLT3-ITD. In this study, we discovered a circRNA, circMYBL2, which specifically influences FLT3-ITD+ AML progression and whose knockdown significantly impairs the cytoactivity of FLT3-ITD AML cells, including quizartinib-resistant cells. Importantly, we demonstrated that circMYBL2 regulates FLT3 kinase levels and the activation of FLT3-ITD-dependent protumor signaling pathways by enhancing the binding of PTBP1 to FLT3 mRNA, which facilitates FLT3 kinase translation (Figure 6I). We are the first to elucidate a specific onco-circRNA that is essential for the maintenance of FLT3 protein levels through the regulation of FLT3 kinase translation. Depletion of circMYBL2 significantly decreases FLT3 protein levels in FLT3-ITD cells, and in quizartinib-resistant FLT3-ITD+ cells. Acquired resistance to FLT3 inhibitors, such as quizartinib, will undoubtedly become a major challenge in FLT3-ITD AML treatment. In our study, MOLM-13 cells and quizartinib-resistant MOLM-13 cells showed indiscriminate sensitivity to circMYBL2 knockdown, highlighting that circMYBL2 could serve as an alternative therapeutic target for FLT3-ITD AML treatment in the future.
The constitutive activation of FLT3-ITD–dependent protumor signaling pathways is crucial for the progression of this type of AML, and a number of studies have demonstrated the corresponding downstream protumor signaling factors and pathways, including ncRNAs.47,48 For example, miR155 is an oncogene that is specifically upregulated in FLT3-ITD AML compared with non-FLT3-ITD AML. miR155 facilitates FLT3-ITD AML cell proliferation by suppressing Ship1, Cebpb, and PU.1 or by inhibiting the interferon response.13,49,50 Another example is the lncRNA WT1-AS. WT1-AS and the nearby WT1 protein-coding gene were upregulated in AML in the context of the FLT3-ITD mutation, and WT1-AS upregulates WT1 expression through an RNA-RNA interaction to promote the development of FLT3-ITD AML.47,51 However, there are few reports of ncRNAs that directly affect the expression or translation of mutant FLT3 kinase. In this study, we found that circMYBL2 is important for FLT3 kinase translation and that the knockdown of circMYBL2 reduces FLT3 protein levels, which triggers FLT3-ITD signaling, suggesting the clinical value of circMYBL2 in this disease. Due to the complex pathogenesis of FLT3-ITD AML and the limitation on FLT3-ITD–targeted strategies, optional approaches with novel targeted therapies, including circRNA, FLT3 inhibitors, and other drugs, are therefore required, particularly as combination regimens to treat different clinical responses.
Finally, our study revealed a novel mechanism for circRNAs in the context of tumorigenesis. Most studies on circRNAs have demonstrated functions of these molecules as miRNA sponges,14,52,53 as bait that affects protein localization17,54 or as scaffolds that promote interaction between protein complexes.18 In addition, circRNA has recently been implicated in transport,55 transcriptional regulation,56 and translation into a peptide that serves as a template.57 Several ribosome profiles have shown that a large number of circRNAs are bound to ribosomes, a key component of translation. However, most ribosome-binding circRNAs fail to be translated into proteins, suggesting that circRNAs may function through binding to the ribosome. A recent study revealed that circRNA circYAP can negatively regulate the translation of its parental gene.58 Our study is the first to demonstrate a positive regulatory effect of circRNA on the translation of target genes through recruiting RBPs, suggesting that circRNAs may have additional unknown mechanisms that need to be further explored. However, the way in which circMYBL2 facilitates the binding of PTBP1 to FLT3 mRNA remains unclear, and the translational regulation of FLT3 mRNA is possibly a partial function of circMYBL2 or PTBP1 in influencing FLT3 protein levels, considering the changes in FLT3 mRNA levels in MOLM-13 cells with si-circMYBL2 or si-PTBP1 treatment. Further studies are necessary to demonstrate whether circMYBL2 recognizes conserved RNA elements on FLT3 mRNA or whether the structure of PTBP1 could be altered to enhance the interaction between PTBP1 and FLT3 mRNA.
In summary, our studies implicate a circMYBL2-PTBP1 axis in the progression of FLT3-ITD AML that operates by facilitating FLT3/FLT3-ITD protein translation. Our work indicates the importance of circMYBL2 in the progression of AML and illuminates the possibility that circMYBL2 is a potential therapeutic target for this AML subtype in the context of FLT3-ITD mutation with poor prognosis.
RiboSeq data has been deposited to public repositories (GEO) and the accession number is GSE133925.
The online version of this article contains a data supplement.
The publication costs of this article were defrayed in part by page charge payment. Therefore, and solely to indicate this fact, this article is hereby marked “advertisement” in accordance with 18 USC section 1734.
Acknowledgments
This work was supported by National Key R&D Program of China (no. 2017YFA0504400) and National Natural Science Foundation of China (nos. 81770174 and 31700719), and grants from Guangdong Province (no. 2014T70833).
Authorship
Contribution: Y.-M.S. and W.-T.W. designed and performed the research, analyzed data, and wrote the manuscript; Z.-C.Z., T.-Q.C., C.H., Q.P., W.H., K.F., L.-Y.S., and Y.-F.Z. performed the research and analyzed data; X.-Q.L., C.L., and X.D. collected and analyzed clinical data; and Y.-Q.C. designed the research and wrote the manuscript.
Conflict-of-interest disclosure: The authors declare no competing financial interests.
Correspondence: Yue-Qin Chen, School of Life Science, Sun Yat-sen University, Guangzhou 510275, People’s Republic of China; e-mail: lsscyq@mail.sysu.edu.cn.
