

Key Points
Suz12 inactivation cooperates with JAK3 mutant signaling to drive T-ALL development.
JAK3/Suz12 mutant leukemia cells show increased sensitivity to PI3K/mTOR, VEGF receptor, and HSP90 inhibitors.

Abstract
The polycomb repressive complex 2, with core components EZH2, SUZ12, and EED, is responsible for writing histone 3 lysine 27 trimethylation histone marks associated with gene repression. Analysis of sequence data from 419 T-cell acute lymphoblastic leukemia (T-ALL) cases demonstrated a significant association between SUZ12 and JAK3 mutations. Here we show that CRISPR/Cas9-mediated inactivation of Suz12 cooperates with mutant JAK3 to drive T-cell transformation and T-ALL development. Gene expression profiling integrated with ChIP-seq and ATAC-seq data established that inactivation of Suz12 led to increased PI3K/mammalian target of rapamycin (mTOR), vascular endothelial growth factor (VEGF), and WNT signaling. Moreover, a drug screen revealed that JAK3/Suz12 mutant leukemia cells were more sensitive to histone deacetylase (HDAC)6 inhibition than JAK3 mutant leukemia cells. Among the broad genome and gene expression changes observed on Suz12 inactivation, our integrated analysis identified the PI3K/mTOR, VEGF/VEGF receptor, and HDAC6/HSP90 pathways as specific vulnerabilities in T-ALL cells with combined JAK3 and SUZ12 mutations.
Introduction
The polycomb repressive complex 2 (PRC2) consists of 2 main scaffold proteins, SUZ12 and EED, and 1 enzymatic protein, EZH2, which is in some cases substituted by EZH1. The PRC2 complex is responsible for writing the histone 3 lysine 27 trimethylation (H3K27me3) mark,1 implicated in gene repression. In this way, the PRC2 complex enables cells to stabilize cell identity through maintenance of repressive gene expression programs established by lineage-determining transcription factors.2
Mutations in members of the PRC2 complex are found in many cancers and include both gain-of-function and loss-of-function mutations, depending on the tumor type. EZH2 is recurrently overexpressed or amplified in solid tumors, follicular lymphoma, and a subset of melanomas.2,3 In non-Hodgkin lymphoma, activating mutations occur in the catalytic domain of EZH2, leading to an aberrant increase in H3K27me3.4-6 These EZH2 gain-of-function mutations served as a rationale for testing small molecule EZH2 inhibitors for cancer treatment.3,7 In contrast, malignant peripheral nerve sheath tumors, glioblastoma, and melanoma frequently harbor loss-of-function mutations in SUZ12 and/or EED, leading to complete loss of H3K27me3.8 In glioblastoma, loss of H3K27me3 can also occur through a mutation of histone H3 at position K27.9 In myelodysplastic syndrome and myeloproliferative neoplasms, up to 13% of patients carry EZH2 deletions that are associated with a poor prognosis.10,11
In T-cell acute lymphoblastic leukemia (T-ALL), recurrent nonsense and frameshift mutations or deletions occur in EZH2, SUZ12, or EED.12-14 Subsequent functional analyses have focused on the role of EZH2 loss within the aggressive early T-cell precursor (ETP)-ALL subtype. Loss of Ezh2 or Eed was found to cooperate with oncogenic NRAS(Q61K) and loss of Cdkn2a in driving ETP-ALL in a mouse model.15 In another study, Runx1 inactivation together with loss of Ezh2 was found to cause the expansion of ETPs that progressed to an aggressive myeloid/lymphoid leukemia on the addition of Flt3-ITD.16 More recently, Ezh2 loss on a p53 null background was shown to promote ETP-ALL in mice, which was associated with increased DNA hypermethylation and concomitant repression of critical T-cell development genes including Runx1, Bcl11b, and Ptcra (pre-TCRα).17 These studies provide mechanistic insight into the importance of maintaining a functional PRC2 complex, and in particular EZH2, in regulating normal transcriptional programs during early T-cell development. However, no studies to date have evaluated whether mutations within SUZ12 are also an important driver in T-ALL development or maintenance.
Methods
In vivo treatments and compounds
For in vivo treatment studies, mice were injected with 106 leukemia cells. When engraftment was established, mice were randomly assigned into the different treatment groups. Mice were treated 5 days per week until the humane end point was reached. Dactolisib (50 mg/kg/day) and sunitinib (60 mg/kg/day) were orally delivered. Ricolinostat (50 mg/kg/day) and 17-AAG (25 mg/kg/day) were delivered through intraperitoneal injection. All compounds for in vivo treatments were ordered from MedChemExpress.
Flow cytometry
Single-cell suspensions were prepared from peripheral blood, bone marrow, spleen, thymus, or lymph nodes. Cells were analyzed on either a FACSVerse flow cytometer (BD Biosciences) or MACSQuant VYB (Miltenyi). Antibodies used are listed in the supplemental Materials, available on the Blood Web site. Data were analyzed using FlowJo (Tree Star) software to quantify the median fluorescence intensity (MFI) of allophycocyanin (APC) or phycoerythrin (PE).
Drug screening
JAK3(M511I)+Suz12gRNA leukemia cells and JAK3(M511I) leukemia cells were subjected to a drug screen with the Epigenetics Compound Library (Selleckchem L1900). Cells were seeded into 96-well plates at 200 000 cells/mL, and inhibitors were added at 1 μM final concentration, using a mosquito HTS dispenser (TTP Labtech). For single-drug dose response studies, cells were seeded into 96-well plates at 300 000 cells/mL, and the compounds were added using a D300e digital dispenser (Tecan). Cell proliferation was measured after 24 hours, using the ATPlite luminescence system (PerkinElmer) using a Victor multilabel plate reader. Differential drug sensitivity was determined by the J/J+S score, defined as the ratio of dimethyl sulfoxide (DMSO)-normalized viability of JAK3(M511I) leukemia cells divided by DMSO-normalized viability of JAK3(M511I)+Suz12gRNA leukemia cells.
ChIP-seq, ATAC-seq, RNA-seq
ChIPmentation was carried out as previously described, with spike-in controls for normalization.18 The antibodies used are provided in the supplemental Materials. RNA was extracted from tissue and cells, using the Maxwell 16 LEV Simply RNA purification kit (Promega). Next-generation sequencing libraries were constructed from 500 ng of total RNA, using the Truseq RNA sample prep kit v2 (Illumina). The Fast ATAC-seq protocol suitable for primary hematopoietic cells was used.18,19
Gene set enrichment analysis
A ranked gene set enrichment analysis was performed with the BROAD gene set enrichment analysis (GSEA) software. For the RNA sequencing data, the ranked gene lists were constructed from the differential gene expression results, in which the ranking value was calculated as –sign[(log2FC)*log(padj)]. Different gene sets were used, such as those from the Kyoto Encyclopedia of Genes and Genomes (KEGG) pathway database, and custom gene sets such as the genes with a disappearing H3K27me3 peak. Overrepresentation enrichment analyses were performed with the online WEB-based Gene SeT AnaLysis Toolkit (WebGestalt).
Statistics and quantification
All statistical analyses were performed using Prism software (Graphpad). For analysis of the mouse data, survival was calculated using the Kaplan-Meier method, and 2-sided P values were determined by the log-rank (Mantel Cox) test. For quantitative polymerase chain reaction analyses, data are expressed as the mean ± standard deviation (SEM). Comparisons between 2 groups were performed by 2-sided unpaired Student t tests.
Data sharing statement
The RNA-seq and ChIP-seq data have been deposited in the Gene Expression Omnibus database via accession number GSE122496. Raw data and drug scores from the drug screen can be found in the supplemental Materials.
Additional methods are provided in the supplemental Materials.
Results
PRC2 inactivating mutations co-occur with JAK3 mutations in patients with T-ALL
A combined analysis of sequence data from 419 patients with T-ALL13,14 revealed that PRC2 mutations occurred in 14.3% of all T-ALL cases and showed a higher frequency within immature (LYL1/LMO2) and HOXA-positive T-ALL subgroups (supplemental Figure 1A). Focusing on the individual core subunits of the PRC2 complex, a near-equivalent mutation frequency was found for both EZH2 (7.2%) and SUZ12 (6.2%), with slightly fewer mutations in EED (3.8%). These PRC2 mutations were strongly associated with IL7R-JAK-STAT mutations, which included mutations in IL7R, JAK1, JAK3, STAT5A, and STAT5B (P = .0004 for Liu dataset, P = .03 for Vicente dataset; supplemental Figure 1B). The highest significant association was between JAK3 mutations and SUZ12 mutations (P < .001), followed by JAK3 and EED mutations (P = .03; Figure 1A). Mutations in SUZ12 and EED were mainly deletions and nonsense mutations (80%-89%), strongly suggesting that these are loss-of-function mutations, whereas mutations in EZH2 were mainly missense mutations (73%).
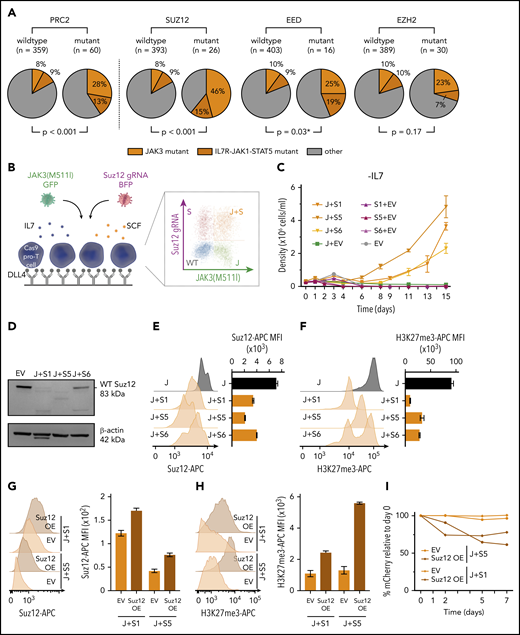
PRC2 mutations co-occur with JAK3 mutations and Suz12 loss cooperates with JAK3(M511I) in vitro. (A) Pie charts comparing the frequency of JAK3 mutations (orange) and IL7R-JAK1-STAT5 mutations (brown) within patients with PRC2 mutant T-ALL vs patients with PRC2 wild-type. Similar pie charts for JAK/STAT mutation frequencies for patients with T-ALL carrying mutations in the 3 different PRC2 components SUZ12, EED, and EZH are shown aside. Using Pearson’s χ-squared test (*) or the Fisher’s exact test, P values were calculated for testing significance of positive association between JAK3 mutations and mutations in PRC2, SUZ12, EZH2, or EED. T-ALL patient data (n = 419). (B) Scheme of ex vivo pro-T-cell culture requiring interleukin 7 (IL7), stem cell factor (SCF), and immobilized Δ-like ligand 4 (DLL4). (C) Cell densities (mean with standard deviation) over time for different IL7-deprived pro-T-cell conditions: JAK3(M511I)+Suz12gRNA TS1, TS5, and TS6 (J+S1, J+S5, J+S6); Suz12 gRNA TS1, TS5, and TS6, always in combination with green fluorescent protein (GFP) empty vector (S1+EV, S5+EV, S6+EV) controls; JAK3(M511I) in combination with blue fluorescent protein (BFP) empty vector (J+EV); and BFP empty+GFP empty vector (EV) controls. (D) Western blot on EV pro-T cells and IL7-independent JAK3(M511I)+Suz12gRNA pro-T cells (J+S1, J+S5, J+S6). β-actin was used as loading control. (E-F) Suz12 protein (E) and H3K27me3 (F) levels were measured by intracellular flow cytometry in IL7-independent JAK3(M511I)+Suz12gRNA pro-T-cells (J+S1, J+S5, J+S6) and JAK3(M511I) (J) pro-T-cells. MFIs were calculated for APC emission. (G-H) Suz12 protein (G) and H3K27me3 (H) levels were measured by intracellular flow cytometry. MFIs were calculated for APC emission. (I) Percentage mCherry relative to d0 was measured over time in IL7-independent J+S1 and J+S5 pro-T-cells that were transduced with mCherry EV or mCherry Suz12 cDNA overexpression (Suz12 OE).
PRC2 mutations co-occur with JAK3 mutations and Suz12 loss cooperates with JAK3(M511I) in vitro. (A) Pie charts comparing the frequency of JAK3 mutations (orange) and IL7R-JAK1-STAT5 mutations (brown) within patients with PRC2 mutant T-ALL vs patients with PRC2 wild-type. Similar pie charts for JAK/STAT mutation frequencies for patients with T-ALL carrying mutations in the 3 different PRC2 components SUZ12, EED, and EZH are shown aside. Using Pearson’s χ-squared test (*) or the Fisher’s exact test, P values were calculated for testing significance of positive association between JAK3 mutations and mutations in PRC2, SUZ12, EZH2, or EED. T-ALL patient data (n = 419). (B) Scheme of ex vivo pro-T-cell culture requiring interleukin 7 (IL7), stem cell factor (SCF), and immobilized Δ-like ligand 4 (DLL4). (C) Cell densities (mean with standard deviation) over time for different IL7-deprived pro-T-cell conditions: JAK3(M511I)+Suz12gRNA TS1, TS5, and TS6 (J+S1, J+S5, J+S6); Suz12 gRNA TS1, TS5, and TS6, always in combination with green fluorescent protein (GFP) empty vector (S1+EV, S5+EV, S6+EV) controls; JAK3(M511I) in combination with blue fluorescent protein (BFP) empty vector (J+EV); and BFP empty+GFP empty vector (EV) controls. (D) Western blot on EV pro-T cells and IL7-independent JAK3(M511I)+Suz12gRNA pro-T cells (J+S1, J+S5, J+S6). β-actin was used as loading control. (E-F) Suz12 protein (E) and H3K27me3 (F) levels were measured by intracellular flow cytometry in IL7-independent JAK3(M511I)+Suz12gRNA pro-T-cells (J+S1, J+S5, J+S6) and JAK3(M511I) (J) pro-T-cells. MFIs were calculated for APC emission. (G-H) Suz12 protein (G) and H3K27me3 (H) levels were measured by intracellular flow cytometry. MFIs were calculated for APC emission. (I) Percentage mCherry relative to d0 was measured over time in IL7-independent J+S1 and J+S5 pro-T-cells that were transduced with mCherry EV or mCherry Suz12 cDNA overexpression (Suz12 OE).
Inactivation of Suz12 cooperates with activating JAK3 mutations to confer interleukin-7-independent growth in pro-T-cells
Given the strong association of JAK3 and SUZ12 mutations in T-ALL (Figure 1A), we initially studied the effects of these mutations in pro-T-cell cultures (Figure 1B). Primary mouse pro-T cells can be cultured ex vivo in the presence of DLL4 (Δ-like ligand 4, activating NOTCH1), SCF (stem cell factor, activating the Kit receptor), and IL7 (interleukin 7, activating the IL7 receptor-JAK-STAT pathway).20,21 We have recently demonstrated that mutations found in T-ALL can confer DLL4, SCF, and/or IL7 independent growth to pro-T cells.19,20,22
We used pro-T-cells derived from a Cas9 transgenic mouse, and the Suz12 gene was inactivated using 3 different CRISPR guide RNAs (gRNAs), selected from a panel of 7 gRNAs (supplemental Figure 2A-D). In pro-T-cells, neither JAK3(M511I) expression alone or inactivation of Suz12 alone was able to confer IL7-independent growth. However, expression of JAK3(M511I) together with the Suz12gRNAs conferred IL7-independent proliferation capability (Figure 1C). The JAK3(M511I)+Suz12gRNA pro-T-cells also showed reduced Suz12 protein levels and decreased H3K27me3 levels (Figure 1D-F), confirming inactivation of Suz12 and PRC2 activity. To test specificity of the Suz12gRNA, a Suz12 cDNA (with mCherry reporter) was re-introduced in IL7-independent JAK3(M511I)+Suz12gRNA pro-T-cells. This restored Suz12 protein and H3K27me3 levels and showed a growth disadvantage compared with untransduced cells (Figure 1G-I). Interestingly, JAK3(M511I) could also cooperate with Eed loss, but not with Ezh2 loss, to drive IL7 independent growth in pro-T cells (supplemental Figure 2E).
Differential gene expression analysis on IL7-independent JAK3(M511I)+Suz12gRNA pro-T-cells vs sorted IL7-dependent JAK3(M511I) pro-T-cells showed up/downregulation of 3748/3408 genes. Analysis of the gene clusters that correspond with IL7, SCF, or DLL4 stimulation20 revealed no global effect on the JAK/STAT cluster (supplemental Figure 2J). Moreover, phospho-STAT5 (p-STAT5) and phospho-STAT3 (p-STAT3) analysis did not show increased phosphorylation of STAT5 or STAT3 when compared with JAK3(M511I) or empty vector (EV) cells (supplemental Figure 2F-G). In contrast, gene cluster analysis revealed a positive enrichment for the genes of the E2f and Myc clusters in Suz12-inactivated cells (supplemental Figure 2H-I). These data indicate that loss of Suz12 can cooperate with JAK3(M511I) to stimulate pro-T-cell growth through multiple pathways, and not through direct effects on the JAK/STAT pathway.
Loss of Suz12 results in decreased H3K27me3 and cooperates with JAK3 activating mutations in driving an aggressive T-ALL in vivo
Having established that JAK3(M511I) and inactivation of Suz12 led to IL7-independent growth of pro-T cells, we next sought to determine whether these co-occurring mutations also cooperate in vivo. To test this, we isolated hematopoietic stem/progenitor cells (HSPCs) from transgenic mice that constitutively express Cas9.23 These cells were transduced with JAK3(M511I), Suz12gRNA (S1 or S5), or JAK3(M511I)+Suz12gRNA. The resulting mixed population of non-, single-, and double-transduced cells were then injected into sublethally irradiated wild-type recipient mice without sorting to assess both oncogenic potential and clonal competition in vivo (Figure 2A).

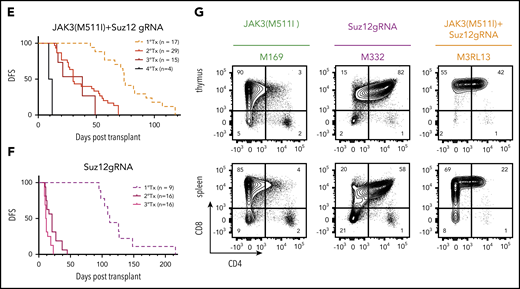
Suz12 loss cooperates with JAK3(M511I) in driving an aggressive T-ALL in vivo. (A) Scheme of bone marrow transplantation set-up. HSPCs were isolated from the bone marrow of Cas9 donor mice, followed by retroviral transduction with constructs overexpressing JAK3(M511I) and/or Suz12gRNA before injection into recipient mice. (B) Clonal evolution of different populations (WT, S, J, J+S) in the blood of a representative JAK3(M511I)+Suz12gRNA mouse (M1R15) over time, showing competitive advantage of J+S cells over other populations. Cell populations: nontransduced (wild-type; WT), Suz12gRNA (S; BFP only), JAK3(M511I) (J; GFP only), and JAK3(M511I)+Suz12gRNA (J+S, BFP+GFP double positive). (C) WBC counts of recipient mice over time for 4 different cohorts: JAK3(M511I)+Suz12gRNA, JAK3(M511I), Suz12gRNA, and control (GFP and BFP empty vectors, EV) mice. A WBC count of 30 000 was used as cutoff for DFS. (D) Survival curve showing DFS of mice in the same 3 cohorts as in C. Mice in which Suz12gRNA-TS5 instead of TS1 was used were designated with a box and darker color. P values were calculated with Gehan-Breslow-Wilcoxon test. (E-F) Survival curves of JAK3(M511I)+Suz12gRNA (E) and Suz12gRNA (F) leukemias that were serially transplanted. (G) Representative flow cytometry stainings for CD8 (APC-Cy7, y-axis) and CD4 (PerCP-Cy5.5, x-axis) of thymus and spleen of leukemia cells (pregated on GFP and/or BFP) from 3 different cohorts at time of sacrifice. For all figures except Fig. 2D, Suz12gRNA TS1 was used in Suz12gRNA and JAK3(M511I)+Suz12gRNA mice.
Suz12 loss cooperates with JAK3(M511I) in driving an aggressive T-ALL in vivo. (A) Scheme of bone marrow transplantation set-up. HSPCs were isolated from the bone marrow of Cas9 donor mice, followed by retroviral transduction with constructs overexpressing JAK3(M511I) and/or Suz12gRNA before injection into recipient mice. (B) Clonal evolution of different populations (WT, S, J, J+S) in the blood of a representative JAK3(M511I)+Suz12gRNA mouse (M1R15) over time, showing competitive advantage of J+S cells over other populations. Cell populations: nontransduced (wild-type; WT), Suz12gRNA (S; BFP only), JAK3(M511I) (J; GFP only), and JAK3(M511I)+Suz12gRNA (J+S, BFP+GFP double positive). (C) WBC counts of recipient mice over time for 4 different cohorts: JAK3(M511I)+Suz12gRNA, JAK3(M511I), Suz12gRNA, and control (GFP and BFP empty vectors, EV) mice. A WBC count of 30 000 was used as cutoff for DFS. (D) Survival curve showing DFS of mice in the same 3 cohorts as in C. Mice in which Suz12gRNA-TS5 instead of TS1 was used were designated with a box and darker color. P values were calculated with Gehan-Breslow-Wilcoxon test. (E-F) Survival curves of JAK3(M511I)+Suz12gRNA (E) and Suz12gRNA (F) leukemias that were serially transplanted. (G) Representative flow cytometry stainings for CD8 (APC-Cy7, y-axis) and CD4 (PerCP-Cy5.5, x-axis) of thymus and spleen of leukemia cells (pregated on GFP and/or BFP) from 3 different cohorts at time of sacrifice. For all figures except Fig. 2D, Suz12gRNA TS1 was used in Suz12gRNA and JAK3(M511I)+Suz12gRNA mice.
A rapid increase in white blood cell (WBC) count was observed in JAK3(M511I)+Suz12gRNA mice with the double-transduced cells (GFP/BFP) outcompeting the other cells (Figure 2B). JAK3(M511I) or Suz12gRNA mice showed a later onset of leukocytosis (Figure 2C). JAK3(M511I)+Suz12gRNA mice (n = 17) had a median disease-free survival (DFS) of 74 days. Suz12gRNA mice developed leukemia with a significantly longer latency (median DFS, 112 days; n = 9; P = .001). Mice transplanted with cells transduced by JAK3(M511I) developed leukemia (DFS, 149 days; n = 10; P = .0002), as previously described24 (Figure 2D; supplemental Figure 3A-B). JAK3(M511I)+Suz12gRNA and Suz12gRNA leukemias were CD8+ or CD4+CD8+ T-ALL and showed efficient transplantability, indicating the presence of high numbers of leukemia-initiating cells (Figure 2E-G; supplemental Figure 3F; supplemental Table 3). Additional characterization of JAK3(M511I)+Suz12gRNA, EedgRNA, or Ezh2gRNA mice is provided in supplemental Figure 3E.
CRISPR/Cas9-mediated gene editing of Suz12 in JAK3(M511I)+Suz12gRNA and Suz12gRNA leukemias was confirmed by polymerase chain reaction and Sanger sequencing (supplemental Figure 4; supplemental Figure 5A). These leukemias carried deletions in the Suz12 gene flanking the gRNA target site ranging from 64 to 257 bp (supplemental Table 5; supplemental Figure 4B-D). At the protein level, loss of Suz12, reduction of H3K27me3, and/or overexpression of JAK3(M511I) was confirmed by western blot and intracellular flow cytometry (supplemental Figure 5B-F).
Suz12 inactivation causes loss of the H3K27me3 repression mark and increased chromatin accessibility
We next sought to determine how the loss of Suz12 contributes to leukemia development by integrating quantitative ChIP-seq, ATAC-seq, and RNA-seq data from the mouse leukemia cells. Inactivation of Suz12 resulted in a global reduction of ChIP-seq signals for both H3K27me3 and Suz12 (Figure 3A-C). Principle component analysis of the differential RNA-seq analysis revealed strong clustering of each of the samples according to genotype and immunophenotype (Figure 3D). Suz12 inactivation led to a large number of significant gene expression changes: 2916 upregulated and 1253 downregulated genes in JAK3(M511I)+Suz12gRNA compared with JAK(M511I); 2566 upregulated and 1967 downregulated genes in Suz12gRNA compared with wild-type (Figure 3E). A ranked GSEA on the differentially expressed genes showed a significant positive enrichment for genes that had a disappearing H3K27me3 peak at the promoter on Suz12 loss (P < .001; Figure 3F). Similarly, these differentially expressed genes also exhibited positive enrichment for appearing ATAC-seq peaks (P < .001; Figure 3G), indicating that upregulation of these genes is associated with increased accessibility of the chromatin at these loci. Ranked GSEA showed a positive enrichment of annotated PRC2 target genes,25 including Hoxa genes, in leukemia samples with Suz12 inactivation (P < .001; Figure 3H-I; supplemental Figure 6).
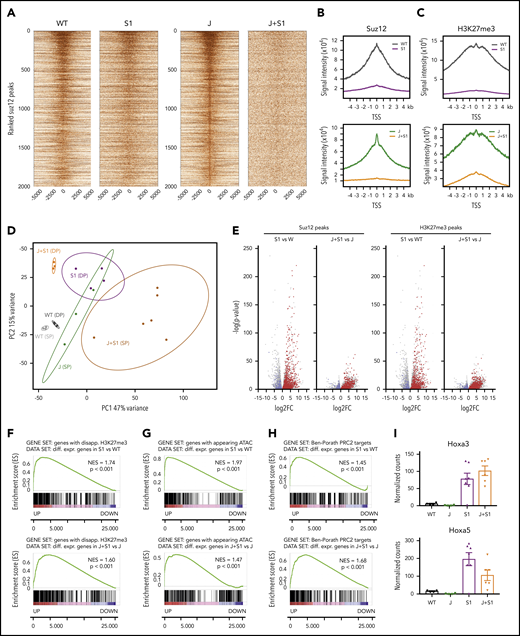
Suz12 inactivation causes loss of the H3K27me3 repression mark and increased chromatin accessibility. (A) Centered heat maps of the ChIP-seq Suz12 signals in the different leukemia conditions, centered on Suz12 peaks in J control leukemias. (B-C) Global Suz12 and H3K27me3 signal densities comparing J+S1 vs J and S1 vs WT. J, JAK3(M511I) leukemia; J+S1, JAK3(M511I)+Suz12gRNA leukemia; S1, Suz12gRNA leukemia; WT, wild-type cells. (D) Principle component analysis (PCA) plot showing clustering of RNA samples according to genotype and immunophenotype (SP = CD8 single positive vs DP = CD8/CD4 double positive). (E) Volcano plots showing the significance of the differential gene expression vs fold change. Red dots are upregulated genes with a disappearing Suz12 (left) or H3K27me3 (right) peak; blue dots are downregulated genes with a disappearing Suz12 (left) or H3K27me3 (right) peak. (F) GSEA showing significant positive enrichment of genes with a disappearing H3K27me3 peak in the ranked list of differentially expressed genes in J+S1 vs J (SP background) and S1 vs WT (DP background). (G) GSEA showing significant positive enrichment of genes with an appearing ATAC-seq peak in the ranked list of differentially expressed genes in J+S1 vs J (SP background) and S1 vs WT (DP background). (H) GSEA showing significant positive enrichment of PRC2 target genes25 in the ranked list of differentially expressed genes in J+S1 vs J (SP background) and S1 vs WT (DP background). NES, normalized enrichment score; p, nominal P value. (I) RNA-seq counts show upregulation of canonical PRC2 targets Hoxa3 and Hoxa5 on Suz12 loss (S1, J+S1). Expression (mean with SEM) is relative to wild-type (WT) levels. P values, calculated with 2-tailed unpaired Student t test, denote significant differences between J+S1 vs J cells and S1 vs J cells.
Suz12 inactivation causes loss of the H3K27me3 repression mark and increased chromatin accessibility. (A) Centered heat maps of the ChIP-seq Suz12 signals in the different leukemia conditions, centered on Suz12 peaks in J control leukemias. (B-C) Global Suz12 and H3K27me3 signal densities comparing J+S1 vs J and S1 vs WT. J, JAK3(M511I) leukemia; J+S1, JAK3(M511I)+Suz12gRNA leukemia; S1, Suz12gRNA leukemia; WT, wild-type cells. (D) Principle component analysis (PCA) plot showing clustering of RNA samples according to genotype and immunophenotype (SP = CD8 single positive vs DP = CD8/CD4 double positive). (E) Volcano plots showing the significance of the differential gene expression vs fold change. Red dots are upregulated genes with a disappearing Suz12 (left) or H3K27me3 (right) peak; blue dots are downregulated genes with a disappearing Suz12 (left) or H3K27me3 (right) peak. (F) GSEA showing significant positive enrichment of genes with a disappearing H3K27me3 peak in the ranked list of differentially expressed genes in J+S1 vs J (SP background) and S1 vs WT (DP background). (G) GSEA showing significant positive enrichment of genes with an appearing ATAC-seq peak in the ranked list of differentially expressed genes in J+S1 vs J (SP background) and S1 vs WT (DP background). (H) GSEA showing significant positive enrichment of PRC2 target genes25 in the ranked list of differentially expressed genes in J+S1 vs J (SP background) and S1 vs WT (DP background). NES, normalized enrichment score; p, nominal P value. (I) RNA-seq counts show upregulation of canonical PRC2 targets Hoxa3 and Hoxa5 on Suz12 loss (S1, J+S1). Expression (mean with SEM) is relative to wild-type (WT) levels. P values, calculated with 2-tailed unpaired Student t test, denote significant differences between J+S1 vs J cells and S1 vs J cells.
Suz12 inactivation causes activation of the PI3K/mTOR, VEGF/VEGFR, and WNT signaling pathways
Overrepresentation enrichment analysis revealed significant enrichment of the cytokine-cytokine receptor interaction (P < .001) and the PI3K/mammalian target of rapamycin (mTOR) (P < .001), the Ras (P < .001), and Wnt (P = .002) pathways as major cancer-related pathways enriched in leukemia cells with Suz12 inactivation (Figure 4A-B). To determine which of these pathways were important for the proliferation and survival of the mouse leukemia cells, these cells were subjected to selective pathway inhibitors. This confirmed important roles for the PI3K/mTOR, vascular endothelial growth factor (VEGF)/VEGF receptor (VEGFR), and WNT pathways (Figure 4C-E), as these showed preferential effects on the JAK3(M511I)+Suz12gRNA or Suz12gRNA leukemia cells compared with JAK3(M511I) or wild-type cells.

Suz12 inactivation causes activation of the PI3K/mTOR, VEGF/VEGFR and WNT signaling pathways. (A) Results of overrepresentation enrichment analysis of the KEGG canonical pathways in the set of upregulated genes in JAK3(M511I)+Suz12gRNA leukemias (J+S1 vs J), ranked according to lowest false discovery rate (FDR). The number of genes within a pathway is indicated in brackets. (B) Similar analysis as in A, but now with the canonical pathways. (C-E) Drug dose response curves showing viability of (leukemia) cells in response to 24 hours of treatment with increasing concentrations of PI3K/mTOR inhibitor dactolisib (C), VEGFR inhibitor sunitinib (D), and WNT inhibitor PKF118-310 (E). HSPC, wild-type hematopoietic stem and progenitor cells; Thy, wild-type thymocytes. For all drug dose response curves, percentage viability is defined as percentage surviving cells relative to DMSO concentration. GI50 values are shown.
Suz12 inactivation causes activation of the PI3K/mTOR, VEGF/VEGFR and WNT signaling pathways. (A) Results of overrepresentation enrichment analysis of the KEGG canonical pathways in the set of upregulated genes in JAK3(M511I)+Suz12gRNA leukemias (J+S1 vs J), ranked according to lowest false discovery rate (FDR). The number of genes within a pathway is indicated in brackets. (B) Similar analysis as in A, but now with the canonical pathways. (C-E) Drug dose response curves showing viability of (leukemia) cells in response to 24 hours of treatment with increasing concentrations of PI3K/mTOR inhibitor dactolisib (C), VEGFR inhibitor sunitinib (D), and WNT inhibitor PKF118-310 (E). HSPC, wild-type hematopoietic stem and progenitor cells; Thy, wild-type thymocytes. For all drug dose response curves, percentage viability is defined as percentage surviving cells relative to DMSO concentration. GI50 values are shown.
Pathway analysis based on gene expression data revealed significant upregulation of the PI3K/mTOR signaling pathway, growth factor receptors, and their adaptors in the JAK3(M511I)+Suz12gRNA leukemia cells compared with JAK3(M511I) cells (Figure 5A). Moreover, ChIP-seq data showed direct Suz12 binding and H3K27me3 at promoters of Pik3cb, encoding PI3K catalytic subunit β, and Akt3. This repression was lost in the leukemias with inactivation of Suz12, associated with increased H3K4me3 levels and increased mRNA expression (Figure 5B). Other genes were not directly bound by Suz12 and are likely to be upregulated by indirect effects. Human T-ALL samples with SUZ12 mutation also showed elevated levels of PI3K signaling genes (supplemental Figure 8A).
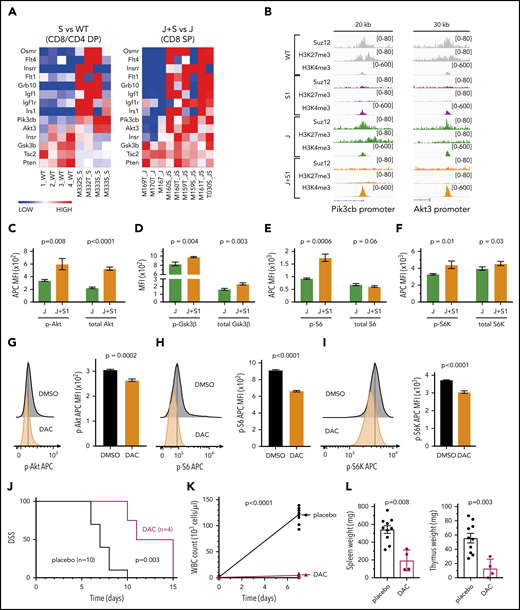
Suz12 loss activates PI3K-AKT-mTOR pathway signaling. (A) Heat map of PI3K/mTOR signaling pathway genes in leukemias with Suz12 inactivation (J+S1 vs J and S1 vs WT), gene expression is shown as normalized read counts. (B) ChIP-seq tracks showing Suz12, H3K27me3, and H3K4me3 signals in S1 vs WT and J+S1 vs J conditions for the Pik3cb and Akt3 promoter. (C-F) Quantifications of MFI with SEM of phosphorylation (p-) levels and (total) protein levels of key components of the PI3K-AKT-mTOR signaling pathway: Akt (C), GSK3β (D), S6 (E), and S6K (F). P values, calculated with 2-tailed unpaired Student t test, denote significant differences between J+S1 and J cells. All MFI measurements were in APC, except total GSK3β was in PE. (G-I) Flow cytometry plots and quantifications of MFI with SEM of phosphorylation levels of Akt (G), S6 (H), and S6K (I) in J+S1 leukemia cells treated for 3 hours with 1 μM dactolisib (DAC). P values, calculated with 2-tailed unpaired Student t test, denote significant differences between DMSO and DAC. (J) Survival curve showing disease-specific survival (DSS) of J+S1 leukemia mice treated with DAC. The P value was calculated with Gehan-Breslow-Wilcoxon test. (K) WBC counts of J+S1 mice after 5 days of treatment. The P value, calculated with a 2-tailed unpaired Student t test, denotes a significant difference between DAC and placebo. (L) Weights of spleen and thymus of J+S1 leukemic mice at time of sacrifice. P values, calculated with 2-tailed unpaired Student t test, denote significant differences between placebo and DAC.
Suz12 loss activates PI3K-AKT-mTOR pathway signaling. (A) Heat map of PI3K/mTOR signaling pathway genes in leukemias with Suz12 inactivation (J+S1 vs J and S1 vs WT), gene expression is shown as normalized read counts. (B) ChIP-seq tracks showing Suz12, H3K27me3, and H3K4me3 signals in S1 vs WT and J+S1 vs J conditions for the Pik3cb and Akt3 promoter. (C-F) Quantifications of MFI with SEM of phosphorylation (p-) levels and (total) protein levels of key components of the PI3K-AKT-mTOR signaling pathway: Akt (C), GSK3β (D), S6 (E), and S6K (F). P values, calculated with 2-tailed unpaired Student t test, denote significant differences between J+S1 and J cells. All MFI measurements were in APC, except total GSK3β was in PE. (G-I) Flow cytometry plots and quantifications of MFI with SEM of phosphorylation levels of Akt (G), S6 (H), and S6K (I) in J+S1 leukemia cells treated for 3 hours with 1 μM dactolisib (DAC). P values, calculated with 2-tailed unpaired Student t test, denote significant differences between DMSO and DAC. (J) Survival curve showing disease-specific survival (DSS) of J+S1 leukemia mice treated with DAC. The P value was calculated with Gehan-Breslow-Wilcoxon test. (K) WBC counts of J+S1 mice after 5 days of treatment. The P value, calculated with a 2-tailed unpaired Student t test, denotes a significant difference between DAC and placebo. (L) Weights of spleen and thymus of J+S1 leukemic mice at time of sacrifice. P values, calculated with 2-tailed unpaired Student t test, denote significant differences between placebo and DAC.
To verify activation of the PI3K/mTOR pathway, we measured phosphorylation and total protein expression of key signaling components. We observed increased p-Akt resulting from increased expression of Akt (Figure 5C), and increased p-S6K and p-S6, indicative of increased PI3K/mTOR signaling (Figure 5E-F). Phosphorylation of Gsk3β was also increased, leading to inhibition of this negative regulator of the PI3K/mTOR pathway (Figure 5D). No changes in STAT5 or STAT3 activation were detectable in leukemia cells with Suz12 loss, indicating again that Suz12 loss has no direct effect on JAK/STAT signaling (supplemental Figure 8B-C).
Dactolisib also showed strong on-target inhibition on phosphorylation levels of Akt, S6, and S6K (Figures 5G-I). To test in vivo therapeutic efficacy of PI3K-AKT-mTOR inhibition, we treated JAK3(M511I)+Suz12gRNA leukemia mice with dactolisib, which significantly prolonged disease-specific survival of these animals (P = .003; Figure 5J). Mice treated with dactolisib also showed reduced leukemia burden, as illustrated by reduced leukocytosis (P < .0001, Figure 5K) and by reduced spleen and thymus weights (P = .008 and P = .003, respectively, Figure 5L).
In addition to the PI3K/mTOR pathway, many different receptor tyrosine kinases and their ligands were found to be upregulated specifically in the JAK3(M511I)+Suz12gRNA leukemia cells, including the Flt3 promoter that was directly bound by Suz12 (supplemental Figure 9A). Interestingly, both VEGF ligand (Vegfa, Vegfc, Vegfd) and VEGFR (Flt1, Flt4, Kdr) genes were upregulated (Figure 6A), which appeared to be a direct effect of Suz12 loss at the promoter site of Flt1 (VEGFR1) and Vegfa (Figure 6B-D). Importantly, in patients with SUZ12 mutant T-ALL, there was also a significantly increased expression of FLT1, FLT4, VEGFA, and VEGFC (Figure 6E). Inhibition of JAK3(M511I) with tofacitinib was able to reduce Vegfa expression levels, indicating that VEGFA upregulation is caused by cooperation between JAK3 signaling and Suz12 loss (supplemental Figure 9B-C). JAK3(M511I)+Suz12gRNA leukemia mice treated with sunitinib in vivo exhibited a survival advantage (P = .04; Figure 6I). Leukocytosis and spleen weight were also significantly reduced in mice treated with sunitinib (P = .001; Figure 6J-K).

Suz12 loss enhances VEGF/VEGFR signaling. (A) Heat map of cytokine-cytokine receptor interaction genes in leukemias with Suz12 inactivation (J+S1 vs J and S1 vs WT); gene expression is shown as normalized read counts. (B-C) ChIP-seq tracks showing Suz12, H3K27me3, and H3K4me3 signals in S1 vs WT and J+S1 vs J conditions for the Flt1 locus (B) and Vegfa promoter (C). (D) Vegfa mRNA expression measured as fragments per kilobase per million reads mapped (FPKM) values (RNA-seq, upper panel) and Vegfa protein expression quantified as MFI with SEM. P values were calculated with 2-tailed unpaired Student t test. (E) mRNA expression measured as FPKM values (RNA-seq). P values were calculated with 2-tailed Mann-Whitney test. (F-H) Flow cytometry plots and quantifications of MFI with SEM of phosphorylation levels of Akt (F), S6 (G), and S6K (H) in J+S1 leukemia cells treated for 3 hours with 5 μM sunitinib (SUN). P values, calculated with 2-tailed unpaired Student t test, denote significant differences between DMSO vs SUN. (I) Survival curve showing DSS of J+S1 leukemic mice treated with SUN. The P value was calculated with Gehan-Breslow-Wilcoxon test. (J) WBC counts of J+S1 leukemic mice after 5 days of treatment. The P value was calculated with a 2-tailed unpaired Student t test. (K) Weights of spleen and thymus at time of sacrifice of J+S1 leukemic mice treated with SUN vs placebo. P values were calculated with 2-tailed unpaired Student t test.
Suz12 loss enhances VEGF/VEGFR signaling. (A) Heat map of cytokine-cytokine receptor interaction genes in leukemias with Suz12 inactivation (J+S1 vs J and S1 vs WT); gene expression is shown as normalized read counts. (B-C) ChIP-seq tracks showing Suz12, H3K27me3, and H3K4me3 signals in S1 vs WT and J+S1 vs J conditions for the Flt1 locus (B) and Vegfa promoter (C). (D) Vegfa mRNA expression measured as fragments per kilobase per million reads mapped (FPKM) values (RNA-seq, upper panel) and Vegfa protein expression quantified as MFI with SEM. P values were calculated with 2-tailed unpaired Student t test. (E) mRNA expression measured as FPKM values (RNA-seq). P values were calculated with 2-tailed Mann-Whitney test. (F-H) Flow cytometry plots and quantifications of MFI with SEM of phosphorylation levels of Akt (F), S6 (G), and S6K (H) in J+S1 leukemia cells treated for 3 hours with 5 μM sunitinib (SUN). P values, calculated with 2-tailed unpaired Student t test, denote significant differences between DMSO vs SUN. (I) Survival curve showing DSS of J+S1 leukemic mice treated with SUN. The P value was calculated with Gehan-Breslow-Wilcoxon test. (J) WBC counts of J+S1 leukemic mice after 5 days of treatment. The P value was calculated with a 2-tailed unpaired Student t test. (K) Weights of spleen and thymus at time of sacrifice of J+S1 leukemic mice treated with SUN vs placebo. P values were calculated with 2-tailed unpaired Student t test.
Overall, these data illustrate activation of the PI3K/mTOR and VEGF/VEGFR pathways in JAK3(M511I)+Suz12 mutant leukemias, which were associated with sensitivity to dactolisib and sunitinib in vitro and in vivo. Data on the WNT signaling pathway are shown in supplemental Figures 10 and 11.
Leukemias with Suz12 loss are sensitized to inhibitors targeting the HDAC6/HSP90 axis
Complementary to our genetic approach to identify signaling pathways important for JAK3/Suz12 mutant leukemia cells, we also performed a drug screen with 181 inhibitors targeting a variety of epigenetic factors (histone deacetylase [HDAC], DNA methyltransferase [DNMT], bromodomain-containing protein). Ex vivo treatment of JAK3(M511I)+Suz12gRNA vs JAK3(M511I) control leukemia cells revealed differential sensitivity to HDAC6 inhibitors ricolinostat and Nexturastat A (Figure 7A-B), whereas other HDAC inhibitors (n = 29) did not show a strong differential effect. JAK3(M511I)+Suz12gRNA leukemia cells exhibited increased sensitivity (GI50 = 558 nM) compared with JAK3(M511I) leukemia and wild-type cells (GI50 > 3 μM; Figure 7C). HDAC6 is known to promote HSP90 chaperone activity, which may support cancer cells by increasing efficient protein folding.26-29 Therefore, we hypothesized that the selective differential sensitivity of the leukemia cells to HDAC6 inhibitors (and not to other HDAC inhibitors) could be related to this effect on HSP90. We thus treated JAK3(M511I)+Suz12gRNA leukemia cells with HSP90 inhibitors (17-AAG and PU-H71). Indeed, we observed a high sensitivity to HSP90 inhibition of the leukemia cells with Suz12 loss (GI50 = 5.3-160 nM) compared with JAK3(M511I; GI50 > 5 μM; Figure 7D-E). Treatment of the JAK3(M511I)+Suz12gRNA and Suz12gRNA leukemia cells with the HDAC6 inhibitor ricolinostat significantly reduced HSP90 protein levels (Figure 7F-G), whereas JAK3(M511I) leukemia cells exhibited reduced HSP90 levels only at the highest dose of 5 μM (Figure 7H). This confirms the link between HDAC6 and HSP90 and reveals that sensitivity toward HDAC6/HSP90 inhibition is more specific for Suz12 loss.
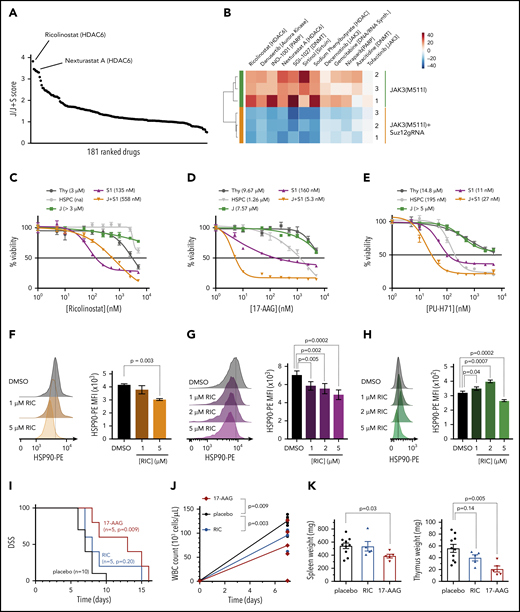
Leukemias with Suz12 loss are sensitive to inhibitors targeting the HDAC6/HSP90 axis. (A) Graph showing results of drug screen performed on JAK3(M511I)+Suz12gRNA (J+S1) vs JAK3(M511I) (J) leukemia cells ex vivo. A total of 181 drugs in screen are ranked according to J/J+S score. J/J+S score is defined as the ratio of the viability of the JAK3(M511I) leukemia cells (J) divided by the viability of the JAK3(M511I)+Suz12gRNA leukemia cells (J+S). (B) Heat map of a selection of 12 drugs from the screen showing differential sensitivity between J+S1 leukemia cells and J leukemia cells. The average viability of the 2 conditions was centered to 0. (C-E) Drug dose response curves showing viability of (leukemia) cells in response to 24 hours of treatment with increasing concentrations of HDAC6 inhibitor ricolinostat (C), HSP90 inhibitor 17-AAG (D), and HSP90 inhibitor PU-H71 (E). Percentage viability is defined as percentage surviving cells relative to DMSO concentration. GI50 values are shown. (F-H) Intracellular flow cytometry plots and quantifications of HSP90-PE MFIs with SEM after overnight (18 hours) treatment with Ricolinostat (RIC: 1, 2, or 5 μM) vs DMSO in J+S1 (F), S1 (G), and J (H) leukemia cells. (I) Survival curve showing DSS of J+S1 leukemic mice treated with RIC, 17-AAG, or placebo. The P values were calculated with Gehan-Breslow-Wilcoxon test. (J) WBC counts of J+S1 leukemic mice after 5 days of treatment. P values were calculated with 2-tailed unpaired Student t tests. (K) Weights of spleen and thymus at time of sacrifice of J+S1 leukemic mice treated with placebo vs RIC or 17-AAG. P values were calculated with 2-tailed unpaired Student t test.
Leukemias with Suz12 loss are sensitive to inhibitors targeting the HDAC6/HSP90 axis. (A) Graph showing results of drug screen performed on JAK3(M511I)+Suz12gRNA (J+S1) vs JAK3(M511I) (J) leukemia cells ex vivo. A total of 181 drugs in screen are ranked according to J/J+S score. J/J+S score is defined as the ratio of the viability of the JAK3(M511I) leukemia cells (J) divided by the viability of the JAK3(M511I)+Suz12gRNA leukemia cells (J+S). (B) Heat map of a selection of 12 drugs from the screen showing differential sensitivity between J+S1 leukemia cells and J leukemia cells. The average viability of the 2 conditions was centered to 0. (C-E) Drug dose response curves showing viability of (leukemia) cells in response to 24 hours of treatment with increasing concentrations of HDAC6 inhibitor ricolinostat (C), HSP90 inhibitor 17-AAG (D), and HSP90 inhibitor PU-H71 (E). Percentage viability is defined as percentage surviving cells relative to DMSO concentration. GI50 values are shown. (F-H) Intracellular flow cytometry plots and quantifications of HSP90-PE MFIs with SEM after overnight (18 hours) treatment with Ricolinostat (RIC: 1, 2, or 5 μM) vs DMSO in J+S1 (F), S1 (G), and J (H) leukemia cells. (I) Survival curve showing DSS of J+S1 leukemic mice treated with RIC, 17-AAG, or placebo. The P values were calculated with Gehan-Breslow-Wilcoxon test. (J) WBC counts of J+S1 leukemic mice after 5 days of treatment. P values were calculated with 2-tailed unpaired Student t tests. (K) Weights of spleen and thymus at time of sacrifice of J+S1 leukemic mice treated with placebo vs RIC or 17-AAG. P values were calculated with 2-tailed unpaired Student t test.
JAK3(M511I)+Suz12gRNA leukemia mice treated with 17-AAG (P = .009) showed prolonged survival compared with placebo, whereas mice treated with ricolinostat (P = .20) succumbed to disease at similar latency as placebo (Figure 7I). 17-AAG treatment also reduced disease burden in terms of WBC count (P = .003; Figure 7J) and organ weight at sacrifice (spleen P = .03; thymus P = .005; Figure 7K).
Discussion
Next-generation sequencing studies have shown that patients with T-ALL carry, on average, more than 10 mutations at diagnosis. This raises the question of whether some of these mutations are found together more frequently than expected. Here, we describe a positive association between PRC2 mutations and mutations in the IL7R-JAK-STAT5 pathway. It has previously been shown that strong genetic associations in human T-ALL are indicative of direct cooperation of oncogenes, and the study of these mechanisms of cooperation can potentially identify new therapeutic avenues.18,19 In the current study, we observed a strong cooperation between inactivation of Suz12 and mutant JAK3 to drive T-ALL development in mice. Suz12 inactivation or JAK3(M511I) alone could cause T-ALL in mouse bone marrow transplant models, and the 2 events together drastically shortened the disease latency. Interestingly, JAK3(M511I) could also cooperate with Eed inactivation, but not with inactivation of Ezh2, which might be explained by compensation by Ezh1.30,31 Also, in patients with T-ALL, JAK/STAT mutations are strongly associated with mutations in SUZ12 and EED, but not with EZH2 mutations (Figure 1A), and our functional data are in agreement with these genetic data.
Previous studies indicated that complete inactivation of Suz12 in the hematopoietic system caused exhaustion of the stem cell pool, whereas heterozygous inactivation of Suz12 enhanced hematopoietic stem cell renewal, but no leukemic transformation was observed.32 Another study showed that partial loss of Suz12 accelerated Eμ-Myc lymphoma.33 These different results are likely to reflect differences in the cell of origin and/or knock-out technology. In contrast to previous studies, we used CRISPR/Cas9 gene editing with retroviral vectors to inactivate Suz12 in a subset of HSPCs. This strategy allowed us to test whether Suz12 knock-out cells could outcompete wild-type cells and drive leukemia development.
The PRC2 complex writes the H3K27me3 histone mark that is associated with transcriptional repression. In our cell and mouse models, inactivation of Suz12 led to a drastic reduction in H3K27me3 levels, indicating that inactivation of Suz12 results in near-complete loss of PRC2 activity. Loss of Suz12 has previously been shown to cause the degradation of the other PRC2 components Eed and Ezh2, leading to destabilization of the PRC2 complex.34 Interestingly, JAK3(M511I)-only leukemias exhibited a slight decrease in H3K27me3 levels (supplemental Figure 5C-F), which is in agreement with the observation that JAK3 can phosphorylate EZH2 at Tyr244, leading to a global but mild reduction in H3K27me3 levels.35 Loss of H3K27me3 levels led to increased expression of the Hoxa cluster genes, including Hoxa9, in the mouse leukemias with Suz12 loss. This increased Hoxa9 expression could directly cooperate with mutant JAK3 signaling, as recently shown,18 and this could be part of the mechanism of cooperation between JAK3 and SUZ12 mutations. However, because the level of Hoxa expression in Suz12gRNA mouse leukemias was still much lower than in HOXA-rearranged T-ALL cases, we believe that Hoxa upregulation alone is unlikely to account for the entire effect of Suz12 inactivation (supplemental Figure 7).
Transcriptome analysis of the mouse leukemia cells showed that inactivation of Suz12 led to the upregulation of the overexpression of thousands of genes. Integration of quantitative ChIP-seq, ATAC-seq, and RNA-seq analysis allowed us to identify genomic loci that had direct loss of H3K27me3 and increased gene expression, as well as pathways that were enriched in the upregulated genes. This identified upregulation of Wnt signaling as a major pathway after Suz12 inactivation. This included both Wnt signaling components, mainly the receptors, and downstream Wnt target genes (supplemental Figures 10 and 11). Similarly, cooperation between loss of the PRC2 scaffold member Eed and a K-Ras(G12D) mutant was also shown to result in a mucinous lung adenocarcinoma with increased expression of Wnt ligands.36 Notably, some of the observed upregulated Wnt target genes after loss of Suz12 are also involved in Notch1 signaling, including Jag1/2, Dll1, and Myc. As Notch1 signaling is a known oncogenic driver in T-ALL, Suz12 loss-mediated upregulation of these targets might also contribute to the cooperation of JAK3 mutations and Suz12 loss. Despite strong upregulation of the WNT signaling pathway on loss of Suz12, we did not observe enhanced sensitivity to currently available WNT pathway inhibitors, potentially also because of the limitations of these inhibitors.
We also identified increased PI3K/mTOR signaling and cytokine-cytokine interaction pathways as major consequences of Suz12 inactivation. Among the upregulated genes, many receptor tyrosine kinases and their ligands were found. One of the few receptor tyrosine kinase genes directly bound by Suz12 was Flt3 (supplemental Figure 9A), which is in line with a recent study that showed upregulation of FLT3 in T-ALL cell lines after EZH2 knock-down.37 JAK3(M511I)+Suz12gRNA leukemia cells also exhibit increased expression of genes involved in PI3K/mTOR signaling. Moreover, negative regulators of this pathway, such as Pten, Gsk3β, and Tsc2, showed a moderate reduction of expression, which may help tilting the balance toward higher PI3K-AKT-mTOR activation. Interestingly, patients with PRC2 mutant T-ALL show a negative enrichment for PI3K/mTOR mutations (supplemental Figure 1B), which may be explained by our finding that these leukemias with SUZ12 loss activate the PI3K/mTOR pathway through gene expression changes instead of gene mutations. Closely related to PI3K/mTOR signaling, we identified activation of the VEGF/VEGFR signaling pathway in leukemias with Suz12 loss, as well as in human T-ALL cases with SUZ12 mutation. Our in vivo results with dactolisib and sunitinib indicate that patients with JAK3/SUZ12 mutant T-ALL could benefit from treatment with these targeted inhibitors. However, further investigation on JAK3/SUZ12 mutant T-ALL patient cells will be required to confirm increased sensitivity of human leukemia cells to these targeted inhibitors.
In a complimentary approach, we tested the effect of 181 inhibitors for differential activity against the JAK3(M511I)+Suz12gRNA and JAK3(M511I) leukemia cells. This screen revealed high sensitivity of leukemia cells with Suz12 inactivation to the HDAC6 inhibitors ricolinostat and nexturastat A, whereas other HDAC inhibitors did not show specificity for the leukemia cells with Suz12 loss. Ricolinostat is currently tested in a clinical trial for multiple myeloma.38 Although HDACs are most known for the deacetylation of histones, several members of this class of enzymes also deacetylate other proteins. HDAC6 is known to regulate and promote the chaperone function of HSP90 through de-acetylation, which is required for proteome homeostasis in cancer cells.26-29,39,40 In our study, JAK3(M511I)+Suz12gRNA leukemia cells were indeed also sensitive to HSP90 inhibitor 17-AAG both in vitro and in vivo, supporting the hypothesis that the sensitivity toward HDAC6 inhibitors could be related to the link with HSP90. In addition, we have observed an increased need for the HSP90 chaperone in mouse T-ALL cells with inactivation of Suz12, which was associated with prolonged survival on in vivo treatment with HSP90 inhibitor 17-AAG. It will be interesting to assess, in further studies, whether patients with JAK3/SUZ12 mutant T-ALL could also benefit from HSP90 inhibitors.
In conclusion, our study illustrates that the inactivation of Suz12 in T-ALL cells cooperates with JAK/STAT signaling and is associated with activation of the PI3K/mTOR, VEGF, and WNT signaling pathways. These data provide insight in the various consequences of Suz12 mutation in T-ALL and demonstrate that inhibitors targeting PI3K/mTOR, VEGFR, and HSP90 may be beneficial for the treatment of patients with T-ALL with JAK/STAT pathway mutations and inactivation of SUZ12.
The RNA-seq and ChIP-seq data have been deposited in the Gene Expression Omnibus (GEO) database via accession number GSE122496. Raw data and drug scores from the drug screen can be found in Supplemental Data available with the online version of this article.
The online version of this article contains a data supplement.
The publication costs of this article were defrayed in part by page charge payment. Therefore, and solely to indicate this fact, this article is hereby marked “advertisement” in accordance with 18 USC section 1734.
Acknowledgments
This work was supported by grants from KU Leuven (C14/18/104), the Swiss Bridge Award, FWO-Vlaanderen, Foundation against Cancer, ERC-consolidator grant (617340) (J.C.). M.B., M.V.B., C.P., and L.A.-S. hold a fellowship of the FWO-Vlaanderen. C.V. is supported by a grant from Asociación Española Contra el Cáncer (Fundación Científica AECC, INVES18061ODER).
Authorship
Contribution: M.B. performed experiments, analyzed data, and wrote the manuscript; C.P. performed experiments and analyzed data, concerning the drug screen and drug treatments; S.D. analyzed all bio-informatic data and wrote the manuscript; M.V.B., L.A.-S., I.L., R.V., N.M., O.G., and K.J. performed experiments and analyzed data; E.G. performed next-generation sequencing (RNA-seq, ChIP-seq, ATAC-seq); C.V. performed statistical analyses; and C.E.d.B. and J.C. supervised and wrote the manuscript.
Conflict-of-interest disclosure: The authors declare no competing financial interests.
Correspondence: Jan Cools, Center for Cancer Biology (VIB), Herestr, Box 912, 3000 Leuven, Belgium; e-mail: jan.cools@kuleuven.vib.be.

This feature is available to Subscribers Only
Sign In or Create an Account Close Modal