

Key Points
MDMs are concentrated in specific types of innate immune cells, CX3CR1+ MNCs, in the BM.
CX3CR1+ MNCs process MDMs to produce inflammatory cytokines to regulate hematopoietic progenitors in the perivascular region.

Abstract
The microbiota regulate hematopoiesis in the bone marrow (BM); however, the detailed mechanisms remain largely unknown. In this study, we explored how microbiota-derived molecules (MDMs) were transferred to the BM and sensed by the local immune cells to control hematopoiesis under steady-state conditions. We reveal that MDMs, including bacterial DNA (bDNA), reach the BM via systemic blood circulation and are captured by CX3CR1+ mononuclear cells (MNCs). CX3CR1+ MNCs sense MDMs via endolysosomal Toll-like receptors (TLRs) to produce inflammatory cytokines, which control the basal expansion of hematopoietic progenitors, but not hematopoietic stem cells, and their differentiation potential toward myeloid lineages. CX3CR1+ MNCs colocate with hematopoietic progenitors at the perivascular region, and the depletion of CX3CR1+ MNCs impedes bDNA influx into the BM. Moreover, the abrogation of TLR pathways in CX3CR1+ MNCs abolished the microbiota effect on hematopoiesis. These studies demonstrate that systemic MDMs control BM hematopoiesis by producing CX3CR1+ MNC–mediated cytokines in the steady-state.
Introduction
The generation of all blood cell lineages, called hematopoiesis, is one of the most essential processes throughout our life that must take place in a highly stable and regular manner.1,2 Nonetheless, the supply of cell types involved in the process of immune reactions must be flexible to cope with various pathophysiological situations like infection and inflammation.3-5 These stress conditions alter hematopoiesis in an organism by augmenting myelopoiesis while suppressing lymphopoiesis.6,7 Several molecules produced by stress, such as cytokines and pathogen-associated molecular patterns (PAMPs), induce the expansion of hematopoietic stem and progenitor cells (HSPCs) and skew their differentiation toward myeloid cells.3,5 It has been investigated whether the basal level of inflammatory signals acts on HSPCs to modulate hematopoiesis under normal steady-state conditions; however, this is not clearly understood.
Mammals have coevolved with various commensal microbes, most of which reside in the intestine. Microbiota have been shown to affect many physiological aspects of various organs beyond the gastrointestinal tract.8 This suggests that hematopoiesis in the bone marrow (BM) may not be an exception; in fact, several studies have elucidated the role of the microbiota in steady-state hematopoiesis. When using germ-free (GF) mice or depleting gut microbiota with antibiotic treatment, mice had altered hematopoiesis in the steady-state. Mice without the microbiota uniformly showed reduced myelopoeisis, resulting in decreases in myeloid lineage cells in the BM, blood, and spleen.9-12 However, the effect of microbiota on lymphopoiesis has been controversial.10-12 The microbiota regulation on hematopoiesis originates from the modulation of early steps of hematopoiesis, including HSPCs,11,12 and is mediated by signaling pathways for pattern recognition receptors, such as MyD88/TICAM and NOD1.10,12 Of note, a recent study suggested that a basal level of STAT1 signaling induced by the microbiota is required for the maintenance of HSPCs and generation of granulocytes.11 These previous studies provide solid evidence that the microbiota play a role in steady-state hematopoiesis; however, many questions remain to be answered: (1) What kind of microbiota-derived molecules (MDMs) are found in the BM?, (2) Are the MDMs disseminated into the whole BM tissue or only to specific areas?, (3) Do MDMs, likely resembling PAMPs, induce inflammatory responses in the BM?, and (4) Do MDMs, like PAMPs, directly regulate HSPCs to enhance myelopoiesis?3,5
Reconstitution of the hematopoietic system under steady-state conditions is achieved by the robust proliferation and differentiation of hematopoietic progenitors that are continuously replenished from hematopoietic stem cells (HSCs).13,14 Therefore, much attention has been focused on how these rare HSPCs are regulated in specific BM niches to achieve a better understanding of steady-state hematopoiesis. Recent studies showed that HSCs and perhaps some early progenitors keep in contact with their niches near the blood vessels in the BM (ie, the arteriole and sinusoid vessels, collectively called the “perivascular niches”).15-17 Given that the microbiota contribute to steady-state hematopoiesis, it is possible that they regulate HSPCs locally at the niches; however, this has not been investigated.
Here, we show that a specific population of innate immune cells, CX3CR1+ mononuclear cells (MNCs), plays an essential role in regulating steady-state hematopoiesis by sensing systemically circulating MDMs through endolysosomal Toll-like receptors (TLRs) and relaying signals to HSPCs. CX3CR1+ MNCs produce low levels of inflammatory cytokines in the BM perivascular region, leading to the basal expansion of hematopoietic progenitors and skewing their differentiation program toward myeloid lineages.
Materials and methods
Additional methods are provided in supplemental Methods (available on the Blood Web site).
Animal studies
All mice were on the C57BL/6 (B6) background and were maintained in a specific pathogen–free (SPF) animal facility at Pohang University of Science and Technology (POSTECH). All animal experiments were performed in accordance with National Institutes of Health guidelines, and protocols were approved by the Institutional Animal Care and Use Committee. GF mice were bred and raised in sterile isolators at the POSTECH GF facility. To recolonize GF mice with microbiota, we cohoused GF mice with SPF mice for 4 weeks. For ablation of CX3CR1+ MNCs, Cd11c-DOG mice were injected intraperitoneally once with 50 ng of diphtheria toxin (DT) per gram of body weight; depletion of CX3CR1+ MNCs was analyzed 24 hours later.
Generation of BM chimeras
For Unc93b13d (3d) mixed-BM chimera, BM cells from CD45.1 wild-type (WT) mice and CD45.2 3d mice (2 × 10⁶ cells each) were mixed and transferred into lethally irradiated CD45.1 × CD45.2 mice. For single-BM chimera, 2 × 10⁶ BM cells from CD45.1 WT mice or CD45.2 3d mice were transferred into lethally irradiated CD45.1 × CD45.2 WT mice or CD45.2 3d mice. For the depletion assay of CX3CR1+ MNCs, BM cells from CD45.1 × CD45.2 Cd11c-DOG mice and CD45.2 WT mice or 3d mice (1 × 10⁶ cells each) were mixed and transferred into CD45.1 mice. At 10 weeks after BM transfer, chimeric mice were injected with DT.
Extracellular vesicle purification, labeling, and transfer
Escherichia coli W3110 extracellular vesicle (EV) isolation was adapted from a previously described protocol for the preparation of EVs from E coli.18 EVs were resuspended and labeled with Vybrant Dil dye (1:100 dilution; V-22887, Molecular Probes). The mixture was incubated for 30 minutes and washed 2 times with distilled water. Mice were injected intraperitoneally or IV with phosphate-buffered saline solution containing labeled EVs (2.85 mg/mL).
Statistical analysis
Statistical analyses were performed using GraphPad Prism 5.0, and data were analyzed with analysis of variance (ANOVA) or 2-tailed unpaired Student t test. P < .05 was considered significant.
Results
Microbiota upregulate hematopoietic progenitors and skew their differentiation potential toward myeloid lineages
To address the role of microbiota in steady-state hematopoiesis, we first analyzed HSPCs in the BM of adult GF mice, which have no microorganisms, compared with the control SPF mice that have microbiota without disease-causing pathogens.18 Notably, a decrease in Lin− Sca1+ cKit+ (LSK) cell number was observed in GF mice that largely resulted from diminution of multipotent progenitors (MPPs) (Figure 1A; supplemental Figure 1). In addition, the number of HPC-2 (hematopoietic progenitor cell-2) cells was decreased, whereas the number of ST (short-term)-HSCs was increased, in GF mice. However, the number of HSCs in GF mice was comparable to that in SPF mice. To determine whether these alterations in HSPCs in GF mice are reversible, GF mice were conventionalized by cohousing them with SPF mice (CoH-GF) for 4 weeks. Conventionalization restored LSK cells in GF mice, and among them MPPs are mainly recovered, indicating that the microbiota indeed contributed to this change in the MPPs (Figure 1A). Together, these data demonstrate that the microbiota control the HSPC population size in the steady-state, especially at the level of restricted progenitors like MPPs. Consistent with previous reports,9,10 the GF mice had a selective defect in myelopoiesis, with a lower number of granulocyte-macrophage progenitors (GMPs) and myeloid lineage cells in the BM compared with SPF mice (supplemental Figure 2). These results verify that the microbiota maintain steady-state myelopoiesis.
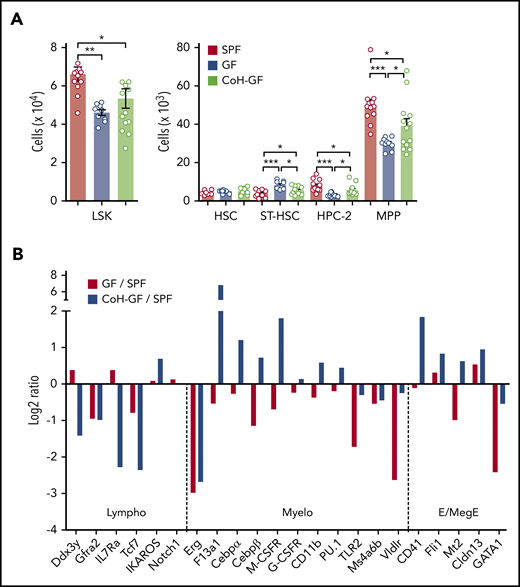
Microbiota increase MPPs and regulate their differentiation toward the myeloid lineage. (A) Numbers of LSK cells and further separation of HSPCs into HSC, ST-HSC, HPC-2, and MPP cells in the BM of SPF, GF, and CoH-GF mice (n = 10-14). Each circle represents an individual mouse. (B) Relative expression of genes related to each lineage differentiation in the MPP population. Data are presented as log2 fold changes in mRNA levels measured by reverse-transcription quantitative polymerase chain reaction (GF/SPF and CoH-GF/SPF) with cells pooled from 6 to 8 mice per group. Data are pooled from 2 independent experiments (A) and are representative of 2 independent experiment with similar results (B). Data are mean ± standard error of the mean. *P < .05, **P < .01, ***P < .001, 1-way ANOVA with Bonferroni multiple comparison. E/MegE, erythroid/megakaryocytic-erythroid; Lympho, lymphoid; Myelo, myeloid.
Microbiota increase MPPs and regulate their differentiation toward the myeloid lineage. (A) Numbers of LSK cells and further separation of HSPCs into HSC, ST-HSC, HPC-2, and MPP cells in the BM of SPF, GF, and CoH-GF mice (n = 10-14). Each circle represents an individual mouse. (B) Relative expression of genes related to each lineage differentiation in the MPP population. Data are presented as log2 fold changes in mRNA levels measured by reverse-transcription quantitative polymerase chain reaction (GF/SPF and CoH-GF/SPF) with cells pooled from 6 to 8 mice per group. Data are pooled from 2 independent experiments (A) and are representative of 2 independent experiment with similar results (B). Data are mean ± standard error of the mean. *P < .05, **P < .01, ***P < .001, 1-way ANOVA with Bonferroni multiple comparison. E/MegE, erythroid/megakaryocytic-erythroid; Lympho, lymphoid; Myelo, myeloid.
Lineage commitment by hematopoietic progenitors is coupled to the acquisition of a particular gene-expression profile.19-22 To further test whether the microbiota prime gene expression of hematopoietic progenitors for the myeloid lineage fate, the genes associated with lineage differentiation were analyzed in MPPs.20,22,23 The expression of myeloid-associated genes decreased in the MPPs of GF mice relative to those of SPF mice (Figure 1B). Meanwhile, the expression of other lineage-associated genes showed no apparent change. Interestingly, recolonizing microbiota in the GF mice restored or elevated gene expression for the myeloid and erythroid/megakaryocytic-erythroid lineage, and lymphoid-associated genes were most notably suppressed. These results suggest that the microbiota increase the number of MPPs and regulate their developmental fate, skewing it toward the myeloid lineage.
TLR signaling pathways in hematopoietic lineage cells regulate hematopoietic progenitors
Toll-like receptors (TLRs) are responsible for sensing the microbiota.24,25 In fact, a previous study has concluded that the microbiota regulate myelopoiesis in the BM via TLRs,10 which led us to examine whether MDMs could regulate expansion of myeloid cells via TLR signaling in the BM. To test this hypothesis, we used MyD88-deficient mice which lack a crucial adaptor molecule governing signaling pathways downstream of all TLRs (with the exception of TLR3)26 and 3d mice that have a missense mutation in UNC93B1 that precludes signal induction by the endolysosomal TLRs, such as TLR3, TLR7, and TLR9.27 Myd88−/− and 3d mice displayed a lower number of myeloid cells in the BM compared with that in control mice (supplemental Figure 3). Moreover, reduced LSK cells in the BM resulted from a selective decrease in HPC-2 and MPPs, but not HSCs, in Myd88−/− and 3d mice (Figure 2A-B). Interestingly, these results are analogous to those observed for the GF mice, suggesting that TLRs play an essential role in promoting MPP expansion during the steady-state. Individual TLR deficiencies did not affect HSPCs, suggesting that the concerted action of multiple TLRs, rather than a single dominant TLR pathway, is required to regulate HSPC homeostasis (supplemental Figure 4).
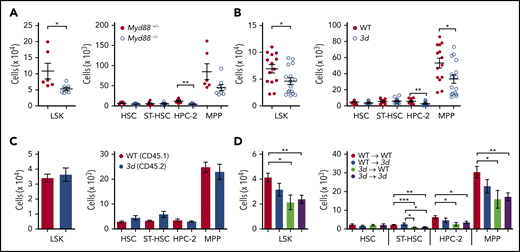
Microbiota indirectly regulate hematopoietic progenitors through TLR pathways in hematopoietic cells. Numbers of LSK cells and HSPC subsets in Myd88−/− mice (n = 6 or 7 mice per group) (A) and 3d mice (n = 14-16 mice per group) (B). (C) HSPC analysis from mixed BM chimeras generated with WT and 3d BM cells. Numbers of HSPCs in the BM from chimeric mice (n = 4-7). (D) HSPC analysis from single BM chimeras. Four groups of chimeric mice were generated: WT→WT, WT→3d, 3d→WT, and 3d→3d. Numbers of HSPCs in the BM chimeric mice (n = 5-7). Data are pooled from 2 (C-D) or >2 (A-B) independent experiments with similar results. Data are mean ± standard error of the mean, and each circle represents an individual mouse. *P < .05, **P < .01, ***P < .001, unpaired 2-tailed Student t test (A-C) or 1-way ANOVA with Bonferroni multiple comparison (D).
Microbiota indirectly regulate hematopoietic progenitors through TLR pathways in hematopoietic cells. Numbers of LSK cells and HSPC subsets in Myd88−/− mice (n = 6 or 7 mice per group) (A) and 3d mice (n = 14-16 mice per group) (B). (C) HSPC analysis from mixed BM chimeras generated with WT and 3d BM cells. Numbers of HSPCs in the BM from chimeric mice (n = 4-7). (D) HSPC analysis from single BM chimeras. Four groups of chimeric mice were generated: WT→WT, WT→3d, 3d→WT, and 3d→3d. Numbers of HSPCs in the BM chimeric mice (n = 5-7). Data are pooled from 2 (C-D) or >2 (A-B) independent experiments with similar results. Data are mean ± standard error of the mean, and each circle represents an individual mouse. *P < .05, **P < .01, ***P < .001, unpaired 2-tailed Student t test (A-C) or 1-way ANOVA with Bonferroni multiple comparison (D).
HSPCs can directly sense PAMPs via their own TLRs.5,28,29 To evaluate whether TLR signaling pathways directly control the expansion of MPPs in a cell-intrinsic manner, mixed BM chimeras were generated using a 1:1 mixture of BM cells from WT and 3d mice. In contrast to the results obtained from 3d mice (Figure 2B), no significant difference was observed in the number of HSPCs derived from WT or 3d BM cells in the mixed BM chimeras (Figure 2C). This suggests that TLR signaling pathways involving UNC93B1 indirectly promote MPP expansion in a cell-extrinsic manner. To further test this possibility, we generated single BM chimeras lacking UNC93B1-dependent TLR signaling in either hematopoietic or nonhematopoietic compartments (Figure 2D). We found that HPC-2 and MPPs were selectively reduced in the chimeras lacking UNC93B1-dependent signaling in hematopoietic cells. Collectively, these results indicate that TLRs in hematopoietic cells, but not in nonhematopoietic cells, might play a role in inducing the steady-state expansion of MPPs in the presence of microbiota.
Microbiota contribute to the steady-state production of inflammatory cytokines that affect hematopoietic progenitors
Cytokines are known to augment myelopoiesis and regulate the expansion of HSPCs in the BM under inflammatory conditions,5,7 which raises a concern about whether the microbiota elicit inflammatory cytokine production in the steady-state BM to affect hematopoiesis. To address this, we determined whether the presence of microbiota regulates the expression of such cytokines in the BM of SPF mice. Interestingly, messenger RNA (mRNA) expression of inflammatory cytokines, such as tumor necrosis factor-α (TNF-α), interleukin-1β (IL-1β), and IL-6, was significantly lower in total BM cells of GF mice than in SPF mice (Figure 3A), but expression of interferons and colony-stimulating factor family cytokines was comparable (data not shown). In line with the mRNA levels, protein levels of 3 inflammatory cytokines in the BM lavage fluids were also reduced in GF mice and largely restored in CoH-GF mice (Figure 3B). These results indicate that the microbiota control the expression of inflammatory cytokines, particularly TNF-α, IL-1β, and IL-6, in the BM, even in steady-state conditions. No inflammatory cytokines were detected in the blood from SPF, GF, or CoH-GF mice (supplemental Figure 5). Therefore, it was concluded that the microbiota induce a tonic level of inflammatory cytokines in the BM in situ without causing systemic inflammation.
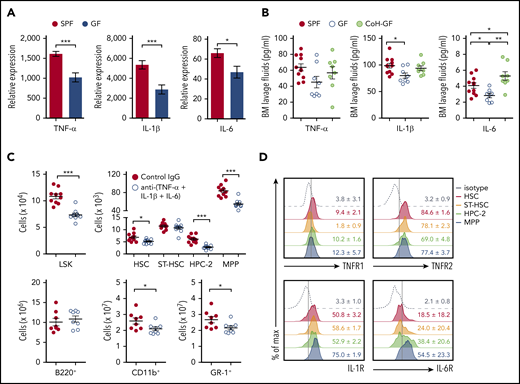
Microbiota-induced inflammatory cytokines expand hematopoietic progenitors. (A) Reverse-transcription quantitative polymerase chain reaction analysis of mRNA expression levels of the indicated inflammatory cytokines in the BM cells of SPF and GF mice (n = 8-10). (B) Quantification of TNF-α, IL-1β, and IL-6 by enzyme-linked immunosorbent assay of the BM lavage fluids from SPF, GF, and CoH-GF mice (n = 8–10). (C) Numbers of HSPCs (n = 10) and lineage cells (n = 8) in the BM of SPF mice injected with a cocktail of neutralizing antibodies against TNF-α, IL-1β, and IL-6. (D) Flow cytometry of cytokine receptor expression by HSPCs of SPF mice. Concatenated graphs of each cell type from 3 or 4 mice. Data are representative of 2 or 3 independent experiments (A-B,D) and are pooled from 2 independent experiments (C). Data are mean ± standard error of the mean, and each circle represents an individual mouse. *P < .05, **P < .01, ***P < .001, unpaired 2-tailed Student t test (A,C) or 1-way ANOVA with Bonferroni multiple comparison (B). IL-1R, IL-1 receptor; IL-6R, IL-6 receptor; TNFR1, TNF receptor 1; TNFR2, TNF receptor 2.
Microbiota-induced inflammatory cytokines expand hematopoietic progenitors. (A) Reverse-transcription quantitative polymerase chain reaction analysis of mRNA expression levels of the indicated inflammatory cytokines in the BM cells of SPF and GF mice (n = 8-10). (B) Quantification of TNF-α, IL-1β, and IL-6 by enzyme-linked immunosorbent assay of the BM lavage fluids from SPF, GF, and CoH-GF mice (n = 8–10). (C) Numbers of HSPCs (n = 10) and lineage cells (n = 8) in the BM of SPF mice injected with a cocktail of neutralizing antibodies against TNF-α, IL-1β, and IL-6. (D) Flow cytometry of cytokine receptor expression by HSPCs of SPF mice. Concatenated graphs of each cell type from 3 or 4 mice. Data are representative of 2 or 3 independent experiments (A-B,D) and are pooled from 2 independent experiments (C). Data are mean ± standard error of the mean, and each circle represents an individual mouse. *P < .05, **P < .01, ***P < .001, unpaired 2-tailed Student t test (A,C) or 1-way ANOVA with Bonferroni multiple comparison (B). IL-1R, IL-1 receptor; IL-6R, IL-6 receptor; TNFR1, TNF receptor 1; TNFR2, TNF receptor 2.
To determine which cytokine is responsible for HSPC homoeostasis in the steady-state, we abolished the activity of TNF-α, IL-1β, or IL-6. However, the number of HSPCs in mice injected with TNF-α, IL-1β, or IL-6 blocking antibody was comparable to that in mice injected with isotype controls (data not shown). Because each of the 3 cytokines is locally produced in the BM at a low level without systemic circulation, HSPC regulation induced by the inflammatory cytokines in SPF mice might be the result of synergistic effects rather than a single effect. Supporting this hypothesis, blocking the 3 cytokines in SPF mice significantly reduced the generation of HPC-2 and MPPs (Figure 3C). Additionally, this blockade decreased the number of myeloid lineage cells. Notably, the levels of cytokine receptors for TNF-α, IL-1β, and IL-6 were higher in MPPs than in other populations, particularly HSCs (Figure 3D). Altogether, these results demonstrate that the microbiota elicit inflammatory cytokines in the BM that maintain the basal levels of hematopoietic progenitors under steady-state conditions.
CX3CR1+ mononuclear cells are the main sources of inflammatory cytokines in the BM
Next, we wondered what type of hematopoietic cells respond to the microbiota for producing cytokines. Assuming that MDMs have some PAMP characteristics and elicit inflammatory cytokines through pattern recognition receptors like TLRs, the candidate cells are from the mononuclear phagocytic system (MPS).7 Based on previous studies,30,31 we can separate the BM MPS, using the expression pattern of CX3CR1-GFP and MHC class II (MHCII), into 3 phenotypically distinct populations (supplemental Figure 6A): CX3CR1+MHCII− monocytes, CX3CR1−MHCII− macrophages, and CX3CR1+MHCIIhi MNCs. Cell surface phenotypes of the 3 populations show relatively clear differences: the prominent expression of Ly6C and CD115 in monocytes; the lack of CX3CR1, but a high level of classical macrophage markers like F4/80 and CD68, in CX3CR1−MHCII− macrophages; and prominent expression of MHCII and CD11c in CX3CR1+ MNCs (supplemental Figure 6B). In particular, CX3CR1+ MNCs show characteristics of both macrophages and dendritic cells, resembling CX3CR1+ macrophages or mononuclear cells classified in the intestine.32,33 Additionally, the mRNA expression of genes associated with cellular differentiation and functions in CX3CR1+ MNCs further suggests that these cells have a monocyte origin and are involved in typical innate immune responses, such as phagocytosis and inflammatory signals (supplemental Figure 6C).
To determine the identity of cells producing inflammatory cytokines in the BM, we sorted each population of BM cells from SPF mice and found that MPS and neutrophils expressed higher levels of cytokines than did other populations (Figure 4). Remarkably, CX3CR1+ MNCs appeared to be the main producers of these cytokines. In general, the cells from GF BM, especially CX3CR1+ MNCs, had lower expression levels for these cytokines that were partially restored by microbiota colonization. To test whether CX3CR1+ MNCs from GF mice have an intrinsic defect in responding MDMs for secreting cytokines, we determined inflammatory cytokine production in CX3CR1+ MNCs isolated from GF and SPF mice by stimulating with lipopolysaccharide in vitro. Lipopolysaccharide increased the mRNA and protein expression levels of each cytokine in CX3CR1+ MNCs from GF mice to similar degrees as in CX3CR1+ MNCs from SPF mice. These results suggest that the decreased inflammatory cytokine production in CX3CR1+ MNCs of GF mice at the steady-state is largely due to the absence of MDMs in the circulation of GF mice (supplemental Figure 6D). Taken together, our data suggest that MDMs are the main stimuli in CX3CR1+ MNCs that elicit inflammatory cytokines in the BM under steady-state conditions.
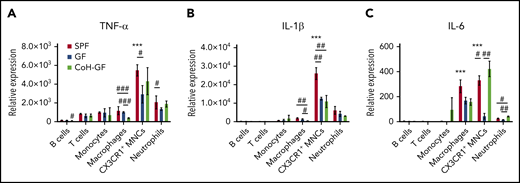
CX3CR1+ MNCs are primary producers for inflammatory cytokines. Reverse-transcription quantitative polymerase chain reaction analysis of mRNA levels of TNF-α (A), IL-1β (B), and IL-6 (C) in the BM cells of SPF, GF, and CoH-GF mice (n = 5-7). Data are representative of 2 independent experiments with similar results (mean ± standard error of the mean). *Versus CX3CR1+ MNCs with other cell types within SPF mice. #Compares the values among SPF, GF, and CoH-GF mice within each cell subtype. */#P < .05, **/##P < .01, ***/###P < .001, 1-way ANOVA with Bonferroni multiple comparison.
CX3CR1+ MNCs are primary producers for inflammatory cytokines. Reverse-transcription quantitative polymerase chain reaction analysis of mRNA levels of TNF-α (A), IL-1β (B), and IL-6 (C) in the BM cells of SPF, GF, and CoH-GF mice (n = 5-7). Data are representative of 2 independent experiments with similar results (mean ± standard error of the mean). *Versus CX3CR1+ MNCs with other cell types within SPF mice. #Compares the values among SPF, GF, and CoH-GF mice within each cell subtype. */#P < .05, **/##P < .01, ***/###P < .001, 1-way ANOVA with Bonferroni multiple comparison.
Microbiota-derived bacterial DNA is systemically circulating and concentrated in CX3CR1+ MNCs from the BM
Given that several MDMs have been identified in various tissues distal to the intestine, there would be a continuous input of MDMs into the systemic circulation beyond the intestinal barrier.10,12,34-36 To identify the existence and origin of MDMs in distal tissues, we exploited metagenomics to detect bacterial DNA (bDNA) in the BM.35,37 bDNA encoding 16S ribosomal RNA genes was detected in the BM of SPF mice compared with control GF mice. The quantity of bDNA in GF mice was recovered in CoH-GF mice (Figure 5A), providing evidence that the bDNA originated from the microbiota. Notably, bDNA was also found in all of the tested organs, with the livers containing the highest levels (supplemental Figure 7A). Next, we determined the identity of bDNA in organs using the intestinal microbiota as a reference. Strikingly, bDNA in most organs was principally derived from the Proteobacteria phylum, which makes a relatively minor contribution to the intestinal microbiota (supplemental Figure 7B). The sharing of bacterial community bDNA in the BM with other distal tissues, but not with the intestine, suggests that systemically circulating MDMs might originate from the same source. Collectively, these results indicate that microbiota-derived bDNA is transported to extraintestinal tissues via the systemic circuit of circulation, where bDNA primarily originates from the Proteobacteria phylum. Next, we addressed whether bDNA accumulates in specific cells in the BM. Among the many cell types in the BM, bDNA was exclusively found in CX3CR1+ MNCs (Figure 5B). Similar to the bacterial composition in whole-BM tissue, bDNA in CX3CR1+ MNCs largely originated from the Proteobacteria phylum (Figure 5C). Collectively, these results provide evidence that bDNA is transferred to organs distal to the intestine under homeostasis conditions via systemic blood circulation. Furthermore, bDNA is selectively captured in the BM by CX3CR1+ MNCs instead of being distributed across many BM cell types.
![Microbiota-derived bDNA is systemically circulating and sensed by BM CX3CR1+ MNCs. (A) Reverse-transcription quantitative polymerase chain reaction analysis of bacterial 16S ribosomal RNA (rRNA) in the BM of SPF, GF, and CoH-GF mice (n = 8-11). (B) Quantification of bacterial 16S rRNA in lineage cells of the BM in SPF mice, with cells pooled from 3 mice per group. (C) Composition of bacterial phylum of CX3CR1+ MNCs in the BM from WT SPF mice. Quantification of bacterial 16S rRNA in lineage cells from BM of Myd88−/− (D) and 3d mice (G) vs 16S rRNA in BM of GF mice as control (n = 3). Quantification of inflammatory cytokines in the mRNA (E,H; n = 3 or 4 mice) and protein (F [n = 4 or 5 mice] and I [n = 6-8 mice]) from Myd88−/− mice (E-F) and 3d mice (H-I) in comparison with their WT controls. mRNA level of each cytokine was measured in the CX3CR1+ MNCs of each group of mice by reverse-transcription quantitative polymerase chain reaction (pooled samples from 3 or 4 mice per group), and protein was measured in the BM lavage fluids by enzyme-linked immunosorbent assay. Data are representative of 2 (A-B,D-E,G-H) or 3 (F,I) independent experiments with similar results. Data are mean ± standard error of the mean. *CX3CR1+ MNCs vs other cell types. #Each cell type vs GF_BM control. Each circle represents an individual mouse. */#P < .05, **/##P < .01, ***/###P < .001, unpaired 2-tailed Student t test (E-F,H-I), 1-way ANOVA with Bonferroni multiple comparison (B,D,G), 1-way ANOVA with Newman-Keuls’ multiple comparison (A). N.S., not significant; U.D., undetermined.](https://ash.silverchair-cdn.com/ash/content_public/journal/blood/134/16/10.1182_blood.2019000495/3/m_bloodbld2019000495f5.png?Expires=1765895744&Signature=0ZxCg864jeg~pofdjWXs2GtAi2KaSg0dR9XOobtnAqu8En561pzl8V~ep8JuxyqWrVOJTdrC~v4pLSZOuXKKJ3b57NF2hdhIadfIKyTeEX3DE89yXeC98~8xahDw2uAjF7Suj5prpGgLzLAKUZNjIVxjnRX69Zv1BoeRTIzxkoRVCN~c1DZe0WGO7Hu6BAby1-J~vPhhx~mqwJNvInnObpqzTu3qTKreVlSwJ6~Mi-UO5W0kxCN9ElO-5NFfhEmpo6GUpD4hrOG1NJ3xu9EeCXvS6Y7X5dwPDW4K33MiBiDPDcpowxZfknbyJOHD9QgyMVeUEDZOWwbGIlYD0kcDLQ__&Key-Pair-Id=APKAIE5G5CRDK6RD3PGA)
Microbiota-derived bDNA is systemically circulating and sensed by BM CX3CR1+ MNCs. (A) Reverse-transcription quantitative polymerase chain reaction analysis of bacterial 16S ribosomal RNA (rRNA) in the BM of SPF, GF, and CoH-GF mice (n = 8-11). (B) Quantification of bacterial 16S rRNA in lineage cells of the BM in SPF mice, with cells pooled from 3 mice per group. (C) Composition of bacterial phylum of CX3CR1+ MNCs in the BM from WT SPF mice. Quantification of bacterial 16S rRNA in lineage cells from BM of Myd88−/− (D) and 3d mice (G) vs 16S rRNA in BM of GF mice as control (n = 3). Quantification of inflammatory cytokines in the mRNA (E,H; n = 3 or 4 mice) and protein (F [n = 4 or 5 mice] and I [n = 6-8 mice]) from Myd88−/− mice (E-F) and 3d mice (H-I) in comparison with their WT controls. mRNA level of each cytokine was measured in the CX3CR1+ MNCs of each group of mice by reverse-transcription quantitative polymerase chain reaction (pooled samples from 3 or 4 mice per group), and protein was measured in the BM lavage fluids by enzyme-linked immunosorbent assay. Data are representative of 2 (A-B,D-E,G-H) or 3 (F,I) independent experiments with similar results. Data are mean ± standard error of the mean. *CX3CR1+ MNCs vs other cell types. #Each cell type vs GF_BM control. Each circle represents an individual mouse. */#P < .05, **/##P < .01, ***/###P < .001, unpaired 2-tailed Student t test (E-F,H-I), 1-way ANOVA with Bonferroni multiple comparison (B,D,G), 1-way ANOVA with Newman-Keuls’ multiple comparison (A). N.S., not significant; U.D., undetermined.
Microbiota-derived bDNA is systemically circulating and sensed by BM CX3CR1+ MNCs. (A) Reverse-transcription quantitative polymerase chain reaction analysis of bacterial 16S ribosomal RNA (rRNA) in the BM of SPF, GF, and CoH-GF mice (n = 8-11). (B) Quantification of bacterial 16S rRNA in lineage cells of the BM in SPF mice, with cells pooled from 3 mice per group. (C) Composition of bacterial phylum of CX3CR1+ MNCs in the BM from WT SPF mice. Quantification of bacterial 16S rRNA in lineage cells from BM of Myd88−/− (D) and 3d mice (G) vs 16S rRNA in BM of GF mice as control (n = 3). Quantification of inflammatory cytokines in the mRNA (E,H; n = 3 or 4 mice) and protein (F [n = 4 or 5 mice] and I [n = 6-8 mice]) from Myd88−/− mice (E-F) and 3d mice (H-I) in comparison with their WT controls. mRNA level of each cytokine was measured in the CX3CR1+ MNCs of each group of mice by reverse-transcription quantitative polymerase chain reaction (pooled samples from 3 or 4 mice per group), and protein was measured in the BM lavage fluids by enzyme-linked immunosorbent assay. Data are representative of 2 (A-B,D-E,G-H) or 3 (F,I) independent experiments with similar results. Data are mean ± standard error of the mean. *CX3CR1+ MNCs vs other cell types. #Each cell type vs GF_BM control. Each circle represents an individual mouse. */#P < .05, **/##P < .01, ***/###P < .001, unpaired 2-tailed Student t test (E-F,H-I), 1-way ANOVA with Bonferroni multiple comparison (B,D,G), 1-way ANOVA with Newman-Keuls’ multiple comparison (A). N.S., not significant; U.D., undetermined.
CX3CR1+ MNCs control hematopoiesis by processing MDMs via TLRs
Next, we hypothesized that MDMs, including bDNA as a readout, captured by CX3CR1+ MNCs are processed to secrete inflammatory cytokines, relying on the TLR signaling. Notably, BM CX3CR1+ MNCs from Myd88−/− and 3d mice also contain a higher level of bDNA than do other immune cell types, indicating that the TLR pathways themselves have no role in capturing bDNA in the BM (Figure 5D,G). However, cytokine mRNA levels were dramatically decreased in Myd88−/− and 3d CX3CR1+ MNCs compared with WT CX3CR1+ MNCs, and Myd88−/− and 3d mice showed reduced protein levels in the BM (Figure 5E-F,H-I). These results demonstrate that MDMs are sensed by TLRs in CX3CR1+ MNCs, perhaps in endolysosomes, to produce a tonic level of inflammatory cytokines under steady-state conditions.
To further study whether CX3CR1+ MNCs play an essential role in regulating steady-state hematopoiesis through MDMs, CX3CR1+ MNCs were depleted in Cd11c-DOG mice with DT treatment, because CX3CR1+ MNCs are the only population among BM cells that expresses high CD11c levels (Figure 6A; supplemental Figure 6B). CX3CR1+ MNC depletion induced a sharp decrease in the bDNA level in the BM, to a level nearly comparable to GF mice (Figure 6B). This proves that bDNA in the circulation enters the BM through CX3CR1+ MNCs. CX3CR1+ MNC depletion altered hematopoiesis, consistent with results in GF mice in which the numbers of LSK cells dropped largely as a result of a decrease in MPPs, whereas HSCs were unaffected (Figure 6C). The selective downregulation of myelopoiesis was revealed by a decrease in the number of myeloid progenitors and myeloid lineage cells (Figure 6D-E). Next, we sought to abrogate the TLR signaling pathways in only CX3CR1+ MNCs by generating 2 experimental systems: (1) BM chimeras with a 1:1 mixture of BM cells from Cd11c-DOG and 3d mice in which 3d CX3CR1+ MNCs only survive in the BM after DT treatment and (2) Cd11c+ cell-specific deletion of the MyD88 gene. We found selective decreases in MPPs and myeloid lineage cells in both systems (Figure 6F-I) when endolysosomal TLR signaling pathways are defective in CX3CR1+ MNCs. Collectively, CX3CR1+ MNCs control steady-state hematopoiesis in the BM by processing MDMs through TLRs.
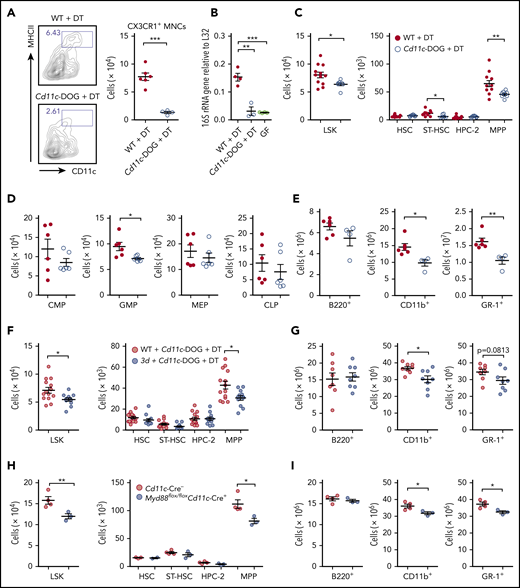
CX3CR1+ MNCs regulate hematopoietic progenitors through TLR signaling pathways. (A) Depletion of CX3CR1+ MNCs by DT administration in Cd11c-DOG mice. Flow cytometry of cell depletion and the number of CX3CR1+ MNCs in the BM of Cd11c-DOG and control WT B6 mice are shown after DT injection (n = 4-6). (B) Reverse-transcription quantitative polymerase chain reaction analysis of bacterial 16S rRNA gene in the BM from WT and Cd11c-DOG mice after DT injection, as well as GF mice (n = 3 or 4). (C) Numbers of LSK cells and further separation of HSPCs into HSC, ST-HSC, HPC-2, and MPP cells from Cd11c-DOG and control mice after DT injection (n = 8-12). Numbers of various progenitor cell populations (n = 6) (D) and lineage cells (E) in the BM from Cd11c-DOG mice and control mice after DT injection (n = 4-6). Numbers of LSK cells, HSCs, ST-HSCs, HPC-2, and MPP cells (n = 12-14) (F) and lineage cells (n = 8) (G) in BM chimera with WT BM or 3d BM with Cd11c-DOG BM after DT injection. Numbers of LSK cells, HSCs, ST-HSCs, HPC-2, and MPP cells (H) and lineage cells (I) in the BM of control mice and Myd88flox/floxCd11c-Cre+ mice (n = 3 or 4). Data are representative of >3 (A), 3 (E), or 2 (H-I) independent experiments with similar results and pooled from 2 (C,D,G) or 3 (F) independent experiments. Data are presented as mean ± standard error of the mean, and each circle represents an individual mouse. *P < .05, **P < .01, ***P < .001, unpaired 2-tailed Student t test (A,C-I) or 1-way ANOVA with Bonferroni multiple comparison (B).
CX3CR1+ MNCs regulate hematopoietic progenitors through TLR signaling pathways. (A) Depletion of CX3CR1+ MNCs by DT administration in Cd11c-DOG mice. Flow cytometry of cell depletion and the number of CX3CR1+ MNCs in the BM of Cd11c-DOG and control WT B6 mice are shown after DT injection (n = 4-6). (B) Reverse-transcription quantitative polymerase chain reaction analysis of bacterial 16S rRNA gene in the BM from WT and Cd11c-DOG mice after DT injection, as well as GF mice (n = 3 or 4). (C) Numbers of LSK cells and further separation of HSPCs into HSC, ST-HSC, HPC-2, and MPP cells from Cd11c-DOG and control mice after DT injection (n = 8-12). Numbers of various progenitor cell populations (n = 6) (D) and lineage cells (E) in the BM from Cd11c-DOG mice and control mice after DT injection (n = 4-6). Numbers of LSK cells, HSCs, ST-HSCs, HPC-2, and MPP cells (n = 12-14) (F) and lineage cells (n = 8) (G) in BM chimera with WT BM or 3d BM with Cd11c-DOG BM after DT injection. Numbers of LSK cells, HSCs, ST-HSCs, HPC-2, and MPP cells (H) and lineage cells (I) in the BM of control mice and Myd88flox/floxCd11c-Cre+ mice (n = 3 or 4). Data are representative of >3 (A), 3 (E), or 2 (H-I) independent experiments with similar results and pooled from 2 (C,D,G) or 3 (F) independent experiments. Data are presented as mean ± standard error of the mean, and each circle represents an individual mouse. *P < .05, **P < .01, ***P < .001, unpaired 2-tailed Student t test (A,C-I) or 1-way ANOVA with Bonferroni multiple comparison (B).
CX3CR1+ MNCs colocate with hematopoietic progenitors at the BM perivascular region and uptake bacterial EVs
Because CX3CR1+ MNCs and HSPCs are extremely rare, they need to be located in close proximity to a specific region of the BM for efficient communication with each other. Notably, a previous study showed that CX3CR1+ MNCs (defined as BM dendritic cells at the time) cluster at the perivascular region in the BM,31 and HSPCs are also located near blood vessels called the perivascular niche.38-40 This led us to hypothesize that CX3CR1+ MNCs control HSPCs in the perivascular region of the BM. To test this hypothesis, we adoptively transferred HSPCs into Cx3cr1GFP/+ mice with labeled blood vasculatures. Using intravital 2-photon microscopy, we observed that HSPCs resided at the perivascular region adjacent to CX3CR1+ MNCs in the cranial cavity BM (Figure 7A). Similar observations were also made using femur immunostaining; CX3CR1-GFP+ MNCs reside in the vicinity of CD31+CD144+ endothelial cells at the perivascular region (Figure 7B). More importantly, CX3CR1+ MNCs were closely located near MPPs (identified as LIN−CD41−FLT3+c-KIT+)15 (Figure 7C-D). The average distance between MPPs and the nearest CX3CR1+ MNCs was shorter than that between LIN+CD41+ cells and CX3CR1+ MNCs, indicating that MPPs have a greater chance of being located closer to CX3CR1+ MNCs than to other lineage cells (Figure 7E). These results suggest that CX3CR1+ MNCs regulate MPPs by sharing residency in the perivascular region of the BM.
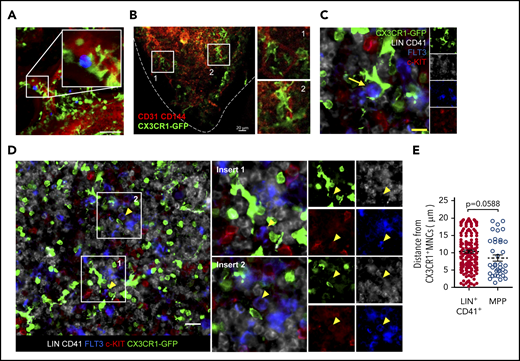
CX3CR1+ MNCs colocalize with hematopoietic progenitors at the perivascular region. (A) Two-photon intravital microscopy of the colocalization of adoptively transferred LSK cells (blue) and host CX3CR1+ MNCs (green) in the cranial BM cavities of Cx3cr1GFP/+ mice. Scale bar, 50 µm. Data are representative of 2 independent experiment with similar results. (B-D) Immunofluorescence images of the femoral section of Cx3cr1GFP/+ mice. (B) CX3CR1+ MNCs (green) and blood vessel (red). Dashed line indicates the bone line. (C-D) CX3CR1+ MNCs (green), FLT3 (blue), c-KIT (red), and LIN+CD41+ cells (gray). Yellow arrow indicates a MPP cell. (D) White boxed areas show that MPP cells make contact with CX3CR1+ MNCs. Yellow arrowheads indicate MPP cells. The small images in the right (C) and far right (D) columns show the same sections labeled with each indicated molecule. Scale bars, 10 µm (C), 20 µm (B,D). Data are representative of 6 sections from 3 (B) or 4 (C) mice with similar results. (E) Average distance between the nearest CX3CR1+ cells and MPPs or LIN+CD41+ cells in the BM of Cx3cr1GFP/+ mice within 20 μm. Circles represent individual cells analyzed from 6 sections from 4 mice (n = 203 LIN+CD41+ cells; n = 44 MPPs). Data are mean ± standard error of the mean. The P value was determined using an unpaired Student t test.
CX3CR1+ MNCs colocalize with hematopoietic progenitors at the perivascular region. (A) Two-photon intravital microscopy of the colocalization of adoptively transferred LSK cells (blue) and host CX3CR1+ MNCs (green) in the cranial BM cavities of Cx3cr1GFP/+ mice. Scale bar, 50 µm. Data are representative of 2 independent experiment with similar results. (B-D) Immunofluorescence images of the femoral section of Cx3cr1GFP/+ mice. (B) CX3CR1+ MNCs (green) and blood vessel (red). Dashed line indicates the bone line. (C-D) CX3CR1+ MNCs (green), FLT3 (blue), c-KIT (red), and LIN+CD41+ cells (gray). Yellow arrow indicates a MPP cell. (D) White boxed areas show that MPP cells make contact with CX3CR1+ MNCs. Yellow arrowheads indicate MPP cells. The small images in the right (C) and far right (D) columns show the same sections labeled with each indicated molecule. Scale bars, 10 µm (C), 20 µm (B,D). Data are representative of 6 sections from 3 (B) or 4 (C) mice with similar results. (E) Average distance between the nearest CX3CR1+ cells and MPPs or LIN+CD41+ cells in the BM of Cx3cr1GFP/+ mice within 20 μm. Circles represent individual cells analyzed from 6 sections from 4 mice (n = 203 LIN+CD41+ cells; n = 44 MPPs). Data are mean ± standard error of the mean. The P value was determined using an unpaired Student t test.
However, the entity that bDNA circulates systemically is still unknown. Previous reports have shown that MDMs were detected in the blood in various forms, such as peptidoglycan, outer membrane proteins, and heat-stable components.10,12,34,35 Along with our results that bDNA is found in many organs, we hypothesize that these MDMs may be transferred altogether as cell-free cargo. We assume that this may include parts of the outer membrane, along with nucleic acids and proteins, resembling EVs that are known to have all of these bacterial components.41-43 Thus, the idea was embodied experimentally by transfusing bacterial EVs isolated from in vitro–cultured E coli, because we previously showed the systemic circulation of transferred bacterial EVs in the liver, spleen, and lungs.44 Imaging using intravital 2-photon microscopy captured the moment of EV engulfment by CX3CR1+ MNCs in the perivascular region (supplemental Figure 8A). Importantly, the EVs were exclusively absorbed by CX3CR1+ MNCs (supplemental Figure 8B). These results suggest that CX3CR1+ MNCs might be the main processors of MDMs if they are systemically circulating in the form of EVs.
Discussion
Here, we provide answers to questions regarding the mechanisms by which the microbiota regulate hematopoiesis in the BM. Our results indicate that (1) MDMs, including bDNA, continuously circulate throughout the blood system and reach many distal organs like the BM; (2) rather than being dispersed throughout the BM tissue, MDMs are concentrated in a specific type of innate immune cells, CX3CR1+ MNCs; (3) CX3CR1+ MNCs sense MDMs, particularly via endolysosomal TLRs, to produce a low level of inflammatory cytokines in the BM; (4) CX3CR1+ MNCs colocate with MPPs at the perivascular region; and (5) in sum, under steady-state conditions, MDMs regulate the basal expansion of hematopoietic progenitors and their differentiation potential toward myeloid lineages indirectly via the innate immune response of CX3CR1+ MNCs.
Our data indicate a crucial role for CX3CR1+ MNCs in the microbiota-dependent regulation of hematopoiesis in the steady-state. Many types of mature myeloid cells also reside in the BM, although their ontogeny is not clearly understood. Nonetheless, BM CX3CR1+ MNCs are phenotypically similar to CX3CR1+ macrophages in the intestine.32 Both cells express distinctive surface markers, such as CD11c, MHCII, F4/80, CCR7, and CX3CR1, and share some markers, such as CD115, CCR2, Ly6C/Ly6G, and CD11b, with monocytes. Additionally, we observed CX3CR1− macrophages in the BM expressing classical macrophage surface markers like F4/80/CD68/CD16/32, but not CX3CR1/CD11c/MHCII and Ly6C/CD115/CCR2, which are associated with CX3CR1+ MNCs and monocytes, respectively.45,46 Taking these phenotypes into account, CX3CR1+ MNCs could be of monocyte origin, but CX3CR1− macrophages are not. Transcriptional profiles also support that CX3CR1+ MNCs are derived from monocytes, indicating that these cells highly express the genes associated with innate inflammatory responses and phagocytosis. This is in agreement with the uptake of bDNA and cytokine expression. Interestingly, bDNA was primarily detected in CX3CR1+ MNCs. This is largely due to the location of CX3CR1+ MNCs in the perivascular region of the BM adjacent to the systemic blood circulation. Hence, circulating bDNA arriving at the BM may encounter CX3CR1+ MNCs at the frontline. Another intriguing possibility is that CX3CR1+ MNCs actively take up bDNA in the circulation by extending cellular extrusions in a way similar to the sequestering of luminal antigens by intestinal CX3CR1+ macrophages.47
Notably, some hematopoietic cells regulate HSC niches where monocytes and macrophages play a role. CD169+ macrophages or DARC+ macrophages control HSCs by affecting mesenchymal stem cells45 or by directly communicating with HSCs,48 respectively. It is difficult to discern how much they overlap with each other. However, considering their location in the BM and their surface phenotypes, they likely overlap with the CX3CR1− macrophages assessed in this study. In contrast, α-SMA+ monocytes/macrophages share some surface phenotypes and are located near the sinus with CX3CR1+ MNCs.49 However, they also have features distinctive of CX3CR1+ MNCs: they are a very rare fraction among BM CX3CR1+ cells, and they specifically affect primitive hematopoietic cells like HSCs rather than MPPs. Although more studies will be needed, the conclusion from our study is that BM has various MPS populations with functional differences playing distinctive roles in HSPC regulation.
Attenuated myelopoiesis in GF mice made them more vulnerable to pathogen infection by reducing the development and functionality of myeloid cells.9 Moreover, microbiota-induced systemic immunoglobulin G responses to outer membrane proteins protected mice from fatal enteric infections.35 These results indicate the physiological importance of the systemic circulation of MDMs in educating the immune system and preparing for potential infections. In this sense, it is noteworthy that, regardless of tissue type, bDNA originates from a specific bacterial phylum (Proteobacteria) to which most enteric bacterial pathogens belong. This is consistent with previous reports that Proteobacteria represent the most dominant phylum in the spleen under steady-state conditions.35,37 The finding that bDNA in the circulation is derived from a relatively minor fraction of intestinal microbiota suggests that MDMs may more likely come from bacteria that colonize near the intestinal epithelium. The observations that Proteobacteria are more abundant in the mucosa-associated fraction of human intestinal tissues than in the luminal fraction may support this hypothesis.50 Of interest, Proteobacteria make up a major fraction of the microbiota in other tissues like the oral cavity, skin, and lungs.51 Therefore, we cannot rule out the possibility that part of the systemic bDNA may originate from nonintestinal organs.
Effective filtering of MDMs in the liver and spleen may result in a very limited quantity of MDMs available in distal organs like the BM. The low number of MDMs in the BM is captured in CX3CR1+ MNCs that are capable of efficiently processing MDMs to produce inflammatory cytokines. This corresponds well with the unique location of CX3CR1+ MNCs in the BM tissue; MDMs are processed with minimum loss at the perivascular region where blood circulating MDMs arrive. Although we identified that the inflammatory cytokines are prime candidates to regulate HSPCs, it is possible that other factors derived from CX3CR1+ MNCs may play a synergistic role with the cytokines. Furthermore, CX3CR1+ MNCs might communicate with other niche cells, especially nonhematopoietic cells, such as endothelial and stromal cells, which will be a subject for future study.
For original data, please contact Seung-Woo Lee (sw_lee@postech.ac.kr).
The online version of this article contains a data supplement.
The publication costs of this article were defrayed in part by page charge payment. Therefore, and solely to indicate this fact, this article is hereby marked “advertisement” in accordance with 18 USC section 1734.
Acknowledgments
The authors thank Myung-Ho Jang (GI Innovation Inc., Seoul, Republic of Korea) for providing Myd88−/− and Cx3cr1GFP/+ mice, as well as Yong Song Gho (Department of Life Sciences, POSTECH) and Sang-Hwan Seo and Doo-Jin Kim (Korea Research Institute of Bioscience and Biotechnology, Daejeon, Republic of Korea) for providing EV materials.
This work was supported by National Research Foundation of Korea (NRF) grants, funded by the Korea government (NRF-2017R1A2B4005400, NRF-2012R1A1A2044032, and NRF-2017R1A5A1015366), as well as by BK21 Plus, funded by the Ministry of Education, Korea (10Z20130012243).
Authorship
Contribution: Seungwon Lee, H.K., and S.-W.L. conceived the study and designed experiments; Seungwon Lee, H.K., G.Y., Young-Min Kim, and O.K. performed experiments; Seungwon Lee and H.K. analyzed data; Seungwon Lee, H.K., Seunghun Lee, V.-H.L., and K.H.K. performed 2-photon microscopy imaging experiments and analyzed data; K.S.K. and C.D.S. provided GF mice for the gnotobiotic studies; You-Me Kim provided 3d mice for the study; S.-H.I., You-Me Kim, Y.C.S., C.D.S., and Y.P. analyzed and interpreted the data; and Seungwon Lee, H.K., Y.P., and S.-W.L. wrote the manuscript.
Conflict-of-interest disclosure: The authors declare no competing financial interests.
The current affiliation for You-Me Kim is Graduate School of Medical Science and Engineering, KAIST, Daejeon, Republic of Korea.
Charles D. Surh died on 6 October 2017.
Correspondence: Seung-Woo Lee, Division of Integrative Biosciences and Biotechnology, Department of Life Sciences, Pohang University of Science and Technology, 77 Cheongam-Ro, Nam-Gu, Pohang, Gyeongbuk 37673, Republic of Korea; e-mail: sw_lee@postech.ac.kr; and Yunji Park, Division of Integrative Biosciences and Biotechnology, Pohang University of Science and Technology, 77 Cheongam-Ro, Nam-Gu, Pohang, Gyeongbuk 37673, Republic of Korea; e-mail: yunji@postech.ac.kr.

This feature is available to Subscribers Only
Sign In or Create an Account Close Modal