

Key Points
Reductions in IDH2 variant allele frequency and molecular clearance with enasidenib were associated with attainment of complete remission.
Enasidenib induced responses in ∼40% of patients with mutant-IDH2 R/R AML, with similar response rates regardless of response to prior treatment.

Abstract
Approximately 8% to 19% of patients with acute myeloid leukemia (AML) have isocitrate dehydrogenase-2 (IDH2) mutations, which occur at active site arginine residues R140 and R172. IDH2 mutations produce an oncometabolite, 2-hydroxyglutarate (2-HG), which leads to DNA and histone hypermethylation and impaired hematopoietic differentiation. Enasidenib is an oral inhibitor of mutant-IDH2 proteins. This first-in-human phase 1/2 study evaluated enasidenib doses of 50 to 650 mg/d, administered in continuous 28-day cycles, in patients with mutant-IDH2 hematologic malignancies. Overall, 214 of 345 patients (62%) with relapsed or refractory (R/R) AML received enasidenib, 100 mg/d. Median age was 68 years. Forty-two patients (19.6%) attained complete remission (CR), 19 patients (10.3%) proceeded to an allogeneic bone marrow transplant, and the overall response rate was 38.8% (95% confidence interval [CI], 32.2-45.7). Median overall survival was 8.8 months (95% CI, 7.7-9.6). Response and survival were comparable among patients with IDH2-R140 or IDH2-R172 mutations. Response rates were similar among patients who, at study entry, were in relapse (37.7%) or were refractory to intensive (37.5%) or nonintensive (43.2%) therapies. Sixty-six (43.1%) red blood cell transfusion–dependent and 53 (40.2%) platelet transfusion–dependent patients achieved transfusion independence. The magnitude of 2-HG reduction on study was associated with CR in IDH2-R172 patients. Clearance of mutant-IDH2 clones was also associated with achievement of CR. Among all 345 patients, the most common grade 3 or 4 treatment-related adverse events were hyperbilirubinemia (10%), thrombocytopenia (7%), and IDH differentiation syndrome (6%). Enasidenib was well tolerated and induced molecular remissions and hematologic responses in patients with AML for whom prior treatments had failed. The study is registered at www.clinicaltrials.gov as #NCT01915498.
Introduction
Few patients with relapsed or refractory (R/R) acute myeloid leukemia (AML) are cured.1 In patients fit for intensive treatment, remission rates with reinduction chemotherapy are no higher than 40% to 50%, and there are few long-term survivors.2,3 Estimated median overall survival (OS) among patients with R/R who are unfit for reinduction, many of whom are older adults, is only a few months.2,4
Approximately 8% to 19% of patients with AML have an isocitrate dehydrogenase-2 (IDH2) mutation.5 Somatic IDH2 point mutations occur at the active site arginine residues R140 and R172.6 Mutant-IDH2 proteins have neomorphic enzymatic activity, catalyzing NADPH-dependent reduction of α-ketoglutarate (α-KG) to an oncometabolite, the (R) enantiomer of 2-hydroxyglutarate (2-HG).7,8 High concentrations of 2-HG associated with mutant-IDH2 AML competitively inhibit α-KG–dependent dioxygenases, including DNA-demethylating TET family proteins, leading to histone and DNA hypermethylation. 9 These changes are associated with the blocked differentiation of immature hematopoietic cells that characterize AML.9,10
Enasidenib (IDHIFA; AG-221) is a small-molecule oral inhibitor of mutant-IDH2 proteins that is approved by the US Food and Drug Administration, at an initial dose of 100 mg once daily, for treatment of adult patients with mutant-IDH2 R/R AML.11,12 Enasidenib reduces 2-HG to normal levels and promotes maturation of leukemic progenitor and precursor cells.11,13 Interim safety and efficacy data for a subset of patients with R/R AML in the phase 1/2 dose-escalation and expansion study of enasidenib monotherapy (NCT01915498) have been reported.14 Here, we describe for the first time novel data on molecular clearance and molecular relationships between response or resistance to enasidenib. Additionally, we report the clinical outcomes for the entire cohort of patients with R/R AML treated during the trial, the relationship between prior AML treatment and response to enasidenib, the potential for delayed responses in patients who maintained stable disease (SD) during early treatment, the influence of pretreatment demographic and disease variables on response, and rates of transfusion independence during enasidenib therapy.
Methods
The study protocol was approved by institutional review boards or ethics committees at all participating sites. All patients provided written informed consent before study participation.
Study design and methods of the phase 1 dose-escalation and expansion portions of this study are described elsewhere.13,14 Enrollment in phase 2 was limited to patients aged ≥18 years with mutant-IDH2 R/R AML who had relapsed after allogeneic stem cell transplant; had experienced two or more prior relapses; were refractory to initial induction or reinduction treatment; or had relapsed within 1 year of initial treatment, excluding those with favorable cytogenetic risk (per National Comprehensive Cancer Network [NCCN] 2015 guidelines15 ). All patients in the phase 1 expansion and in phase 2 received once-daily oral enasidenib, 100 mg, in continuous 28-day cycles.
Bone marrow biopsies and/or aspirates and peripheral blood were collected at screening, on cycle 2 day 1, every 28 days for the next 12 months, and then every 56 days thereafter while receiving enasidenib.
Efficacy end points
Investigator-assessed clinical responses, per International Working Group (IWG) AML response criteria,16 are reported for all R/R AML patients, as well as for the subgroup of patients with R/R AML who received 100 mg of enasidenib daily (R/R AML100 cohort) and who accounted for three-fourths of all study participants. Overall response rate (ORR) included complete remission (CR), CR with incomplete hematologic recovery/CR with incomplete platelet recovery (CRi/CRp), partial remission (PR), and morphologic leukemia-free state (MLFS).16 Red blood cell (RBC) transfusion independence and platelet transfusion independence were defined as no transfusions for ≥56 consecutive days on study among patients who had received ≥1 transfusion within 4 weeks (phase 1) or 8 weeks (phase 2) before study entry.
OS was measured as the interval between first enasidenib dose and death from any cause. Event-free survival (EFS) describes the interval between first enasidenib dose and AML relapse (≥5% bone marrow blasts, reappearance of blasts in blood, or development of extramedullary disease), disease progression, or death, whichever occurred first.
Among R/R AML100 patients, response and survival were evaluated based on baseline demographic and disease characteristics, number of prior AML treatments, and whether, at study start, patients were refractory to induction chemotherapy, refractory to nonintensive AML treatment (hypomethylating agents, low-dose cytarabine), or were in first or later relapse. Response and survival outcomes were also evaluated among R/R AML100 patients who maintained SD for the first 90 days of enasidenib treatment (per European LeukemiaNet [ELN] definition17 ).
Translational end points
Exploratory translational analyses were performed on samples from R/R AML100 patients with ≥1 on-study efficacy assessment, and included assessment of plasma 2-HG levels and mutant-IDH2 variant allele frequency (VAF) in bone marrow mononuclear cells at baseline and during treatment, as well as comutations at baseline. Methods of sample preparation, 2-HG and mutant-IDH2 VAF assessment, and DNA sequencing were reported previously13 and are described in detail in supplemental Material (available on the Blood Web site). End points are reported by IDH2 variant (R140 or R172). Relationships between clinical response and 2-HG concentrations or mutant-IDH2 VAFs were determined using response data from a 14 October 2016 cutoff date (supplemental Table 1).
Statistical analyses
For adequate estimations of response rate, duration of response, and EFS, 291 patients were to be enrolled: 66 in the dose-escalation phase, 100 in the phase 1 expansion, and 125 in the phase 2 study portion. Hematologic response rates were calculated using point estimates of proportions with 2-sided exact binomial 95% confidence intervals (CIs). OS and 1-year survival rates were estimated using Kaplan-Meier methods. Relationships between response and individual comutations were evaluated using a 2-tailed Fisher exact test.
Results
Patients
Between 20 September 2013 and the data cutoff on 1 September 2017, 345 patients were enrolled at 21 sites and received ≥1 dose of enasidenib (supplemental Figure 1). Altogether, 280 patients with R/R AML participated, 214 of whom (76.2%) made up the R/R AML100 cohort. The median number of enasidenib treatment cycles was 5.0 (range, 1-38). At the data cutoff, 16 patients (4.6%) remained on study.
Among all R/R AML patients, the genes most frequently comutated with IDH2 were SRSF2 (42.0%), DNMT3A (38.5%), ASXL1 (27.0%), and RUNX1 (20.1%). Three genes were preferentially comutated with IDH2-R140 (SRSF2, RUNX1, NPM1), and 2 genes were preferentially comutated with IDH2-R172 (BCOR, ARID2) (supplemental Table 2).
In the R/R AML100 cohort, median age at study entry was 68 years (range, 19-100); 162 patients (75.7%) had IDH2-R140Q mutations, 46 (21.5%) had AML secondary to a myelodysplastic syndrome (MDS), and 48 (22.4%) had received ≥3 prior AML therapies (Table 1).
Demographic and disease characteristics at baseline
| R/R AML | All patients (N = 345) | ||
|---|---|---|---|
| Enasidenib, 100 mg/d (n = 214) | All doses (n = 280) | ||
| Age, median (range), y | 68 (19-100) | 68 (19-100) | 69 (19-100) |
| Age ≥75 y, n (%) | 51 (24) | 66 (24) | 94 (27) |
| Sex, n (%) | |||
| Male | 109 (51) | 153 (55) | 201 (58) |
| Female | 105 (49) | 127 (45) | 144 (42) |
| WHO 2008 AML classification, n (%) | N = 319 | ||
| Myelodysplasia-related changes | 46 (22) | 63 (23) | 77 (24) |
| Recurrent genetic abnormalities | 28 (13) | 36 (13) | 38 (12) |
| Therapy-related myeloid neoplasms | 5 (2) | 6 (2) | 8 (3) |
| Not otherwise specified | 115 (54) | 144 (51) | 164 (51) |
| Missing* | 20 (9) | 31 (11) | 32 (10) |
| No. of prior cancer regimens, n (%) | N = 302 | ||
| 1 | 101 (47) | 125 (45) | 136 (45) |
| 2 | 65 (30) | 82 (29) | 88 (29) |
| ≥3 | 48 (22) | 73 (26) | 78 (26) |
| Time from initial diagnosis, median (range), mo | 10.4 (1.2-129) | 10.6 (1.2-129) | 8.6 (0.1-356) |
| R/R AML with prior history of MDS, n (%) | N/A | ||
| Yes | 46 (21) | 58 (21) | — |
| No | 168 (79) | 222 (79) | — |
| Outcomes of prior AML therapy, n (%)†,‡ | N/A | ||
| Refractory to initial induction or reinduction treatment | 64 (33) | 85 (33) | — |
| R/R to ≥2 cycles of first-line nonintensive therapy | 57 (29) | 75 (29) | — |
| Relapsed within 1 y of initial treatment | 55 (28) | 71 (28) | — |
| Relapsed posttransplant | 29 (15) | 41 (16) | — |
| In second or later relapse | 27 (14) | 36 (14) | — |
| Relapsed >1 y after initial treatment | 13 (6) | 20 (7) | — |
| Cytogenetic risk status, n (%) | |||
| Intermediate risk | 108 (50) | 141 (50) | 173 (50) |
| Poor risk | 55 (26) | 69 (25) | 84 (24) |
| Missing | 51 (24) | 70 (25) | 88 (26) |
| Prior stem cell transplantation, n (%) | 29 (14) | 41 (15) | 45 (13) |
| ECOG performance status, n (%) | |||
| 0 | 49 (23) | 62 (22) | 79 (23) |
| 1 | 132 (62) | 170 (61) | 204 (59) |
| 2 | 32 (15) | 47 (17) | 61 (18) |
| Missing | 1 (<1) | 1 (<1) | 1 (<1) |
| IDH2 mutant allele, n (%) | |||
| R140 | 162 (76) | 209 (75) | 259 (75) |
| R172 | 51 (24) | 70 (25) | 84 (24) |
| Other/missing | 1 (<1) | 1 (<1) | 2 (1) |
| Bone marrow blasts percentage, median (range)§ | 46.5 (0-98) | 46.0 (0-98) | 42.0 (0-98) |
| Hematology, median (range) | |||
| White blood cells, 109/L | 2.3 (0.2-94) | 2.3 (0.2-94) | 2.4 (0.2-94) |
| Hemoglobin, g/dL | 9.0 (6.9-15.6) | 9.1 (6.9-15.6) | 9.0 (6.9-15.6) |
| Platelets, 109/L | 37 (1-1288) | 40 (1-1288) | 42.9 (1-1288) |
| Baseline transfusion dependence, n (%) | |||
| RBC | 153 (71) | 202 (72) | 250 (72) |
| Platelets | 132 (62) | 165 (59) | 195 (57) |
During the study, the protocol was amended to determine AML subtypes according to the WHO classification scheme (AML classification was previously determined by French–American–British criteria).
Prior AML treatment of R/R AML patients only.
Individual patients may be counted in >1 category.
Local assessment.
ECOG, Eastern Cooperative Oncology Group; N/A, not applicable; WHO, World Health Organization.
Safety
Safety outcomes for all patients were consistent with those reported previously.14 The most frequent treatment-emergent adverse events (any grade) related to enasidenib treatment were indirect hyperbilirubinemia (40.3%), nausea (28%), and decreased appetite (17.7%) (supplemental Table 3). The most frequent enasidenib-related grade 3 or 4 treatment-emergent adverse events were hyperbilirubinemia (10.4%), thrombocytopenia (6.7%), IDH differentiation syndrome (IDH-DS; 6.4%), and anemia (5.5%).
Response
Response rates were similar in the R/R AML100 patient cohort and in all patients with R/R AML (Table 2). In the R/R AML100 cohort, 42 patients (19.6%) attained CR, ORR was 38.8% (95% CI, 32.2-45.7), and 19 patients (8.9%) proceeded to allogeneic bone marrow transplant. Median time to first response was 1.9 months (range, 0.5-9.4), and median time to best response was 3.7 months (0.6-14.7). Among responding patients, 46% (38/83) attained their best response by cycle 4, and 80% (66/83) did so by cycle 6. There was no significant difference in ORR between R/R AML100 patients with IDH2-R140 mutations (35.8%; 95% CI, 28.4-43.7) or IDH2-R172 mutations (47.1%; 95% CI, 32.9-61.5) (P = .187).
Investigator-reported efficacy outcomes and survival in patients with R/R AML
| R/R AML | ||
|---|---|---|
| Enasidenib, 100 mg/d (n = 214) | All doses (N = 280) | |
| ORR, % (n/N) [95% CI]* | 38.8 (83/214) [32.2%-45.7%] | 39.6 (111/280) [33.9%-45.6%] |
| CR + CRi/CRp rate, % (n/N) | 29.0 (62/214) | 27.9 (78/280) |
| Best response | ||
| CR, n (%) [CR rate 95% CI] | 42 (19.6) [14.5-25.6] | 53 (18.9) [14.5-24.0] |
| CRi/CRp, n (%) | 20 (9.3) | 25 (8.9) |
| PR, n (%) | 9 (4.2) | 17 (6.1) |
| MLFS, n (%) | 12 (5.6) | 16 (5.7) |
| SD, n (%)† | 98 (45.8) | 122 (43.6) |
| PD, n (%)‡ | 19 (8.9) | 26 (9.3) |
| Not evaluable, n (%) | 3 (1.4) | 4 (1.4) |
| Time to first response, median (range), mo | 1.9 (0.5-9.4) | 1.9 (0.5-9.4) |
| Duration of response, median (95% CI), mo | 5.6 (3.8-7.4) | 5.6 (4.6-6.5) |
| Time to best response, median (range), mo | 3.7 (0.6-14.7) | 3.7 (0.5-14.7) |
| Time to CR, median (range), mo | 3.7 (0.7-14.7) | 3.8 (0.5-14.7) |
| OS, median (95% CI), mo | 8.8 (7.7-9.6) | 8.8 (7.8-9.9) |
| EFS, median (95% CI), mo§ | 4.7 (3.7-5.6) | 4.6 (3.7-5.6) |
Responses were evaluated by study investigators and classified according to the 2003 revised IWG criteria for AML.16 ORR consists of CR, CRi, CRp, PR, and MLFS.
SD was defined as failure to achieve a response but not meeting criteria for disease progression for >8 consecutive weeks.
For patients with 5% to 66% bone marrow blasts at nadir, a >50% increase in bone marrow blast count percentage from the nadir with percentage ≥ 20%; and for patients with ≥67% bone marrow blasts at nadir, a doubling of the nadir absolute peripheral blood blast count with a final absolute peripheral blood blast count >10 × 109/L
Date of first documented response to date of relapse, disease progression, or death.
In univariate analyses, age, prior stem cell transplant, and Eastern Cooperative Oncology Group performance status at entry had no significant effect on the likelihood of a response to enasidenib; only cytogenetic risk at baseline was significantly predictive of response, with poor-risk cytogenetic classification associated with a lower ORR compared with intermediate-risk cytogenetics (18.2% vs 46.3%; P < .001) (supplemental Figure 2). Similarly, in univariate analysis, median OS was shorter for R/R AML100 patients with poor-risk cytogenetics compared with patients who had intermediate-risk cytogenetics (7.0 vs 9.3 months, respectively; P = .006). For patients who had received 1, 2, or ≥3 prior AML therapies, ORRs were 46.5% (47/101), 36.9% (24/65), and 25.0% (12/48), respectively (P = .040, Fisher exact test) (supplemental Figure 3).
Response by outcome of prior AML therapy
At study entry, 40 R/R AML100 patients (19%) were refractory to induction chemotherapy, 44 patients (21%) were refractory to lower-intensity regimens and had never received intensive AML treatment, and 130 patients (61%) were in relapse following prior AML treatment. Patients refractory to induction chemotherapy were younger (median age, 60.5 years) than those in the other 2 categories, patients refractory to nonintensive regimens were older (median 74.0 years) and more likely to have had a prior diagnosis of MDS, and patients in relapse were most likely to have received multiple prior AML regimens (supplemental Table 4). For patients who were refractory to intensive chemotherapy, ORR was 37.5%, including 4 patients (10.0%) who attained CR (Table 3); for patients who were refractory to nonintensive regimens, ORR was 43.2%, with 12 patients (27.3%) attaining CR; and for patients in relapse, ORR was 37.7%, with 26 patients (20.0%) attaining CR.
Response and survival outcomes by response to prior AML treatment(s) for patients with R/R AML who received enasidenib 100, mg/day
| Refractory to intensive chemotherapy (n = 40) | Refractory to lower-intensity therapy (n = 44)† | Relapsed following any prior AML therapy (n = 130) | |
|---|---|---|---|
| ORR, n (%) [95% CI]* | 15 (37.5) [22.7-54.2] | 19 (43.2) [28.4-59.0] | 49 (37.7) [29.4-46.6] |
| CR, n (%) | 4 (10.0) | 12 (27.3) | 26 (20.0) |
| CRi/CRp, n (%) | 4 (10.0) | 2 (4.5) | 14 (10.8) |
| OS, median (95% CI), mo | 12.4 (8.2-22.9) | 8.0 (5.6-11.7) | 8.1 (7.0-9.3) |
ORR included CR, CRi/CRp, MLFS, and PR.
Hypomethylating agents or low-dose cytarabine.
Association between mutant-IDH2 VAF and response
Baseline mutant-IDH2 VAF was assessed for 103 efficacy-evaluable R/R AML100 patients and ranged from 0.96% to 44.1%, with similar mean values in patients with IDH2-R140 (n = 79) or IDH2-R172 (n = 24) mutations (26.3% and 27.0%, respectively). Mean mutant-IDH2 VAF at baseline was significantly lower in IDH2-R140 patients who attained CR on study compared with nonresponders (20.5% vs 30.6%, respectively; P = .002) (supplemental Figure 4), although baseline IDH2-R140 VAF varied widely (from 1.6% to 40.1%) in patients who attained CR. Baseline mutant-IDH2 VAF among IDH2-R172 patients who attained CR was proportionately lower, but not statistically different, from that for nonresponding patients (23.7% vs 33.0%, respectively; P = .114).
Changes in mutant-IDH2 VAF during enasidenib treatment were assessed for 101 patients with ≥1 on-treatment measurement. Median baseline-normalized VAF in patients with IDH2-R140 mutations was reduced by >50% beginning at cycle 5, and it reached 90% reduction by cycle 9 (Figure 1A). Median maximum IDH2-R140 VAF reductions were greatest in patients who achieved CR compared with nonresponders (−98% vs −16%, respectively; P < .0001) (Figure 1B). Median baseline-normalized VAF in patients with IDH2-R172 mutations did not decrease >10% at any time point, although patients who achieved CR demonstrated significant VAF reductions (−62%) compared with non-CR responders (+54%, P = .0164) and nonresponders (+7%, P = .0134) (Figure 1B).
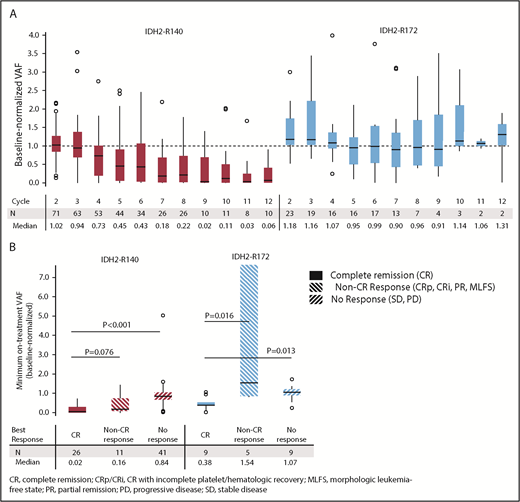
IDH2 VAF changes during enasidenib treatment. (A) Baseline-normalized VAFs measured at the beginning of cycles 2 through 12. Outlier points with normalized VAF values >4 are not shown for clarity. (B) Median minimum baseline-normalized VAF measures during treatment by mutant-IDH2 allele and clinical response category. Baseline-normalized VAFs for visit X = VAF at visit X divided by the average VAF at screening and at cycle 1 day 1. Outcomes are reported for patients with R/R AML who received enasidenib, 100 mg/d, and had longitudinal IDH2 VAF data (n = 101).
IDH2 VAF changes during enasidenib treatment. (A) Baseline-normalized VAFs measured at the beginning of cycles 2 through 12. Outlier points with normalized VAF values >4 are not shown for clarity. (B) Median minimum baseline-normalized VAF measures during treatment by mutant-IDH2 allele and clinical response category. Baseline-normalized VAFs for visit X = VAF at visit X divided by the average VAF at screening and at cycle 1 day 1. Outcomes are reported for patients with R/R AML who received enasidenib, 100 mg/d, and had longitudinal IDH2 VAF data (n = 101).
Twelve R/R AML100 patients (11.9%) achieved mutant-IDH2 molecular remission, defined as IDH2 VAF below the limit of detection (0.02% to 0.04%) at ≥1 time point; all 12 patients had IDH2-R140 mutations. Molecular remission was significantly associated with achievement of hematologic response (P = .0003 vs nonresponse, χ2 test). Ten of the 12 patients attained morphologic CR, 1 achieved CRp, and 1 achieved PR (supplemental Table 5). There was a significant survival advantage among the 12 patients who attained molecular remission vs those who did not (n = 89; median OS, 22.9 months vs 8.8 months, respectively, P = .0153). However, among the 35 patients who achieved morphologic CR, there was no significant survival difference between the 10 patients who also attained IDH2 molecular remission (median OS, 22.9 months) vs patients in morphologic CR with detectable mutant-IDH2 (n = 25; median OS, 20.7 months). Although no patient with an IDH2-R172 mutation achieved molecular remission, 2 of 23 patients reached IDH2-R172 VAF levels <2%; both patients also achieved morphologic CRs (supplemental Figure 5).
Comutations and resistance to enasidenib
Co-occurring mutation patterns among R/R AML100 patients are shown in supplemental Figure 6. The most common mutations in this cohort were SRSF2 (39.4%), DNMT3A (35.4%), ASXL1 (26.0%), RUNX1 (21.3%), NRAS (13.4%), BCOR (13.4%), and NPM1 (13.4%). Comutation burden at baseline was significantly greater in patients with IDH2-R140 mutations than in those with IDH2-R172 mutations (mean, 3.3 vs 2.4 comutated genes, respectively; P = .0115) (supplemental Figure 7). Responding patients had significantly fewer baseline mutations compared with nonresponding patients (Figure 2A). When patients were segregated into approximate tertiles by total number of baseline mutations (≤3, n = 42; >3 and <6, n = 53; ≥6, n = 32), a trend for lower ORR was observed in patients with ≥6 mutations vs patients with ≤3 mutations (31.3% vs 54.8%, respectively, P = .06) (Figure 2B).
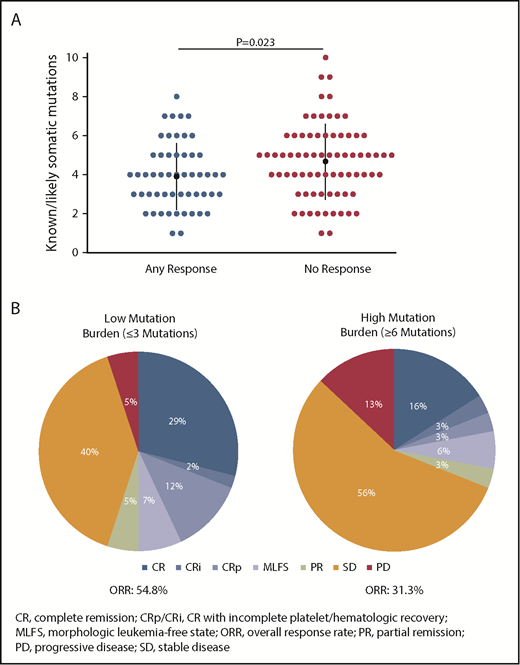
Association between baseline mutation burden and clinical response to enasidenib. (A) Number of known somatic mutations by response status. Dots represent individual patients. (B) Response in patients with low (≤3 mutations) or high (≥6 mutations) mutation burden at baseline. Outcomes are reported for the subgroup of patients with R/R AML who received enasidenib, 100 mg/d, and had baseline mutation data (n = 127).
Association between baseline mutation burden and clinical response to enasidenib. (A) Number of known somatic mutations by response status. Dots represent individual patients. (B) Response in patients with low (≤3 mutations) or high (≥6 mutations) mutation burden at baseline. Outcomes are reported for the subgroup of patients with R/R AML who received enasidenib, 100 mg/d, and had baseline mutation data (n = 127).
Using univariate analysis of data from 127 R/R AML100 patients, the only baseline comutation identified as significantly associated with nonresponse was FLT3 (-ITD or -TKD; n = 12) (P = .014 vs any response, Fisher exact test). Although not observed in the R/R AML100 subgroup, NRAS comutations were significantly associated with nonresponse among the overall R/R AML patient cohort (3% of patients with an NRAS mutation attained CR vs 19% of patients with no response; P = .025). Univariate analysis within functional gene groups18 showed patients with mutations in genes related to the Splicing and the Receptors/Kinases/Signaling functional categories were less likely to have any response to enasidenib (P = .007 and .005, respectively) (supplemental Figure 8).
Association between 2-HG and response
Baseline total 2-HG levels in plasma were available for 159 R/R AML100 patients (IDH2-R140, n = 119; IDH2-R172, n = 40). In patients with IDH2-R140 mutations, no significant differences in baseline 2-HG levels were noted among clinical response categories; median 2-HG concentrations at study entry were 629, 716, and 807 ng/mL for patients who later achieved CR, any non-CR response, or no response, respectively (supplemental Figure 9). In contrast, for patients with IDH2-R172 mutations, higher median 2-HG concentrations at baseline were significantly associated with subsequent achievement of CR vs nonresponse (1727 vs 491 ng/mL; P = .0381).
Longitudinal changes in plasma 2-HG concentrations during enasidenib treatment were assessed in 155 R/R AML100 patients. Baseline-normalized median 2-HG reductions approached or exceeded 10-fold for patients with IDH2-R140 mutations within the first treatment cycle and were sustained through subsequent cycles; however, this was not observed for patients with IDH2-R172 mutations (Figure 3A). During treatment, patients with IDH2-R140 mutations showed significantly greater maximum 2-HG reductions from baseline (median, −92.9%) compared with IDH2-R172 patients (median, −47.4%) (P = .0004). In patients with IDH2-R140 mutations, 2-HG levels were suppressed from baseline irrespective of clinical response category (−94.2%, −94.6%, and −90.0% in patients achieving CR, non-CR responses, and no response, respectively). For IDH2-R172 patients, 2-HG reductions were significantly greater in patients achieving CR (−82.0%) or a non-CR response (−44.3%) compared with no response (−38.4%) (Figure 3B).
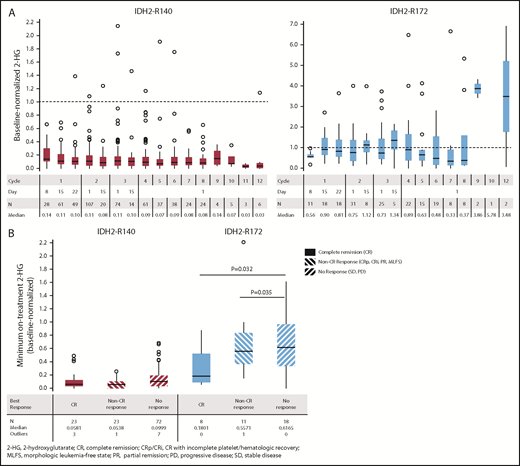
Changes in 2-HG concentrations during enasidenib treatment. (A) Box plots of evaluable baseline-normalized serum 2-HG levels during the first 12 cycles of enasidenib treatment. Dotted lines indicate baseline 2-HG level. (B) Baseline-normalized median maximum reductions in 2-HG as a function of mutant-IDH2 allele and clinical response category. Baseline-normalized 2-HG for visit X = 2-HG at visit X divided by the average 2-HG at screening and at cycle 1 day 1. Outcomes are reported for the subgroup of patients with R/R AML who received enasidenib, 100 mg/d, and had longitudinal 2-HG data (n = 155).
Changes in 2-HG concentrations during enasidenib treatment. (A) Box plots of evaluable baseline-normalized serum 2-HG levels during the first 12 cycles of enasidenib treatment. Dotted lines indicate baseline 2-HG level. (B) Baseline-normalized median maximum reductions in 2-HG as a function of mutant-IDH2 allele and clinical response category. Baseline-normalized 2-HG for visit X = 2-HG at visit X divided by the average 2-HG at screening and at cycle 1 day 1. Outcomes are reported for the subgroup of patients with R/R AML who received enasidenib, 100 mg/d, and had longitudinal 2-HG data (n = 155).
Clinical responses following early SD
Enasidenib acts as a differentiating agent, and responses to treatment may be delayed.11 Eighty-two R/R AML100 patients (38%) maintained SD during the first 90 days on study. Of them, 25 patients (30%) achieved an IWG-defined response after day 90 (Late Responders), including 16 patients who attained CR; 29 patients (35%) continued to maintain SD at all subsequent visits (SD Only); and 28 patients (34%) experienced only progressive disease (PD) after day 90 (supplemental Table 6). At baseline, Late Responders were less likely than patients who later developed PD to have received >2 prior anticancer treatments (8% vs 32%, respectively; P = .0432) or to have poor-risk cytogenetics (8% vs 43%; P = .0019) (supplemental Table 7). Seven Late Responders (28%) proceeded to transplant. Of those who maintained SD at all response evaluations after day 90, 11 of 21 patients (52%) who were RBC transfusion dependent at baseline attained RBC transfusion independence on study, and 8 of 22 patients (36%) who were platelet transfusion dependent at baseline achieved platelet transfusion independence.
Transfusion independence
Among all R/R AML100 patients who were transfusion dependent at baseline, 43.1% (66/153) achieved RBC transfusion independence and 40.2% (53/132) achieved platelet transfusion independence on study.
Survival
At a median follow-up of 7.8 months, estimated median OS for all 280 R/R AML patients was 8.8 months (95% CI, 7.8-9.9) (supplemental Figure 10). Median OS among R/R AML100 patients was also 8.8 months (95% CI, 7.7-9.6) (Figure 4A). Median EFS was 4.7 months (95% CI, 3.7-5.6) (Table 2). There was no statistical difference in median OS between patients with IDH2-R140 mutations (8.2 months; 95% CI, 7.0-9.3) or IDH2-R172 (10.6 months; 95% CI, 7.5-12.7). Estimated median OS was 22.9 months for the 42 R/R AML100 patients who achieved CR, 10.6 months for patients who achieved a non-CR response, and 5.6 months for nonresponders. Among patients who proceeded to transplant during the study, median OS was 23.6 months (95% CI, 10.6 to not reached). Estimated median OS among patients who had received 1, 2, or ≥3 prior AML treatments before study entry was 11.8 months (95% CI, 8.3-15.4), 7.8 months (95% CI, 5.8-9.1), and 7.0 months (95% CI, 4.9-8.8), respectively (P = .001, log-rank test) (supplemental Figure 3). No significant relationship emerged between any individual comutation and OS in univariate analyses.
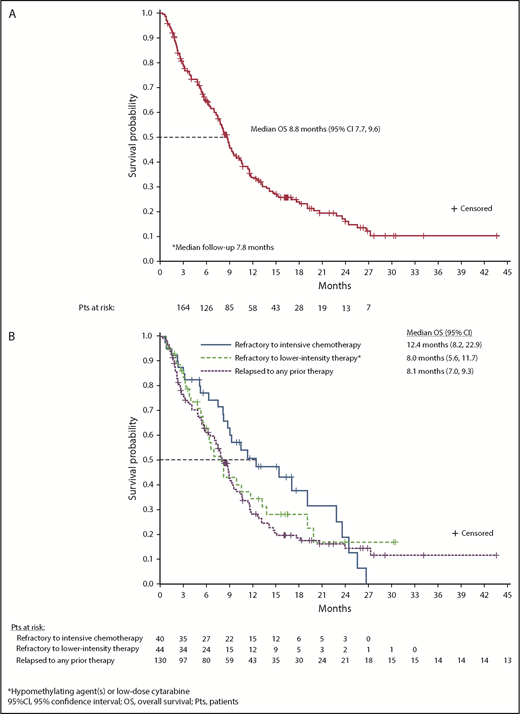
OS. (A) OS among all patients with R/R AML who received enasidenib, 100 mg/d (n = 214). (B) OS by response to prior AML treatment(s).
OS. (A) OS among all patients with R/R AML who received enasidenib, 100 mg/d (n = 214). (B) OS by response to prior AML treatment(s).
OS by prior AML treatment outcome
There was no significant difference in median OS among patient subgroups defined by response to prior AML treatment. For patients who were refractory to intensive chemotherapy prior to study entry, median OS was 12.4 months (95% CI, 8.2-22.9), for patients who were refractory to nonintensive AML treatment, median OS was 8.0 months (95% CI, 5.6-11.7), and for patients in first or later relapse, median OS was 8.1 months (95% CI, 7.0-9.3) (P = .270, log-rank test) (Figure 4B).
Survival outcomes for patients with early SD
Among the 82 patients who maintained SD for the first 90 days on study, median OS was 15.1 months (95% CI, 10.7 to not reached) for Late Responders, 9.0 months (95% CI, 7.7-11.4) for the SD Only subgroup, and 5.8 months for patients who only developed PD after day 90 (95% CI, 5.4-8.3). Estimated 1-year survival rates were 58%, 24%, and 8%, respectively. The risk of death was significantly reduced by 59% in Late Responders compared with the SD Only subgroup and was reduced by 79% compared with patients who developed PD after day 90 (supplemental Table 6). SD sustained at all response evaluations beyond day 90 was associated with a significant 51% reduced risk for death compared with early SD followed by only PD after day 90.
Discussion
Patients with relapsed or refractory AML have few available treatment options. This study demonstrates that enasidenib is an effective salvage therapy, inducing responses in ∼40% of patients with mutant-IDH2 R/R AML, many of whom had received multiple prior AML treatments. Response and survival outcomes in this larger patient group support initial findings from phase 1 of the study,14 and new analyses in this article offer further insight into enasidenib use. Enasidenib served as a bridge to transplant for several patients with R/R AML, and patients who achieved CR during enasidenib treatment had a median OS of almost 2 years. Enasidenib is noncytotoxic11 ; tolerability is especially important for older patients who may have additional comorbidities and who have received prior cytotoxic chemotherapy regimens, and it is an important consideration for use in combination regimens.
Enasidenib has been shown to promote differentiation of leukemic hematopoietic progenitor cells, producing functional neutrophils that retain the IDH2 mutation.11,13 Thus, clearance of mutant-IDH2 VAF is not required to obtain a therapeutic response; however, patients who attained CR showed significantly greater VAF reductions than did nonresponders, and these are the first data to show that clearance of IDH2 mutations was associated with a 100% clinical response rate. Substantial sustained 2-HG decreases during treatment were observed in IDH2-R140 patients. In patients with IDH2-R172 mutations, 2-HG levels were less suppressed overall; however, 2-HG reductions were significantly correlated with attainment of CR. As also demonstrated in the phase 1 portion of the study,14 there were no statistical differences in response rates or median OS between patient groups with IDH2-R140 or IDH2-R172 mutations; nominally better efficacy in patients with mutant-IDH2-R172 may reflect the significantly lower comutation burden in that group.
The presence of an FLT3 comutation at study entry was significantly associated with lack of response in the R/R AML100 cohort, and NRAS comutations were correlated with nonachievement of CR among the entire R/R AML cohort. To target multiple pathogenic mechanisms, combining enasidenib with other targeted drugs, such as an FLT3 inhibitor, or with agents with broader antileukemic activity, such as a hypomethylating agent, could improve response. In an IDH2R140Q/FLT3ITD murine AML model, combination therapy with enasidenib and the tyrosine kinase inhibitor quizartinib showed additive effects on reducing leukemic blasts in liver, spleen, and bone marrow, as well as significant reversal of hypermethylated genes, compared with either treatment alone.19 FLT3 and NRAS mutations are highly prevalent in AML, occurring in ∼20% and 15% of patients, respectively.5 RAS pathway mutations have been linked to drug resistance in other malignancies, including pediatric B-cell precursor acute lymphoblastic leukemia20 and colorectal cancer.21,22 Much effort has been made over recent decades to develop effective MEK1/2 inhibitors, although single-agent effects in AML have been relatively modest.23,24 Preliminary data from a phase 1/2 study of enasidenib with azacitidine in patients with newly diagnosed AML (NCT02677922) suggest that this combination may have additive effects on response compared with either as monotherapy.25
Although the ORR (∼40%) and CR rate (∼20%) in this larger group of patients with R/R AML corroborate those reported for the smaller cohort of patients in phase 1 of the study, we also evaluated several aspects of enasidenib therapy that had not been previously explored. Past research suggests that among prognostic factors for response to salvage therapy in R/R AML is the presence or absence of primary induction failure.26,27 These are the first data to show response rates with enasidenib among patient subgroups defined by whether they were in relapse or were resistant to prior AML treatment at study entry. Despite proportionally higher CR rates in patients who were refractory to nonintensive treatments (27%) compared with those who were refractory to induction chemotherapy (10%), survival outcomes were not statistically different between these 2 groups (median OS, 8.0 and 12.4 months, respectively). Compared with patients who were refractory to intensive chemotherapy or those who relapsed following prior AML therapy, patients who were refractory to nonintensive AML treatment options (who were likely ineligible for high-intensity chemotherapy) were substantially older and more likely to have developed AML secondary to MDS. Nevertheless, the 8-month median OS among these patients compares favorably with OS obtained with other salvage regimens in a similar patient population.4
These data also reinforce that the kinetics of response to enasidenib differ from those of intensive chemotherapy.14 In contrast to the CR-driven response paradigm that is characteristic of high-intensity chemotherapy, responses with enasidenib may require multiple treatment cycles, and initial responses may deepen with continued treatment. By restoring the activity of α-KG–dependent enzymes that regulate DNA and histone methylation, the epigenetic effects of enasidenib may be akin to those of hypomethylating agents, which can require 4 to 6 treatment cycles to induce responses.28 More than one half of responding patients in this study achieved their best response in cycle 5 or later. Given the potential for delayed response, we evaluated clinical outcomes for patients who maintained SD during initial treatment cycles. Results of these analyses also demonstrate that responses with enasidenib, as reported for other differentiating agents, can manifest gradually.29,30 Almost one third of patients who maintained SD during the first 3 months of enasidenib treatment had a later response; of them, two thirds attained complete morphologic remissions. The 2017 update to the ELN recommendations for AML states that “…it is unknown whether PD augurs a poorer prognosis than stable disease and warrants investigation.”17 The answer is likely dependent on the nature of therapy and specific AML patient populations. In our study, patients who experienced sustained SD for the duration of treatment (ie, >90 days) but who did not achieve an IWG-defined response to enasidenib had a significantly reduced risk for death compared with patients who had developed PD by their first visit after day 90. Together, these data suggest that enasidenib therapy should be continued for ≥6 months or until disease progression or intolerable toxicity.
These are the first data to demonstrate the relationship between enasidenib and transfusion independence: >40% of R/R AML100 patients who were RBC or platelet transfusion dependent at baseline attained transfusion independence during enasidenib therapy. Moreover, substantial proportions of patients who maintained SD on study, in the absence of a formal IWG-defined response, attained RBC and/or platelet transfusion independence during treatment. Transfusion independence is associated with improved survival in AML.31
As reported for other differentiating agents,30,32,33 enasidenib can induce a differentiation syndrome. IDH-DS is reported for ∼10% of patients treated with enasidenib.34 Signs or symptoms of IDH-DS are recognizable and treatable with prompt corticosteroid administration. Enasidenib treatment need not be interrupted unless severe pulmonary symptoms and/or renal dysfunction last for >48 hours after corticosteroid initiation. IDH-DS is frequently accompanied by leukocytosis, which can be effectively treated with hydroxyurea if the white blood cell count rises to >30 × 109/L.12,34
Enasidenib is an important treatment option for patients with mutant-IDH2 R/R AML. A randomized phase 3 study in older patients with late-stage mutant-IDH2 R/R AML (NCT02577406) is ongoing to evaluate the efficacy of enasidenib compared with conventional care regimens. Enasidenib is also under investigation in phase 1/2 clinical trials for use in combination therapeutic regimens in patients with newly diagnosed AML (NCT02677922; NCT02632708).
The online version of this article contains a data supplement.
The publication costs of this article were defrayed in part by page charge payment. Therefore, and solely to indicate this fact, this article is hereby marked “advertisement” in accordance with 18 USC section 1734.
Acknowledgments
This work was supported by Celgene Corporation and Agios Pharmaceuticals, Inc. Statistical support was provided by Nora Tu, formerly of Celgene Corporation. Editorial support was provided by Sheila Truten and Kelly Dittmore (Medical Communication Company, Inc., Wynnewood, PA), funded by Celgene Corporation.
Authorship
Contribution: The sponsors collected data and analyzed them in conjunction with the authors; E.M.S. prepared the first draft of the manuscript; and all authors participated in revising the manuscript and reviewed and approved its final version.
Conflict-of-interest disclosure: E.M.S. has served on advisory boards for Astellas Pharma, Daiichi, Bayer, Novartis, Pfizer, Agios, and Celgene and has received research funding from Agios, Celgene, Syros, GlaxoSmithKline, and Bayer. C.D.D. is a consultant for AbbVie, Agios, and Celgene, and has received honoraria from Bayer, Jazz, Karyopharm, MedImmune, and Syros as an advisory board member. A.T.F. has served as a consultant for Takeda, Seattle Genetics, and Celgene and has served on advisory boards for Agios, Jazz Pharmaceuticals, Boehringer Ingelheim, and Astellas Pharma. D.A.P. has received honoraria from Agios and Pfizer and has served on advisory boards for Pfizer, Celyad, Agios, Celgene, AbbVie, Argenx, and Curis. R.M.S. has served as a consultant for AbbVie, Agios, Amgen, Arog Pharmaceuticals, Astellas Pharma, Celator Pharmaceuticals, Celgene, Cornerstone, FUJIFILM Pharmaceuticals, Janssen, Jazz Pharmaceuticals, Juno Therapeutics, Karyopharm, Merck, Novartis, Ono Pharmaceutical, Orsenix, Pfizer, Roche, and Sumitomo; has received research funding from Agios, Arog Pharmaceuticals, and Novartis; has served on advisory boards for Actinium; has served on data safety monitoring boards for argenx and Celgene; and has served on a steering committee for Celgene. J.K.A. has served on advisory boards for Syros, Astellas Pharma, Janssen, Novartis, Seattle Genetics, Spectrum, ARIAD Pharmaceuticals, Bristol-Myers-Squibb, Immune Pharmaceuticals, Agios, and Celgene, serves on a data safety and monitoring committee for GlycoMimetics; her institution has received research funding from MethylGene, Boehringer Ingelheim, Astellas Pharma, Agios, Bristol-Myers-Squibb, CSL Limited, Cyclacel Pharmaceuticals, Epizyme, Genentech, Pfizer, BioLineRX, Talon Therapeutics, Celgene, Amphivena, and FUJIFILM Pharmaceuticals. G.J.R. has served as a consultant for Celgene, Agios, AbbVie, Amgen, Amphivena, argenx, Array BioPharma, Astex, AstraZeneca, Bayer, Celator Pharmaceuticals, Celltrion, Clovis Oncology, CTI BioPharma, Eisai, Genoptix, Immune Pharmaceuticals, Janssen, Jazz Pharmaceuticals, Juno Therapeutics, MEI Pharma, MedImmune, Novartis, Onconova, Orsenix, Pfizer, Roche/Genentech, Sunesis, and Sandoz and has received research support from Cellectis. R.C. has received research funding from Agios. I.W.F. has received research funding from Acerta, Agios, BeiGene, Calithera, Celgene, Constellation, Curis, Forma, Forty Seven, Genentech, Gilead, Incyte, Janssen, Merck, Novartis, Pfizer, Pharmacyclics, Seattle Genetics, Takeda, TG Therapeutics, and Verastem. M.A.S. has served on advisory boards for Celgene. A.S.S. has served on advisory boards for Stemline Therapeutics and has served on speakers’ bureaus for Amgen and Celgene. H.M.K. has received research funding from Amgen, ARIAD Pharmaceuticals, Astex, Bristol-Myers-Squibb, Novartis, and Pfizer. R.L.L. is on the supervisory board of QIAGEN and is a scientific advisor for Loxo, Imago, C4 Therapeutics, and Isoplexis, which each include an equity interest; receives research support from and has consulted for Celgene and Roche; has received research support from Prelude Therapeutics; has acted as a consultant for Incyte, Novartis, Morphosys, and Janssen; and has received honoraria from Lilly and Amgen for invited lectures and from Gilead for grant reviews. K.J.M., A.T., Q.X., T.L., and A.R. are employed by and own stock in Celgene Corporation. J.V. and I.G. were employed by Celgene Corporation at the time of the study. K.E.Y., B.W., and E.C.A. are employed by and own stock in Agios. M.S.T. has received research funding from Arog Pharmaceuticals, Bioline, Cellerant Therapeutics, ADC Therapeutics, Celgene, Daiichi Sankyo, and Orsenix. S.d.B. has served on advisory boards for Agios, Celgene, Pfizer, Novartis, Servier, Pierre Fabre, Bayer, Seattle Genetics, Carthagenetics, and FORMA Therapeutics and has received research funding from Agios. The remaining authors declare no competing financial interests.
The current affiliation for J.V. is Precision for Medicine, Inc., Bethesda, MD.
The current affiliation for I.G. is GlaxoSmithKline Pharmaceuticals Ltd., Mumbai, India.
Correspondence: Eytan M. Stein, Leukemia Service, Department of Medicine, Memorial Sloan Kettering Cancer Center, 1275 York Ave, New York, NY 10065; e-mail: steine@mskcc.org
