

Abstract
To date, the choice of therapy for an individual multiple myeloma patient has been based on clinical factors such as age and comorbidities. The widespread evolution, validation, and clinical utilization of molecular technologies, such as fluorescence in situ hybridization and next-generation sequencing has enabled the identification of a number of prognostic and predictive biomarkers for progression-free survival, overall survival, and treatment response. In this review, we argue that in order to continue to improve myeloma patient outcomes incorporating such biomarkers into the routine diagnostic workup of patients will allow for the use of personalized, biologically based treatments.
Introduction
Myeloma develops as the result of an evolutionary process during which a normal plasma cell moves through the premalignant state monoclonal gammopathy of uncertain significance to smoldering myeloma and myeloma that requires treatment.1 Advances in therapy over the last 2 decades have improved patient outcomes, while the use of new technology has increased our understanding of the molecular drivers that underlie disease initiation and progression. Due to underlying molecular variation, the clinical disease course is very heterogeneous.2 While some patients experience long remission periods or functional cures, others relapse early or are refractory to therapy. In order to continue to improve outcomes, information regarding the molecular abnormalities driving these differences in outcomes needs to be incorporated into clinical care. These features may relate to messenger RNA (mRNA), DNA, or protein changes, but the aim is to identify aberrations that help inform the diagnosis, outcome, or treatment relevant to a specific patient or subgroup of patients. Such molecular features or biomarkers are defined by the NIH Biomarkers Definitions Working Group as “a characteristic that is objectively measured and evaluated as an indicator of normal biological processes, pathogenic processes, or pharmacologic responses to a therapeutic intervention.”3
The purpose of using biomarker-driven, personalized, treatment approaches is to maximize benefit and reduce toxicity. In order to achieve this goal, the biomarker must be measurable in a robust and reproducible manner. Advances in technology have helped the identification and validation of myeloma biomarkers relevant to treatment, such as those that can predict outcome for patients based on differences in survival (prognostic biomarkers) or target treatment to subsets of patients based on specific molecular pathology (predictive biomarkers). Some biomarkers can clearly be both prognostic and predictive, and approaches to target these are likely to have the greatest impact on outcomes.
In this review, we describe the current use of prognostic and predictive biomarkers in myeloma and speculate on advances that may enable further improvement in patient outcomes by employing these biomarkers to define personalized treatment strategies.
Advances in molecular profiling technologies enabling the identification of biomarkers
The technologies enabling molecular profile analysis have evolved significantly over the last few decades, contributing to an increased understanding of myeloma pathogenesis (Figure 1). Initial studies were performed using G-banding cytogenetics that identified translocations involving the immunoglobulin heavy chain (IgH) gene locus and hyperdiploidy as initiating events.4,5 Translocations including t(4;14), t(6;14), t(11;14), t(14;16), and t(14;20) place oncogenes, MMSET/FGFR3, CCND3, CCND1, MAF, and MAFB, respectively, under the control of the IgH gene enhancer.6,7 The downstream effect of upregulation of these genes converges on the increased expression of cyclin D protein family members, ultimately driving G1/S checkpoint dysregulation.8 Hyperdiploidy, characterized by trisomies of odd-numbered chromosomes, also affects this checkpoint, although the mechanism of its acquisition and downstream effect is less well understood. Subsequent studies have shown that secondary acquired lesions compound the cell cycle dysregulation, driving further proliferation and disease progression.9
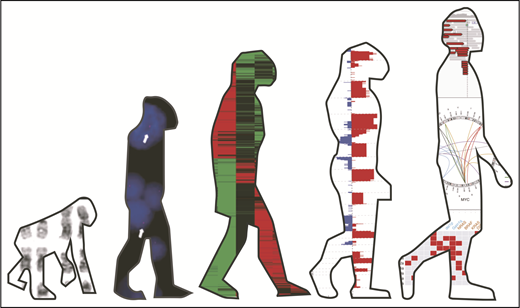
Evolution of molecular analysis techniques in myeloma. Images from left to right show G-band karyotyping, FISH, GEP data, SNP array data, and NGS data. Karyotype images were reprinted from Panagopoulos et al.88 FISH images were reprinted from Fernando et al.89 GEP images were reprinted from André et al.90 SNP array and NGS images were reprinted from Bolli et al.91
Evolution of molecular analysis techniques in myeloma. Images from left to right show G-band karyotyping, FISH, GEP data, SNP array data, and NGS data. Karyotype images were reprinted from Panagopoulos et al.88 FISH images were reprinted from Fernando et al.89 GEP images were reprinted from André et al.90 SNP array and NGS images were reprinted from Bolli et al.91
The use of fluorescence in situ hybridization (FISH), gene expression profiling (GEP), and single-nucleotide polymorphism (SNP) array technologies has expanded our knowledge of myeloma biology and enabled its further classification into subgroups.8,10,11 Cases cluster mainly based on the underlying structural genetic event (translocations and hyperdiploidy), with 2 classification systems surviving the test of time: the TC (translocation/cyclin D) classification8 and University of Arkansas for Medical Sciences10 subgroups.
In more recent years, the introduction of next-generation sequencing (NGS) technologies has allowed the identification of single-nucleotide variants as well as larger structural changes, including translocations and copy-number abnormalities, more quickly and cheaply.12-15 Dozens of myeloma driver genes have been identified. The most common occur in the RAS and NF-κB families,12,14,16 with many mutations associated with the primary myeloma molecular subgroups suggesting the underlying background initiating event drives the acquisition of subsequent molecular abberations.13 A number of these new technologies are now Clinical Laboratory Improvement Amendments certified and available for diagnostic use, while additional techniques such as DNA methylation analysis remain confined to research laboratories.
Advances in prognostic biomarkers
Prognostic biomarkers are used to identify the likelihood of disease relapse and/or predict overall survival. Classically, they predict outcome irrespective of what therapy is given and enable more personalized outcome advice in the context of current treatment regimens. Several lesions have been identified as carrying an adverse outcome in myeloma. Some of these are clonal initiating lesions such as t(4;14), t(14;16), and t(14;20), while others are structural chromosomal changes or mutation events that tend to happen later in the evolutionary process.
t(4;14): incidence 10% to 15% at diagnosis
t(4;14) results in the histone methyltransferase (MMSET) and tyrosine kinase (FGFR3) genes being placed downstream of IgH gene enhancers.17 The spiked expression of MMSET is likely responsible for the adverse outcome, as the outcome is equally as poor in the subset of patients with concomitant loss of FGFR3 expression.17,18 MMSET results in epigenetic reprogramming, leading to a cascade of downstream effects, including altered adhesion, enhanced growth, and increased cell survival.19 This reprogramming also leads to genetic instability, including gain of chromosome 1q (gain(1q)), deletion of the short arm of chromosome 12 (del(12p)), del(13q), del(22q), and BIRC2/3 homozygous deletion, that may contribute to mediate the adverse outcomes.20 In comparison with other risk groups, t(4;14) is particularly heterogeneous in terms of outcome, potentially influenced by these additional lesions and/or co-occurrence of del(17p).21
t(14;16)/t(14;20): incidence 2% to 4% at diagnosis
Upregulation of MAF and MAFB is seen in t(14;16) and t(14;20), respectively, and is associated with similar genetic instability including the lesions gain(1q) and del(17p). These subgroups are also associated with a mutational signature (a characteristic combination of mutation types) associated with the activity of the mRNA editing enzyme APOBEC and have an increased number of mutations.16 MAF and MAFb protein have been demonstrated to mediate resistance to proteasome inhibitors,22,23 perhaps contributing to this subgroup’s adverse outcome seen in most,2,24,25 though not all,26 studies.
Del(17p): incidence 8% to 10% (using threshold of 20% positive cells)
Del(17p) has been associated with adverse outcome, which is thought to be related to the loss of expression of the tumor suppressor gene TP53.27 While occasional studies suggest deletions in <20% of cells detected by FISH may have some clinical impact,28 most studies use a cutoff of >20% to demonstrate a significant effect.29,30 As the clone size increases, the effect on outcome becomes more marked, with some studies suggesting that clonal deletion in at least 60% of cells is required.31 More recent data suggest that biallelic disruption by biallelic deletion, deletion in one allele and TP53 mutation in the other allele, or biallelic mutation is what mediates the adverse outcome.29,32
Gain(1q): incidence 30% to 35% at diagnosis
Gain(1q) has been associated with an adverse outcome, although given the large number of genes situated on this chromosome, it is less clear which gene is responsible. Implicated genes at the most commonly gained locus (1q21) include BCL9, MCL1, CKS1B, and ANP32E.33-36 This locus is thought to be susceptible to gain due to instability of the pericentromeric chromatin.37 Other genes may also be important (eg, CD45 at 1q32) when larger regions of the chromosome are gained.38 There is an important distinction between gain, defined as one additional copy, and amplification, defined as >1 additional copy of 1q (amp[1q]), with amplified cases appearing to be associated with a more adverse outcome.15,20,32
Other translocations/copy-number abnormalities
Del(1p) (incidence 10% at diagnosis) frequently co-occurs with gain(1q) and has been shown to be associated with an adverse outcome in patients undergoing autologous stem cell transplant. This effect is potentially mediated by loss of CDKN2C and FAF1 at 1p32 and/or FAM46C at 1p12 and/or RPL5 and EVI5 at 1p22.24,39,40
Myc aberrations (incidence 15% to 20% at diagnosis) are common and may be mediated by secondary translocations to the MYC locus at 8q22 or copy-number change and are associated with adverse outcomes.41,42
t(11;14) and hyperdiploidy are usually considered standard risk. Some studies suggest that individual trisomies may be able to overcome some of the adverse impact of other lesions such as t(4;14) and del(17p), with trisomy 3 appearing to have the greatest impact.43,44 Another study looking at the impact of hyperdiploidy in this setting had conflicting findings.45
Mutations
Mutations associated with adverse outcome that may function as prognostic biomarkers have also been identified and include those in CCND1 and DNA repair pathway genes (TP53, ATM, ATR and ZFHX4).15,42 Some mutations associated with a favorable outcome have also been identified eg, IRF4 and EGR1. Mutational analysis of genomic instability can also predict for adverse outcomes with increases in genome-wide loss of heterozygosity associated with adverse outcomes.46
RNA alterations
While DNA-based assays are able to identify individual lesions and markers of global genomic instability, RNA and GEP can be used to detect markers of increased proliferation and specific pathway expression changes.47 The GEP scores of 70 genes (GEP70; MyPRS)48 or 92 genes (SKY92)49 have prognostic capabilities better than using any single lesion discussed above. They identify high-risk outcomes in ∼15% of patients at diagnosis. Their perceived limitations lie in the lack of widespread availability and computational analysis required to interpret the results.
Novel fusion genes have also been identified in myeloma using RNA sequencing data, and some have been associated with adverse outcome, such as CSNK1G2 and CCND1 (with shortened progression-free survival [PFS]) and MMSET and BCL2L11 (with shortened overall survival [OS]).50
Other disease features
Other features of disease may also indicate high-risk outcomes for patients and hence act as prognostic biomarkers. The presence of plasma cells with blastic morphology, renal failure, extramedullary disease,51 and plasma cell leukemia at diagnosis all predict for worse outcomes. Circulating plasma cells are also associated with adverse outcomes, even if levels do not meet the criteria for plasma cell leukemia.52,53 Recent studies have shown that the number and size of focal lesions on positron emission tomography computed tomography and magnetic resonance imaging also predict for a poor outcome independent of molecular features.54
Risk stratification systems: incorporating biomarkers
With advances in technology and the increase in size of the data sets examined, the information concerning the clinical impact of the presence of these molecular lesions has changed. This has resulted in a shift from using a single lesion to define high-risk disease to the use of 2 or 3 collaborating lesions. In addition, as so-called high-risk lesions can occur in up to 30% to 50% of patients, the need to identify a smaller group (eg, <15%) of patients who truly perform poorly regardless of therapy has become apparent. Such patients can be considered “ultrahigh-risk” and have been identified by the presence of more than 1 adverse lesion, by the R-ISS, or as double-hit myeloma (Figure 2).
![Figure 2. Risk stratification systems and outcome. PFS as defined by the different risk stratification systems. (A) Ultrahigh risk defined by the presence of >1 adverse lesion (t(4;14), t(14;16), t(14;20), del(17p), and gain(1q)) in the analysis of 869 cases from the MRC Myeloma IX trial (published 2011). Reprinted from Boyd et al24 with permission. (B) Ultrahigh risk defined by the R-ISS (low-risk R-ISS group I [ISS stage I with no high-risk CA (del(17p) and/or t(4;14 and/or 14;16)) and normal LDH level] to high-risk R-ISS group III [ISS stage III and high-risk CA or high LDH level]) in a pooled study of 4445 patients with newly diagnosed multiple myeloma from 11 clinical studies (published 2016). Reprinted from Palumbo et al55 with permission. (C) Ultra high-risk defined as double-hit myeloma (either loss of both alleles of TP53 [by mutation, deletion or both] or with 2 extra copies of 1q, resulting in amplification rather than a single gain) by incorporating NGS data in the Myeloma Genome Project analysis of 784 patients (published 2018). Reprinted from Walker et al.32](https://ash.silverchair-cdn.com/ash/content_public/journal/blood/133/7/10.1182_blood-2018-09-825331/3/m_blood825331f2.png?Expires=1770180418&Signature=mVQDYpXr2Qv~8QbXXmhWdQCCPgfzoq56qkBt9738wUn4FVX0pIFvFHez8fqxQzQdkAF-w63SB9zLtvDjdqGeuz0J-ANmpohiyLaYF5uZQ5fuNu1yvdUKOQZpIX3VoCKCcNksYbmPedcAAXY62UY6RbCDWUFP8e-VZQ4fumb40c5gKwkFH2Z2gCen6RFYVfQ18JaCrvj-GzkpcYEZ7rVFQaQueS8Fk8Y86RP4y1yhH9Ama~9UIYZkKNcjVpdNWBHWq~BxpT4nsugoqte1N1CspwybXqFbNLgHSPSAd~LlJyAPNpvGpdQDJxxZIhibDw9yOmBFql3zimwnFXJPqewW9A__&Key-Pair-Id=APKAIE5G5CRDK6RD3PGA)
Risk stratification systems and outcome. PFS as defined by the different risk stratification systems. (A) Ultrahigh risk defined by the presence of >1 adverse lesion (t(4;14), t(14;16), t(14;20), del(17p), and gain(1q)) in the analysis of 869 cases from the MRC Myeloma IX trial (published 2011). Reprinted from Boyd et al24 with permission. (B) Ultrahigh risk defined by the R-ISS (low-risk R-ISS group I [ISS stage I with no high-risk CA (del(17p) and/or t(4;14 and/or 14;16)) and normal LDH level] to high-risk R-ISS group III [ISS stage III and high-risk CA or high LDH level]) in a pooled study of 4445 patients with newly diagnosed multiple myeloma from 11 clinical studies (published 2016). Reprinted from Palumbo et al55 with permission. (C) Ultra high-risk defined as double-hit myeloma (either loss of both alleles of TP53 [by mutation, deletion or both] or with 2 extra copies of 1q, resulting in amplification rather than a single gain) by incorporating NGS data in the Myeloma Genome Project analysis of 784 patients (published 2018). Reprinted from Walker et al.32
Risk stratification systems and outcome. PFS as defined by the different risk stratification systems. (A) Ultrahigh risk defined by the presence of >1 adverse lesion (t(4;14), t(14;16), t(14;20), del(17p), and gain(1q)) in the analysis of 869 cases from the MRC Myeloma IX trial (published 2011). Reprinted from Boyd et al24 with permission. (B) Ultrahigh risk defined by the R-ISS (low-risk R-ISS group I [ISS stage I with no high-risk CA (del(17p) and/or t(4;14 and/or 14;16)) and normal LDH level] to high-risk R-ISS group III [ISS stage III and high-risk CA or high LDH level]) in a pooled study of 4445 patients with newly diagnosed multiple myeloma from 11 clinical studies (published 2016). Reprinted from Palumbo et al55 with permission. (C) Ultra high-risk defined as double-hit myeloma (either loss of both alleles of TP53 [by mutation, deletion or both] or with 2 extra copies of 1q, resulting in amplification rather than a single gain) by incorporating NGS data in the Myeloma Genome Project analysis of 784 patients (published 2018). Reprinted from Walker et al.32
Presence of more than one adverse cytogenetic lesion
Translocations and copy-number change associated with adverse outcome as described above have been demonstrated to be cumulative such that the presence of >1 lesion predicts for a worse outcome than 1 lesion alone.20,24 In the MRC Myeloma IX study (Figure 2A), patients with >1 adverse lesion were termed ultrahigh-risk and comprised 15% of patients.
R-ISS
The Revised International Staging System (R-ISS) score built on this concept and incorporates β2-microglobulin, albumin (from the previously used ISS), and lactate dehydrogenase (LDH) with structural lesions to more accurately predict risk. Risk is categorized into 3 groups, from low-risk R-ISS group I (ISS stage I, no high-risk cytogenetic abnormality [CA] [del(17p) and/or t(4;14 and/or 14;16)] and normal LDH level) to high-risk R-ISS group III (ISS stage III and high-risk CA or high LDH level) (Figure 2B).55 Between 10% and 18% of patients are classified as R-ISS III.55-58 In this system, each feature contributes equally to the risk group determination. As more data become available and the understanding of how these features reflect myeloma biology increases, it can be envisaged that staging systems will be refined and features will be weighted.
Double-hit myeloma
Building on the scores defined above the Myeloma Genome Project incorporated NGS and structural abnormalities to better define risk (Figure 2C).32 The study defined the highest-risk patients as “double hit” myeloma; that is, patients with 2 hits to the same gene (either loss of both alleles of TP53 [by mutation, deletion, or both] or with 2 extra copies of 1q resulting in amplification rather than a single gain). This group comprises 6% to 10% of patients and has a greater prognostic power than the R-ISS. A number of other groups have confirmed the importance of knowing both the copy-number and TP53 mutation status, and this lesion along with amp(1q) now represents the most recent refinement in myeloma risk prediction.
Interestingly, there remains a subset of patients carrying none of the molecular lesions discussed above who still relapse early. Such patients can be considered high risk phenotypically, as these patients in addition to having a short first PFS have a poor OS. Hence, having become apparent, such patients may require therapy different to standard treatment at first relapse.59 Ongoing molecular studies may help to identify the currently unrecognized drivers in this early relapse group, as altering upfront therapy remains likely to have the greatest benefit on long-term survival.
Prognostic biomarkers at different disease time points
The biomarkers described above were largely described in newly diagnosed patients. Many adverse risk biomarkers become more frequent at later stages of the disease but still retain prognostic significance. Other biomarkers that can be incorporated later include response to therapy, especially when assessed by quantification of minimal residual disease (MRD) in the bone marrow (by NGS or next-generation flow cytometry)60-62 or by imaging techniques.63
Risk-adapted therapy for high-risk groups
Aside from providing important prognostic information, the true benefit of identifying patients at high risk of early progression or death is to intervene and deliver therapy other than the standard treatment. Such approaches are being investigated in several clinical trials. One of the challenges for these studies is that response rates generally do not differ between patients with high-risk and standard-risk disease, as the natural history of high-risk patients is to respond well but relapse early. As such, the depth of response may not have the same prognostic importance in high-risk groups. In patients defined as del(17p) or ≥2 cytogenetic abnormalities, stringent complete response and MRD negativity did not translate into a superior PFS or OS.64 Early data suggest that at deeper levels of MRD analysis, this drawback may be overcome, and confirmatory studies are awaited.65
Trials concentrating on high-risk disease can be performed in 2 ways. In all-comer trials, the high-risk subgroup can be analyzed and reported separately and compared with non–high-risk patients, or trials can be specifically designed to optimize therapy for a prospectively recruited high-risk group (Figure 3A-B). The first approach provides reassurance on subgroup analysis that a given treatment shows as much benefit in the high-risk as standard-risk population, but claims of efficacy in the smaller high-risk population will be limited by the statistical power, and so large trials are required. The latter approach ensures studies are correctly powered to assess impact specifically in high-risk patients; however, the definition of high risk needs to be uniform and use reproducible biomarkers.
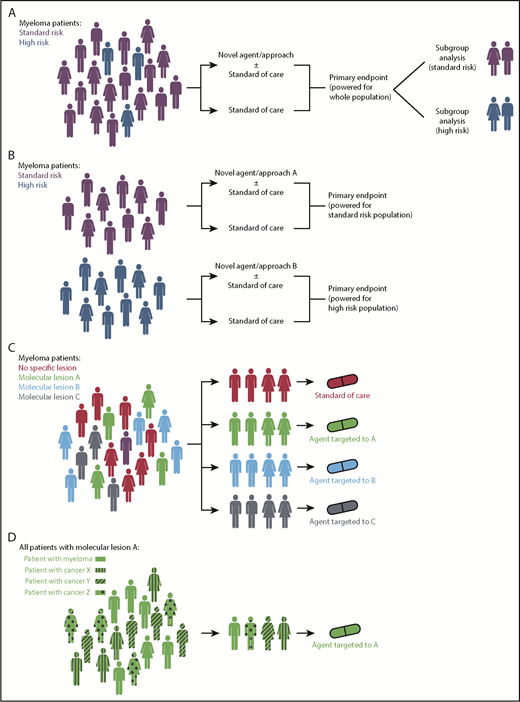
Clinical trial design strategies for personalized treatment in myeloma. (A) Current standard approach with all patients recruited and treated as part of a clinical trial with subsequent subgroup analysis that may or may not be adequately powered to examine the effect of the novel strategy in high-risk patients. (B) Trial design for high-risk patients who are identified upfront and entered into dedicated protocols. These may be phase 2 or 3 randomized studies (as shown) or earlier-phase single-arm studies. (C) Umbrella trial design with patient molecular lesions identified upfront and entered into an arm examining a therapy appropriate to that lesion. (D) Basket trial design with patients with different cancers but with a shared molecular lesion entered into a study with an agent targeted to that lesion. Figures of men and women were downloaded from https://www.aiga.org/symbol-signs (free to use).
Clinical trial design strategies for personalized treatment in myeloma. (A) Current standard approach with all patients recruited and treated as part of a clinical trial with subsequent subgroup analysis that may or may not be adequately powered to examine the effect of the novel strategy in high-risk patients. (B) Trial design for high-risk patients who are identified upfront and entered into dedicated protocols. These may be phase 2 or 3 randomized studies (as shown) or earlier-phase single-arm studies. (C) Umbrella trial design with patient molecular lesions identified upfront and entered into an arm examining a therapy appropriate to that lesion. (D) Basket trial design with patients with different cancers but with a shared molecular lesion entered into a study with an agent targeted to that lesion. Figures of men and women were downloaded from https://www.aiga.org/symbol-signs (free to use).
Subgroup analysis of previously reported clinical trials has led to several approaches being suggested for high-risk patients. This includes the observation that proteasome inhibitors overcome some of the adverse outcomes associated with t(4;14)±del(17p) lesions.66 The initial data were based on a small subgroup analysis of the VISTA study. Subsequent studies, and a meta-analysis, confirmed that bortezomib-based induction results in improved outcomes vs non–bortezomib-based induction but does not fully overcome the adverse prognostic impact of these lesions.67,68 A similar pattern is seen with lenalidomide maintenance after autologous transplant,69 suggesting that novel agents can ameliorate, but not abrogate, adverse outcomes associated with high-risk disease. Studies in relapsed patients of the novel proteasome inhibitors carfilzomib and ixazomib also support this concept with a benefit over the control arm of the relevant studies in high-risk patients but continued suboptimal outcomes compared with standard-risk patients.70,71 More recently, tandem autologous transplant, posttransplant consolidation, and maintenance have all proved effective for newly diagnosed high-risk patients compared with standard of care72 and may to some extent attenuate unfavorable outcomes, but no strategy to date is able to completely overcome the adverse effect of high-risk lesions. Prospective recruitment of high-risk patients to dedicated protocols is needed.
High-risk patients are currently being recruited into a number of ongoing trials (Table 1). One example is the Total Therapy (TT) series of studies that initially started as risk-agnostic (TT1–TT3a/b) and later moved to high-risk studies (TT5, TT5b, and TT7). The phase 2 TT5 trial73 recruited patients with GEP70-defined high-risk disease and delivered dose-dense chemotherapy, minimizing breaks between treatment phases by administering less intense therapy blocks aiming to prevent relapses that have been observed to occur during treatment breaks, such as during recovery from autologous transplant. Patients were compared with risk-matched patients in TT3, and no significant differences in survival were identified. However, the number of patients relapsing in the early treatment courses decreased, with patients tending to relapse during the later maintenance phase. The latter iterations of the protocol (TT5b and TT7) have concentrated on this phase of treatment and are incorporating newer proteasome inhibitors and immune-based approaches.
Clinical studies specifically targeting high-risk disease in newly diagnosed myeloma patients
| NCT number | Status | Location | Phase | Treatment schema | Definition of high risk used in the study | |
|---|---|---|---|---|---|---|
| Reported studies | ||||||
| TT5 2008-02: A Trial for High-risk Myeloma Evaluating Accelerating and Sustaining Complete Remission | NCT00869232 | Active, not recruiting | US | 2 | Induction: M-VTd-PACE | GEP70-defined high-risk gene expression profiling |
| Two ASCTs: | ||||||
| MEL80-VRd-PACE and 2 intertransplant cycles with MEL20-VTd-PACE | ||||||
| Maintenance (3 years): VRd alternating with VMd | ||||||
| Ongoing studies | ||||||
| Novel intensified combinations | ||||||
| TT5b 2012-02: A Trial For High-Risk Myeloma Evaluating Accelerating and Sustaining Complete Remission | NCT02128230 | Recruiting | US | 2 | Induction: M-KTd-PACE | GEP70-defined high-risk gene expression profiling |
| Two ASCTs: | ||||||
| MEL80-KTd-PACE, and 1 intertransplant cycle with MEL20-KTd-PACE | ||||||
| Consolidation: KTd-PACE | ||||||
| Maintenance (year 1): KRd | ||||||
| Maintenance (year 2): Kd | ||||||
| MUK9b: OPTIMUM treatment protocol | NCT03188172 | Recruiting | UK | 2 | Induction: Dara-CVRd | 2 of (4;14), t(14;16), t(14;20), del(17p), gain(1q), or del(1p) |
| ASCT (with ongoing bortezomib) | SKY92-defined high-risk gene expression profiling | |||||
| Consolidation 1: Dara-VRd | Plasma cell leukemia | |||||
| Consolidation 2: Dara-VR | ||||||
| Maintenance: Dara-R | ||||||
| TT7 2015-12: a study exploring the use of early and late consolidation/maintenance therapy | NCT03004287 | Recruiting | US | 2 | Induction: KTd-Dara-PACE | GEP70-defined high-risk gene expression profiling |
| ASCT1 with Dara immunological consolidation | LDH ≥360 U/L Plasma cell leukemia | |||||
| Consolidation 1: Dara-Kd | ||||||
| ASCT2 with Dara immunological consolidation | ||||||
| Maintenance: Dara-Kd alternating with Dara-Rd in 3 month blocks | ||||||
| GMMG-CONCEPT: Evaluation induction, consolidation and maintenance treatment with isatuximab, carfilzomib, lenalidomide and dexamethasone | NCT03104842 | Recruiting | DE | 2 | TE and TNE pathways | Presence of ≥1 of the following cytogenetic abnormalities (determined by FISH): del(17p) in ≥10% of purified cells, t(4;14), >3 copies +1q21 |
| Induction: Isatuximab-KRd | ISS stage II or III (all patients) | |||||
| ASCT (if TE eligible) | ||||||
| Consolidation (if TE eligible): Isatuximab-KRd | ||||||
| Maintenance: Isatuximab-KR | ||||||
| S1211: bortezomib, dexamethasone, and lenalidomide with or without elotuzumab in treating patients with newly diagnosed high-risk multiple myeloma | NCT01668719 | Recruiting | US | 1/2 | Induction: Elotuzumab-VRd | GEP70- or SKY92-defined high-risk gene expression profiling t(14;16) and/or t(14;20) and/or del(17p) by FISH or cytogenetics |
| Maintenance: Elotuzumab-VRd | Plasma cell leukemia | |||||
| vs | LDH ≥2× IULN | |||||
| Induction: VRd | 1q21 amplification by FISH analysis | |||||
| Maintenance: VRd | ||||||
| IFM 2018-04: An intensive program with quadruplet induction and consolidation plus tandem autologous stem cell transplantation in newly diagnosed high risk multiple myeloma patients: a phase 2 study of the Intergroupe Francophone du Myélome | NCT03606577 | Not yet recruiting | FR | 2 | Induction: Dara-KRd | FISH analysis: del(17p), or t(14;16) or t(4;14). The FISH-positivity cutoff value for defining the presence of del(17p) in this study is specified as 50% |
| Tandem ASCT | ||||||
| Consolidation: Dara-KRd | ||||||
| Maintenance: Dara-R | ||||||
| A single arm study of carfilzomib in transplant eligible high risk multiple myeloma | NCT02217163 | Active, not recruiting | SG | 2 | Induction: KCd | ISS III |
| ASCT | Del(17p), t(4;14), t(14;16), t(14;20), gain(1q) | |||||
| Subsequent treatment at clinician discretion | ||||||
| Autogenic/allogenic approaches | ||||||
| Autologous or syngeneic stem cell transplant followed by donor stem cell transplant and bortezomib in treating patients with newly diagnosed high-risk, relapsed, or refractory multiple myeloma | NCT00793572 | Active, not recruiting | US | 2 | Induction: VAD | Any abnormal karyotype by metaphase analysis except for isolated t(11,14) and constitutional cytogenetic abnormality |
| ASCT | FISH detection of t(4;14), t(14;16), or del(17p) | |||||
| Allogeneic transplant (related or unrelated) | β2-microglobulin >5.5 mg/L | |||||
| Maintenance: V | Cytogenetic hypodiploidy | |||||
| Plasmablastic morphology (≥2%) | ||||||
| Allogeneic hematopoietic stem cell transplantation with ixazomib for high risk multiple myeloma (BMT CTN 1302) | NCT02440464 | Recruiting | US | 2 | Ixazomib vs placebo after allogeneic transplant | Del(13), gain(1q), del(1p), t(4;14), t(14;16), t(14;20), del(17p), or high-risk criteria based on commercially available GEP |
| Plasma cell leukemia | ||||||
| Relapsed within 18 mo of first-line therapy | ||||||
| ECT-001 (UM171): expanded cord blood transplant to treat high-risk multiple myeloma | NCT03441958 | Recruiting | CA | 1/2 | ECT-001 (UM171) expanded cord blood allogeneic transplant | t(4;14), t(14;16), t(14;20), del(17p13), chromosome 1 abnormalities with ISS II or III |
| Revised-ISS III | ||||||
| Plasma cell leukemia | ||||||
| Refractory to first line triplet bortezomib-based induction treatment. | ||||||
| ≥2 cytogenetics abnormalities as defined above regardless of ISS stage | ||||||
| Nonmyeloablative allogeneic stem cell transplant followed by bortezomib in high-risk multiple myeloma patients | NCT02308280 | Recruiting | CA | 2 | Nonmyeloablative allogeneic transplantation followed by bortezomib for 1 y after a bortezomib-based induction and ASCT | ISS III |
| Del(17p13), t(4;14) with ISS II or III, t(14;16), t(14;20), and chromosome 1 abnormalities by FISH | ||||||
| Plasma cell leukemia | ||||||
| Patients ≤50 y, regardless of cytogenetics or ISS stage | ||||||
| Immunotherapy approaches | ||||||
| Upfront CAR T-BCMA with or without huCART19 in high-risk multiple myeloma | NCT03549442 | Recruiting | US | 1 | CART-BCMA ± huCART19 | β2-microglobulin ≥5.5 mg/L and LDH greater than upper limit of normal |
| High-risk FISH features: del(17p), t(14;16), t(14;20), t(4;14) in conjunction with β2-microglobulin ≥5.5 mg/L (ie, revised ISS stage III) | ||||||
| Metaphase karyotype with >3 structural abnormalities (except hyperdiploidy) | ||||||
| Plasma cell leukemia (>20% plasma cells in peripheral blood) | ||||||
| Failure to achieve partial response or better to initial therapy with an “IMiD/PI” combination (thalidomide, lenalidomide, or pomalidomide in combination with bortezomib, ixazomib, or carfilzomib) | ||||||
| Early progression on first-line therapy | ||||||
| CAR T-19 post-ASCT for multiple myeloma | NCT02794246 | Active, not recruiting | US | 2 | CD19 CAR T administered after ASCT | Any of the following high-risk cytogenetic features, documented by FISH or metaphase karyotyping: del(17p), t(4;14), t(14;16), t(14;20) |
| Standard-risk cytogenetics but elevated LDH and β2-microglobulin > 5.5 mg/L (ie, R-ISS stage III) | ||||||
| Study of T cells targeting CD19/BCMA (CAR T-19/BCMA) for high-risk multiple myeloma following ACST | NCT03455972 | Recruiting | CN | 1 | Anti-CD19/BCMA CAR T administered after ASCT | Not achieved VGPR before stem cell mobilization |
| R-ISS stage III | ||||||
| Extramedullary disease | ||||||
| Del(17p), t(4;14), t(14;16) | ||||||
| Pembrolizumab + lenalidomide post-ASCT in high-risk multiple myeloma | NCT02906332 | Active, not recruiting | US | 2 | Pembrolizumab and lenalidomide maintenance post-ASCT | ISS stage III |
| Del(13q), amp(1q), del(1p), p53 deletions (17p deletions), t(4;14), t(14;16), t(14;20), hypodiploidy | ||||||
| High-risk GEP scores | ||||||
| 2015-10: Expanded natural killer cells and elotuzumab for high-risk myeloma post-ASCT | NCT03003728 | Not yet recruiting | US | 2 | Elotuzumab and expanded natural killer cells post-ASCT | GEP70 or GEP80-defined high-risk gene expression profiling |
| Metaphase cytogenetic abnormalities | ||||||
| LDH ≥360 U/L | ||||||
| Completed, as yet unreported studies | ||||||
| Bortezomib, doxorubicin hydrochloride liposome, and dexamethasone followed by thalidomide and dexamethasone with or without bortezomib in treating patients with multiple myeloma | NCT00458705 | Completed | US | 2 | Induction: VDd (D = liposomal doxorubicin) Consolidation: VTd or Td | ISS stage II or III |
| Soft-tissue plasmacytoma | ||||||
| Primary resistant myeloma, defined as unchanged or progressive disease despite 2 courses of standard treatment | ||||||
| Combination bortezomib-containing regimens in newly diagnosed patients with t(4;14)-positive multiple myeloma | NCT00570180 | Completed | CA | 2 | Induction: VDd (D = liposomal doxorubicin) | t(4;14) |
| ASCT | ||||||
| Consolidation: CV prednisolone | ||||||
| Maintenance: prednisolone | ||||||
| Celgene high-risk multiple myeloma Revlimid induction and maintenance therapy | NCT00691704 | Completed | US | 2 | Induction: Rd | Deletion of chromosome 13 by cytogenetics |
| Del(17p) by FISH or metaphase analysis | ||||||
| FISH detection of t(4;14), t(14;16), t(8;14), or t(14;20) | ||||||
| Hypodiploidy detected by FISH or metaphase analysis | ||||||
| Sequential maintenance: bortezomib, M-prednisolone, lenalidomide | Any complex cytogenetic abnormality detected by cytogenetics, with the exception of hyperdiploidy | |||||
| Vismodegib after stem cell transplant in treating patients with high-risk first remission or relapsed multiple myeloma | NCT01330173 | Completed | US | 1 | Vismodegib (hedgehog inhibitor) after ASCT | Del(13), t(4;14), t(14;16), or del(17p); β2-microglobulin >5.5 g/dL IgA phenotype |
As per a www.clinicaltrials.gov search for “high-risk myeloma” and including studies where the high-risk definition was included.
M, melphalan; V, bortezomib; T, thalidomide; d, dexamethasone; PACE, 4-day continuous infusions of cisplatin, doxorubicin, cyclophosphamide, etoposide; ASCT, autologous stem cell transplant; Mel80, melphalan 20 mg/m2/day × 4 days; R, lenalidomide, Mel20, melphalan 5 mg/m2/day × 4 days; K, carfilzomib; Dara, daratumumab; C, cyclophosphamide; TE, transplant eligible; TNE, transplant ineligible; IULN, institutional upper limit of normal; VAD, vincristine, doxorubicin, dexamethasone; BCMA, B-cell maturation antigen; CAR, chimeric antigen receptor; VGPR, very good partial response.
Other ongoing studies are examining intensification of induction, the use of autologous and allogeneic transplantation approaches, and immunotherapy approaches such as CAR T cells. The first approach is exemplified by the UK MUK9b trial (NCT03188172), the US 2015-12 TT7 trial (NCT03004287), and the German GMMG-CONCEPT trial (NCT03104842), which all combine a CD38 antibody, proteasome inhibitor, and lenalidomide as intensified upfront therapy along with prolonged courses of consolidation and maintenance.
The major difference between each of these studies is the definition of high risk (eg, GEP70 or single or combinations of genetic lesions), which will make subsequent direct comparisons of PFS and OS challenging. However, there is little doubt that concentrating on this subgroup of myeloma will be a rewarding area for both patients and investigators. Given the long PFS and OS for standard-risk patients, trials designed for standard risk require large numbers of patients and long follow-up to demonstrate a statistical and meaningful clinical improvement of the intervention. The high-risk patient is an area of unmet clinical need and is also the ideal situation to demonstrate the clinical activity of a novel agent or novel approach, and as such, it is anticipated that other novel immunotherapy approaches such as CAR T cells, CAR natural killer cells, bispecific antibody therapy, and antibody drug conjugates will move into first-line studies for high-risk myeloma over the coming years.
An alternative approach to altering upfront therapy is to use the prognostic biomarker of MRD postinduction to alter treatment at this time point. Studies addressing questions around intensification of therapy for MRD-positive patients or de-escalating therapy for MRD-negative patients are in development.
Advances in predictive biomarkers
In contrast to prognostic biomarkers, predictive biomarkers forecast the likelihood of a favorable or unfavorable outcome with a specific agent. From mutations alone, it can be estimated that two thirds of patients have potentially actionable lesions with agents currently available or in development.15 Other targetable lesions include primary translocation events and/or protein expression patterns. To date, only a limited number have been studied in clinical trials, and these are discussed below.
Targeted therapeutics using predictive biomarkers currently in clinical trials
Venetoclax
Venetoclax is an inhibitor of the antiapoptotic protein BCL2. In vitro data show a higher sensitivity to venetoclax for cell lines and patient samples with t(11;14). This is likely due to the higher BCL2 to MCL1 expression ratio that correlates with the presence of the translocation.74,75 Two early-phase clinical studies have been published (Table 2). The first studied single-agent venetoclax in multiply relapsed/refractory patients and demonstrated an overall response rate of 40% among t(11;14) patients.76 The study also correlated BCL2:MCL1 and BCL2:BCL2L1 mRNA expression levels with responses and with t(11;14) status. The second study examined venetoclax in combination with bortezomib and dexamethasone. It demonstrated an ORR of 67% in all patients and 78% in t(11;14) patients. Similar to the single-agent study, patients with higher BCL2 expression had deeper responses and longer PFS.77 The high efficacy of the combination in patients without the t(11;14) or high BCL2 expression was speculated to be due to bortezomib upregulating NOXA, a proapoptotic factor that neutralizes MCL1, resulting in an increased BCL2:MCL1 ratio and sensitivity to venetoclax.75
Clinical studies of venetoclax
| Published studies | ||||||||
|---|---|---|---|---|---|---|---|---|
| Phase | Year published | Patient population | Combination | Administration | No. of patients | No. of t(11;14) | ORR in all patients, % | ORR in t(11;14), % |
| 1 | 201776 | Relapsed/refractory | Venetoclax | Intrapatient escalation to maximum 300, 600, 900, and 1200 mg cohorts, expansion of 1200 mg cohort; dexamethasone could be added at progression on venetoclax | 66 | 30 | 21 | 40 |
| 61% bortezomib and lenalidomide double refractory | ||||||||
| 1b | 201777 | Relapsed/refractory | Venetoclax, bortezomib and dexamethasone | Intrapatient escalation to maximum 100, 200, 300, 400, 500, 600, 800, 1000, and 1200 mg venetoclax cohorts, expansion of 800 mg cohort; in combination with bortezomib and dexamethasone | 66 | 9 | 67 | 78 |
| 39% bortezomib refractory | ||||||||
| 53% lenalidomide refractory | ||||||||
| Ongoing studies | |||||
|---|---|---|---|---|---|
| Phase | Location | Patient population | Combination/Administration | NCT | Estimated completion |
| 1b | US, Australia, France | Relapsed after at least 1 prior line of therapy | Venetoclax, bortezomib, and dexamethasone | NCT01794507 | 2018 |
| 1/2 | US, Australia, Canada, Europe | Part 1: t(11;14) relapsed/refractory; part 2: relapsed/refractory | Dose escalation of venetoclax with fixed doses of daratumumab and dexamethasone (+ bortezomib for part 2) | NCT03314181 | 2023 |
| 1/2 | US and Europe | Relapsed after at least 1 prior line of therapy, t(11;14) | Venetoclax ± dexamethasone | NCT01794520 | 2021 |
| 1b/2 | Europe | Relapsed/refractory 3 to 5 prior lines of therapy | Arm A: cobimetinib; arm B: cobimetinib plus venetoclax; arm C: cobimetinib, venetoclax plus atezolizumab | NCT03312530 | 2020 |
| 2 | US | Relapsed/refractory 1 to 3 prior lines of therapy | Venetoclax, carfilzomib, and dexamethasone | NCT02899052 | 2020 |
| 2 | US, Europe | Relapsed after at least 1 prior line of therapy, cohorts for t(11;14) positive and negative | Venetoclax, pomalidomide, and dexamethasone | NCT03567616 | 2020 |
| 3 | Worldwide | Considered sensitive or naive to proteasome inhibitors and received 1 to 3 prior lines of therapy | Venetoclax/placebo + bortezomib and dexmathasone | NCT02755597 | 2020 |
| 3 | Worldwide | t(11;14) Relapsed/refractory | Venetoclax and dexamethasone vs pomalidomide and dexamethasone | NCT03539744 | 2022 |
As per www.clinicaltrials.gov and PubMed searches for “myeloma” and “venetoclax”.
ORR, overall response rate.
These findings suggest that moving forward venetoclax may not be limited to the t(11;14) subgroup when used in combination with a proteasome inhibitor and an assay measuring BCL2:MCL1 or BCL2:BCL2L1 mRNA expression ratios may be beneficial as a predictive biomarker. This biomarker-driven strategy can be clearly seen with the trial combinations being examined in ongoing studies (Table 2), where those with proteasome inhibitor combinations are open to all comers, whereas single-agent studies are restricted to t(11;14) patients.
RAS pathway inhibitors
Sequencing studies have identified mutations in RAS pathway genes in ∼50% of patients (25% NRAS, 25% KRAS, and 4% BRAF), leading to the evaluation of RAS pathway inhibitors. These include BRAF inhibitors (eg, vemurafenib and dabrafenib), and MEK inhibitors (eg, trametinib and cobimetinib). The published experience to date is mostly limited to case reports and case series (Table 3) and provides encouraging evidence of activity in relapsed/refractory patients (eg, with responses seen in 16/40 patients with measurable disease,78 although therapy in this study was often in combination). Several prospective studies are now underway and should provide a more comprehensive analysis of efficacy (Table 3).
Clinical studies of RAS-pathway–targeted therapies
| Retrospective cohorts and case reports | |||||
|---|---|---|---|---|---|
| Type | Year published | Patient population | Combination/administration | No. of patients | ORR |
| Retrospective | 201678 | Oncogenic mutations of NRAS, KRAS, or BRAF or GEP pathway activation in relapsed/refractory patients | Trametinib (single agent or in combination with other agents) | 58 (40 with measurable disease at time of commencing trametinib) | 16/40 (40%) |
| Case report | 201784 | Relapsed/refractory patient with extramedullary disease and BRAF V600E mutation | Vemurafenib and cobimetinib | 1 | Patient responded |
| Case report | 201485 | Relapsed/refractory patient with extramedullary disease and BRAF V600E mutation | Vemurafenib | 1 | Patient progressed through treatment |
| Case report | 201486 | Relapsed/refractory patients with BRAF V600E mutations | Vemurafenib | 2 | Both patients responded |
| Case report | 201387 | Relapsed/refractory patient with extramedullary disease and BRAF V600E mutation | Vemurafenib | 1 | Patient responded |
| Ongoing studies | |||||
|---|---|---|---|---|---|
| Phase | Location | Patient population | Combination/administration | NCT | Estimated completion |
| 1 | UK | Relapsed/refractory | RO5126766 twice weekly or Monday/Wednesday/Friday dosing schedule | NCT02407509 | 2016 (but ongoing) |
| BRAF, NRAS, or KRAS mutated | |||||
| 1 | US | Relapsed/refractory | Cohort 1: BRAF V600 mutated: dabrafenib; cohort 2 BRAF mutated or BRAF and KRAS/NRAS mutated: trametinib; cohort 3: KRAS or NRAS mutated: trametinib | NCT03091257 | 2021 |
| BRAF, NRAS, or KRAS mutated | |||||
| 2 | Canada | Relapsed/refractory BRAF, NRAS, or KRAS mutated | Trametinib initially with the AKT inhibitor GSK2141795 added at progression | NCT01989598 | 2018 |
| Cohorts of biomarker-positive and negative patients | |||||
| 2 | Germany | Relapsed/refractory | Encorafenib and binimetinib combination | NCT02834364 | 2021 |
| BRAF V600E/K mutated | |||||
| 1b/2 | Europe | Relapsed/refractory | Arm A: cobimetinib; arm B: cobimetinib and venetoclax; arm C: cobimetinib, venetoclax, and atezolizumab | NCT03312530 | 2020 |
| 3 to 5 prior lines of therapy | |||||
| Umbrella/basket studies | |||||
|---|---|---|---|---|---|
| Phase | Location | Patient population | Combination/administration | NCT | Estimated completion |
| 2 | US | MATCH study: multiple diseases and multiple treatments | Guided by molecular characterization, including BRAF, RAS, PIKC3A mutations, CCND1, CDK4, CDK6 amplification | NCT02465060 | 2022 |
| 2 | US | TAPUR study: multiple diseases and multiple treatments | Guided by genomic variant identification, including BRAF, KRAS, NRAS | NCT02693535 | 2019 |
| 2 | Canada | CAPTUR study: multiple diseases and multiple treatments | Guided by genomic variant identification, including BRAF | NCT03297606 | 2021 |
As per www.clinicaltrials.gov and PubMed searches for “myeloma” and the following terms: “vemurafenib,” “dabrafenib,” “trametinib,” “cobimetinib,” “RAS,” “BRAF,” and “MEK.”
Therapies in development
Further targets have been identified that may predict response to therapeutic agents, although these are at earlier stages of development. Examples include IDH1/IDH2 mutations and IDH inhibitors,79,80 loss of heterozygosity or ATM/ATR mutations and PARP inhibitors,46 and FGFR3 mutations and FGFR3 inhibitors.81 Several are being studied in large umbrella studies such as the Multiple Myeloma Research Foundation MyDRUG study and the Canadian “CAPTUR” study. These incorporate agents targeted to a large number of molecular drivers with a solid preclinical rationale, often repurposed from other diseases. Ongoing analysis is identifying further targets that can be incorporated into such studies. For example, fusion genes have been identified in myeloma, and although rare (1%),50,82 the majority contain a kinase domain, suggesting kinase inhibitors may have a potential role.
Recent solid tumor studies have shown that patients with a high mutation burden respond exceptionally well to PD1/PDL1 inhibitors. Generally, the mutation burden is lower in myeloma than in solid tumors, but a percentage of cases with a t(14;16) MAF translocation have an APOBEC signature and high mutational burden, providing a biological rationale to explore checkpoint inhibitors in this small group.
Limitations of targeted therapeutic approach
An important caveat of targeted agents used on the basis of predictive biomarkers is the presence of clonal heterogeneity, as when this is present not all cells contain the target lesion. Biopsy specimens from distinct sites of disease within the same patient at one time point, or from the same site at different time points, have been shown to be molecularly diverse.83 These findings suggest that initiating events, present in 100% of clonal cells, may make good predictive biomarkers, whereas secondary, usually subclonal events would need to be in a high percentage of cells to be clinically useful. However, it could be hypothesized that where the targeted lesion is also of some prognostic importance, targeted therapy may still be clinically beneficial; for example, eliminating a high-risk clone and allowing a standard-risk clone to predominate may prove an effective therapeutic strategy, especially if the standard-risk clone can be eliminated with a standard therapy given in combination. Using this logic, the best predictive lesions to target (but for which targeted agents unfortunately do not yet exist) are those that are present in a high proportion of clonal cells and are associated with adverse outcomes. For instance targeting MMSET, the oncogenic driver in t(4;14), fulfills both these criteria but has proved difficult for drug design to date. Other options include MAF targeted approaches and the identification and targeting of lesions associated with gain(1q), amp(1q), or del(17p).
Another limitation of mutation targeted therapy is the lack of integration of RNA- and protein-level data into the decision-making process. Since drugs mostly act on proteins, the effect of mutations at the protein level is important. For example, mutations in recurrent sites known to cause pathway activation may be acted upon clinically, but variants of as-yet-unknown significance should be treated with caution. As more integrative molecular models become available, this potential limitation may be overcome.
Finally, targeting individual lesions that occur in low frequencies in patient populations poses a logistical problem for clinical trial design and requires novel trial approaches. For instance, for t(11;14) and RAS pathway mutations (present in 15% and 50% of patients, respectively), it is still possible to run lesion-specific trials. In contrast, attempting to target lesions such as IDH mutations (present in <2% of patients) will require multicenter and potentially multidisease collaborations. Such concepts are employed in umbrella studies (Figure 3C) or Basket studies (Figure 3D) where patients with different tumors are enrolled in the same protocol based on a molecular lesion identified. In addition, given the scarcity of some lesions in specific disease, there is an argument that more single-patient experiences also warrant publication.
Conclusions
The improvement in survival for myeloma patients over the last decade has mainly benefited low-risk patients, and now that median PFS for this group of patients is in excess of 8 years, a new approach to improving outcomes is required. Current approaches to personalize myeloma therapy take into account age and comorbidities but rarely consider molecular information. However, as the information concerning genetic analysis has become stronger, it can be postulated that one way to quickly improve outcomes further would be to incorporate such information into clinical algorithms. We have described 2 possible approaches by which this might be achieved. The first targets a cohort of patients with high-risk markers using intensified therapeutic approaches agnostic to molecular lesions. Such approaches include combinations of quadruplet or even quintuplet regimens and/or novel immunotherapy approaches such as bispecific antibodies, antibody–drug conjugates, and CAR T cells. This approach has the benefit of targeting patients with the worst outcomes and highest unmet clinical need. The challenge, however, is the lack of understanding about whether this is best achieved by incorporating ever-increasing numbers of additional agents or novel immunotherapy agents or whether the focus should be on designing more optimal treatment delivery approaches, such as different schedules and sequencing approaches using currently available agents.
The alternative strategy is to aim to use molecularly targeted agents that target lesions specific to an individual patient’s disease and therefore have a higher likelihood of efficacy while avoiding unnecessary toxicity. The knowledge of the molecular basis of myeloma is ever expanding, and so we can use this to define rationale drug targets as well as to use drugs already available for known targets. With respect to such predictive biomarkers, utilizing therapies targeted to either initiating lesions or lesions with a high cancer clonal fraction seem most likely to be effective. In addition, it seems likely that molecularly targeted agents will not be used alone; instead, these agents will be combined in specific subsets of disease with other agents that target more general plasma cell biological functions, such as proteasome inhibitors, immunomodulatory drugs, and monoclonal antibodies.
In closing, it is important to note that work to date concerning prognostic and predictive biomarkers has concentrated on genetic lesions within the plasma cell. Advances in protein technologies are occurring rapidly with the advent of tabletop analyzers,11 mass spectrometry,12 next-generation flow cytometry, mass cytometry, and whole-proteome analysis. These technologies will allow the study the myeloma proteome as well as components of the bone marrow microenvironment and immune environment. With the increasing use of immune therapies, it seems likely that biomarkers related to these areas will be identified and will need to be incorporated into current models and treatment decisions.
Acknowledgments
The authors acknowledge that many investigators have contributed to this field over the years and apologize if, due to a lack of space, any colleague’s work has not been mentioned.
C.P. is a National Institute for Health Research Clinical Lecturer.
Authorship
Contribution: C.P. and F.E.D. wrote the manuscript.
Conflict-of-interest disclosure: C.P. received consultancy and travel support fees from Amgen and Takeda Oncology; honoraria and travel support from Janssen; and consultancy, honoraria, and travel support from Celgene Corporation. F.E.D. received consultancy and honoraria from Amgen, AbbVie, Takeda, and Janssen and consultancy, honoraria, and research support from Celgene Corporation.
Correspondence: Faith E. Davies, Myeloma Center, University of Arkansas for Medical Sciences, 4301 W Markham St, Slot 816, Little Rock, AR 72205; e-mail: fedavies@uams.edu.

This feature is available to Subscribers Only
Sign In or Create an Account Close Modal