

Key Points
Phf6 deficiency augments HSC self-renewal and confers resistance against the TNFα-mediated growth inhibition on HSCs.
Phf6 deficiency alone is not sufficient to induce hematopoietic transformation.

Abstract
Recurrent inactivating mutations have been identified in the X-linked plant homeodomain finger protein 6 (PHF6) gene, encoding a chromatin-binding transcriptional regulator protein, in various hematological malignancies. However, the role of PHF6 in normal hematopoiesis and its tumor-suppressor function remain largely unknown. We herein generated mice carrying a floxed Phf6 allele and inactivated Phf6 in hematopoietic cells at various developmental stages. The Phf6 deletion in embryos augmented the capacity of hematopoietic stem cells (HSCs) to proliferate in cultures and reconstitute hematopoiesis in recipient mice. The Phf6 deletion in neonates and adults revealed that cycling HSCs readily acquired an advantage in competitive repopulation upon the Phf6 deletion, whereas dormant HSCs only did so after serial transplantations. Phf6-deficient HSCs maintained an enhanced repopulating capacity during serial transplantations; however, they did not induce any hematological malignancies. Mechanistically, Phf6 directly and indirectly activated downstream effectors in tumor necrosis factor α (TNFα) signaling. The Phf6 deletion repressed the expression of a set of genes associated with TNFα signaling, thereby conferring resistance against the TNFα-mediated growth inhibition on HSCs. Collectively, these results not only define Phf6 as a novel negative regulator of HSC self-renewal, implicating inactivating PHF6 mutations in the pathogenesis of hematological malignancies, but also indicate that a Phf6 deficiency alone is not sufficient to induce hematopoietic transformation.
Introduction
Recent advances have clearly demonstrated the significance of transcriptional regulation by chromatin modifiers in normal hematopoiesis and leukemogenesis. Genomic studies on patients with hematological malignancies have provided insights into a series of mutations in genes considered to be involved in epigenetic gene regulation. These mutations occur in genes known, or suspected, to play a role in modifying the chromatin structure.1-4 However, it currently remains unclear how many of these genes regulate hematopoiesis under normal conditions and also how mutations in these genes contribute to leukemic transformation and/or progression. This is mainly attributed to the lack of suitable mouse models to evaluate the role of genes in normal hematopoiesis. Knockout mouse models have shown that the loss of Tet2 or Dnmt3a, inactivating mutations that function as driver mutations in human hematological malignancies, confers a growth advantage on hematopoietic stem/progenitor cells,5-7 thereby contributing to clonal hematopoiesis.
The plant homeodomain (PHD) finger protein 6 (PHF6) gene, located on the X chromosome, encodes a chromatin-binding protein with 2 atypical PHD-like zinc finger domains (aPHDs) that has been implicated in transcriptional regulation.8 Germline mutations in PHF6 were initially identified in patients with Börjeson-Forssman-Lehmann syndrome, which is characterized by X-linked mental retardation of varying severities,9 whereas somatic-inactivating mutations frequently occur in patients with T-cell acute lymphoblastic leukemia (T-ALL) and, to a lesser extent, in acute myeloid leukemia (AML), secondary AML, and myelodysplastic syndrome.10-12 Genome-scale short hairpin RNA (shRNA) screening revealed that the inhibition of PHF6 expression had a negative impact on the growth of B-cell acute lymphoblastic leukemia (B-ALL) cells, but that it enhanced the tumor progression of AML.13 These findings indicate that PHF6 has oncogenic and tumor-suppressive functions in a context-dependent manner.
PHF6 binds to double-stranded DNA in vitro through its aPHD domain and to histone H3 in the absence of DNA. PHF6 has been reported to bind to a subunit of the nucleosome remodeling and deacetylase (NURD) chromatin-remodeling complex,14 a component of the transcriptional elongation complex polymerase-associated factor 1 (PAF1),15 and the transcriptional activator for ribosomal RNA, upstream binding factor 1 (UBF1).16 Furthermore, integrated genomics revealed that PHF6 binds to nucleosomes surrounding the transcription start site (TSS) of lineage-specific genes and that it modulates the binding of lineage-specific transcription factors.17 For example, PHF6 binds to the ±1 nucleosome flanking the TSSs of B-cell–specific genes and allows B-cell–specific transcription factors to bind and activate genes in B-ALL cell lines. In contrast, PHF6 binds nucleosomes surrounding the TSSs of T-cell–specific genes and promotes chromatin compaction, thereby restricting the binding of T-cell–specific transcription factors. Thus, these findings provide a model for explaining why the deletion of PHF6 leads to the downregulation of B-cell–specific genes and ectopic activation of the T-cell program in B-ALL cell lines.17
To date, despite frequent inactivating mutations in leukemia, limited information is currently available on the role of PHF6 in the hematopoietic system and the characterization of Phf6 knockout mice has not yet been reported. We generated a mouse line carrying a floxed Phf6 allele and investigated the role of Phf6 in mouse hematopoietic stem cells (HSCs). We herein demonstrated that Phf6 negatively regulates HSC self-renewal, partly through the activation of genes in tumor necrosis factor α (TNFα) signaling.
Materials and methods
Regarding the conditional deletion of Phf6, Phf6fl/wt mice were crossed with Vav1-Cre (The Jackson Laboratory), Rosa::Cre-ERT mice (TaconicArtemis GmbH), or Mx1-Cre (The Jackson Laboratory). To induce Cre-ERT activity, mice were injected with 100 μL of tamoxifen dissolved in corn oil at a concentration of 10 mg/mL intraperitoneally for 5 consecutive days. All conditional Phf6 knockout mice were maintained on a B6-CD45.2 (Japan SLC) genetic background. Polyriboinosinic acid/polyribocytidylic acid (pIpC; InvivoGen) was dissolved in phosphate-buffered saline at a concentration of 4 mg/mL and annealed according to the manufacturer’s instructions. To activate the Mx1-Cre transgene, adult mice were injected with 400 μg of pIpC 3 times every second day, whereas 3-week-old mice were injected with 160 μg of pIpC once. C57BL/6 mice congenic for the Ly5 locus (B6-CD45.1) were purchased from Sankyo-Laboratory Service (Tsukuba, Japan). Mice were bred and maintained in the Animal Research Facility of the Graduate School of Medicine, Chiba University in accordance with institutional guidelines (approval ID: 29-289).
Results
Generation of mice carrying the Phf6fl allele and Phf6 deletion in hematopoietic cells
To elucidate the biological role of Phf6, we generated mice harboring a Phf6fl mutation in which exons 4 and 5 encoding the second aPHD were floxed (Figure 1A), and then crossed Phf6fl/w mice with Vav1-iCre mice that express Cre specifically in hematopoietic cells (Vav1-iCre;Phf6fl/y) from the fetal stage. We confirmed the efficient deletion of Phf6 in CD150+CD34− lineage marker–negative (Lin−) Sca-1+c-Kit+ (CD150+CD34−LSK) HSCs using quantitative polymerase chain reaction (qPCR) and the western blotting of splenocytes and thymocytes (Figure 1B-C). We hereafter refer to Vav1-iCre;Phf6wt/y and Vav1-iCre;Phf6fl/y mice as VC and VC;Phf6Δ/y mice, respectively. We focused on male mice in the present study because PHF6 mutations are exclusively found in male patients with AML and T-ALL.10,11 VC;Phf6Δ/y mice were born, grew healthily, and did not exhibit any obvious growth retardation or hypoplasia in their hematopoietic organs at 12 weeks of age (Figure 1D). VC;Phf6Δ/y mice had slightly higher white blood cell (WBC) counts than those of the control, which was mainly attributed to increased B lymphopoiesis, whereas they had similar red blood cell counts, hemoglobin levels, and platelet counts (Figure 2A-B). Flow cytometric analyses showed no significant differences in the numbers of long-term HSCs (LT-HSCs), CD34−LSK HSCs, common myeloid progenitors (CMPs), granulocyte-macrophage progenitors (GMPs), megakaryocyte-erythrocyte progenitors (MEPs), and common lymphoid progenitors (CLPs) between VC and VC;Phf6Δ/y (Figure 2C; supplemental Figure 1A-C, available on the Blood Web site). A cell-cycle analysis using Ki67 expression as a marker for cell proliferation revealed that a significantly higher proportion of VC;Phf6Δ/y CD34−LSK HSCs was actively cycling than control cells (Figure 2D). Because the exit of HSCs from the dormant state is often associated with HSC exhaustion, we examined the repopulating capacity of VC;Phf6Δ/y HSCs. We transplanted bone marrow (BM) cells from VC or VC;Phf6Δ/y CD45.2 male mice together with CD45.1 competitor cells into lethally irradiated CD45.1 recipient mice. The chimerism of VC;Phf6Δ/y cells in peripheral blood (PB) CD45+ cells was greater than that of the control in primary (1°) recipients and increased further in secondary (2°) and tertiary (3°) recipients over time (Figure 2E). A lineage distribution analysis 16 weeks after 1°, 2°, and 3° transplantation showed that VC;Phf6Δ/y contributed to all 3 hematopoietic lineages more efficiently than VC cells (Figure 2F). The increased chimerism of VC;Phf6Δ/y cells was also evident in the HSC fractions (LT-HSCs and CD34−LSK HSCs) and lineage-committed progenitor fractions (GMP and CLP) in 1°, 2°, and 3° recipients (Figure 2G), indicating that the repopulation capacity of VC;Phf6Δ/y HSCs was enhanced. Of note, VC;Phf6Δ/y HSCs maintained higher chimerism and retained a multilineage differentiation capacity even in 3° transplantation (Figure 2E-G), and did not induce any hematological malignancies (data not shown). We also noted that VC;Phf6Δ/y HSCs showed better growth than VC HSCs under HSC culture conditions supplemented with stem cell factor (SCF) and thrombopoietin (TPO). The growth advantage of VC;Phf6Δ/y HSCs was completely canceled by retrovirally expressed Phf6 (Figure 2H). These results support a role for Phf6 in the regulation of proliferation. In contrast, the replating capacity of VC;Phf6Δ/y LSK hematopoietic stem and progenitor cells under myeloid culture conditions supplemented with SCF, TPO, interleukin-3, and granulocyte macrophage–colony-stimulating factor was similar to that of VC (supplemental Figure 1D).
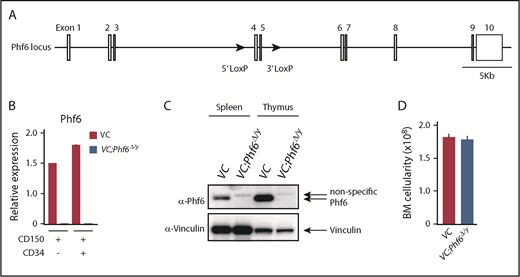
Targeting of the Phf6 gene in the hematopoietic system. (A) Gene-targeting strategy for the Phf6 gene. (B) RT-qPCR analysis of Phf6 in CD150+CD34−LSK HSCs and CD150+CD34+LSK multipotent progenitors. Hprt1 was used to normalize the amount of input RNA. Data are shown as the mean plus or minus standard error of the mean (SEM) (n = 3). The significance of differences relative to WT is shown. *P < .05, **P < .01, ***P < .001 by the Student t test. (C) Western blot analysis of the spleen and thymus. Vinculin was used as a loading control. (D) Total BM cell numbers of the bilateral pairs of femurs and tibiae at 12 weeks of age.
Targeting of the Phf6 gene in the hematopoietic system. (A) Gene-targeting strategy for the Phf6 gene. (B) RT-qPCR analysis of Phf6 in CD150+CD34−LSK HSCs and CD150+CD34+LSK multipotent progenitors. Hprt1 was used to normalize the amount of input RNA. Data are shown as the mean plus or minus standard error of the mean (SEM) (n = 3). The significance of differences relative to WT is shown. *P < .05, **P < .01, ***P < .001 by the Student t test. (C) Western blot analysis of the spleen and thymus. Vinculin was used as a loading control. (D) Total BM cell numbers of the bilateral pairs of femurs and tibiae at 12 weeks of age.
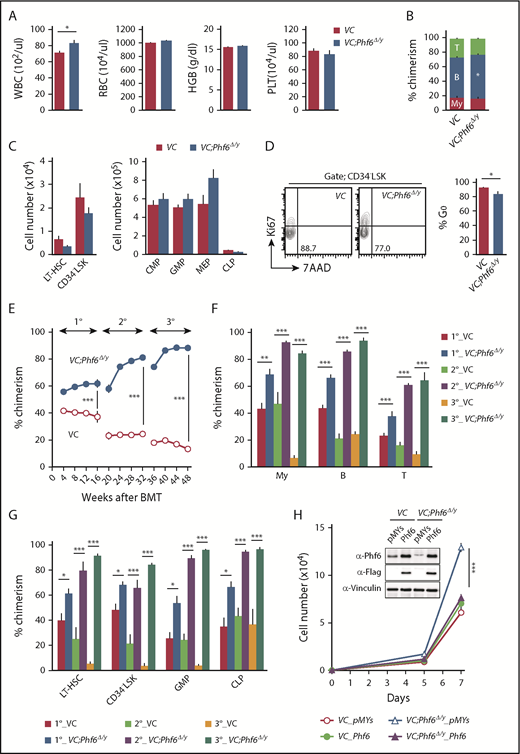
Phf6 deletion at the fetal stage enhances the repopulating capacity of adult HSCs. (A) PB cell counts in VC and VC;Phf6Δ/y mice. WBC, red blood cell (RBC), and platelet (PLT) counts and hemoglobin (HGB) levels in PB from VC (n = 6) and VC;Phf6Δ/y mice (n = 8) at 12 weeks of age. (B) The proportions of myeloid (My) (Mac-1+ and/or Gr-1+), B220+ B cells, and CD4+ or CD8+ T cells among CD45.2+ cells in PB from VC (n = 6) and VC;Phf6Δ/y (n = 8) mice at 12 weeks of age. (C) Absolute numbers of CD150+CD34−LSK LT-HSCs, CD34−LSK HSCs, myeloid progenitors (CMP, GMP, and MEP), and CLPs in a pool of femurs and tibias from VC (n = 5) and VC;Phf6Δ/y mice (n = 5) at 12 weeks of age. (D) Cell-cycle status of CD34−LSK HSCs identified by Ki67 and 7-aminoactinomycin D (7-AAD) staining at 12 weeks of age. Representative flow cytometric profiles (left panel). The proportion of G0 (Ki67−) cells in CD34−LSK HSCs is shown as the mean plus or minus SEM (n = 6 or 7) (right panel). (E) Competitive repopulating assays. A total of 5 × 10⁶ BM cells from VC and VC;Phf6Δ/y mice (donor, CD45.2) mixed with the same number of BM cells (competitor, CD45.1) were transplanted into lethally irradiated CD45.1 congenic recipients. In serial transplantations, the same numbers of BM cells from all recipients were pooled and 2 × 10⁶ BM cells were then injected into lethally irradiated CD45.1 congenic recipients. The chimerism of donor-derived CD45.2+ cells in the PB of primary (1°), secondary (2°), and tertiary (3°) recipients are shown as the mean plus or minus SEM (n = 5 or 6). (F) The chimerism of My, B-, and T-cell lineages in PB 16, 32, and 48 weeks after 1° transplantation are shown as the mean plus or minus SEM (n = 5 or 6). (G) The chimerism of LT-HSCs, CD34−LSK, GMPs, and CLPs 16, 32, and 48 weeks after 1° transplantation are shown as the mean plus or minus SEM (n = 5 or 6). (H) Growth of VC and VC;Phf6Δ/y CD150+CD34−LSK HSCs in vitro. Freshly sorted HSCs were transduced with a control retrovirus (pMYs) or retrovirus expressing Phf6 (Phf6). After GFP sorting, GFP+ cells were cultured under HSC culture conditions (SCF+TPO) for 7 days. Data are shown as the mean plus or minus SEM of triplicate cultures. Insets, Western blot data of cells in culture on day 7. *P < .05, **P < .01, ***P < .001 by the Student t test. BMT, BM transplantation.
Phf6 deletion at the fetal stage enhances the repopulating capacity of adult HSCs. (A) PB cell counts in VC and VC;Phf6Δ/y mice. WBC, red blood cell (RBC), and platelet (PLT) counts and hemoglobin (HGB) levels in PB from VC (n = 6) and VC;Phf6Δ/y mice (n = 8) at 12 weeks of age. (B) The proportions of myeloid (My) (Mac-1+ and/or Gr-1+), B220+ B cells, and CD4+ or CD8+ T cells among CD45.2+ cells in PB from VC (n = 6) and VC;Phf6Δ/y (n = 8) mice at 12 weeks of age. (C) Absolute numbers of CD150+CD34−LSK LT-HSCs, CD34−LSK HSCs, myeloid progenitors (CMP, GMP, and MEP), and CLPs in a pool of femurs and tibias from VC (n = 5) and VC;Phf6Δ/y mice (n = 5) at 12 weeks of age. (D) Cell-cycle status of CD34−LSK HSCs identified by Ki67 and 7-aminoactinomycin D (7-AAD) staining at 12 weeks of age. Representative flow cytometric profiles (left panel). The proportion of G0 (Ki67−) cells in CD34−LSK HSCs is shown as the mean plus or minus SEM (n = 6 or 7) (right panel). (E) Competitive repopulating assays. A total of 5 × 10⁶ BM cells from VC and VC;Phf6Δ/y mice (donor, CD45.2) mixed with the same number of BM cells (competitor, CD45.1) were transplanted into lethally irradiated CD45.1 congenic recipients. In serial transplantations, the same numbers of BM cells from all recipients were pooled and 2 × 10⁶ BM cells were then injected into lethally irradiated CD45.1 congenic recipients. The chimerism of donor-derived CD45.2+ cells in the PB of primary (1°), secondary (2°), and tertiary (3°) recipients are shown as the mean plus or minus SEM (n = 5 or 6). (F) The chimerism of My, B-, and T-cell lineages in PB 16, 32, and 48 weeks after 1° transplantation are shown as the mean plus or minus SEM (n = 5 or 6). (G) The chimerism of LT-HSCs, CD34−LSK, GMPs, and CLPs 16, 32, and 48 weeks after 1° transplantation are shown as the mean plus or minus SEM (n = 5 or 6). (H) Growth of VC and VC;Phf6Δ/y CD150+CD34−LSK HSCs in vitro. Freshly sorted HSCs were transduced with a control retrovirus (pMYs) or retrovirus expressing Phf6 (Phf6). After GFP sorting, GFP+ cells were cultured under HSC culture conditions (SCF+TPO) for 7 days. Data are shown as the mean plus or minus SEM of triplicate cultures. Insets, Western blot data of cells in culture on day 7. *P < .05, **P < .01, ***P < .001 by the Student t test. BMT, BM transplantation.
Phf6 deletion in neonatal and adult hematopoietic cells
To examine the effects of the Phf6 deletion in neonatal and adult hematopoietic cells, we generated Mx1-Cre;Phf6fl/y mice, in which Mx1 promoter-driven Cre expression was induced by injecting pIpC. Mx1-Cre;Phf6wt/y and Mx1-Cre;Phf6fl/y mice were injected with pIpC at 2 weeks (neonatal stage) or 9 weeks (adult stage) of age, and BM cells were then harvested for competitive transplantation 3 weeks later (Figure 3A). Regardless of the stage of the pIpC injection, genomic qPCR revealed no marked difference in the efficiency of the Phf6 deletion (pIpC treatment at 2 weeks of age [80.0%] and 9 weeks of age [76.4%]). We hereafter refer to pIpC-treated Mx1-Cre;Phf6wt/y and Mx1-Cre;Phf6fl/y mice as MC and MC;Phf6Δ/y mice, respectively. The transplantation of MC;Phf6Δ/y BM cells in which Phf6 had been deleted for 3 weeks from the neonatal stage gave rise to markedly higher chimerism in all fractions tested than MC, whereas the deletion of Phf6 in the adult stage had a minimal effect and moderately increased chimerism only in myeloid cells and lineage-committed progenitors (GMPs and CLPs), and not in the HSC fractions (Figure 3B-C). The administration of pIpC is known to trigger HSC cycling, which leads to HSC exhaustion in a similar manner to proinflammatory cytokines, such as interferons.18-20 We found that the chimerism of MC cells, which were administrated with pIpC at 2 weeks of age, was reproducibly lower than that of MC cells treated with pIpC at 9 weeks of age (Figure 3B-C), indicating that neonatal HSCs, but not adult HSCs, are susceptible to proinflammatory cytokines. Therefore, it is important to note that VC;Phf6Δ/y neonatal HSCs established higher chimerism than that of MC neonatal HSCs, indicating that VC;Phf6Δ/y HSCs are more resistant to proinflammatory cytokines. These results together with those obtained from VC;Phf6Δ/y HSCs indicate that the Phf6 deletion potentiated the repopulating capacity of HSCs more when deleted in embryos or neonates than in adults.
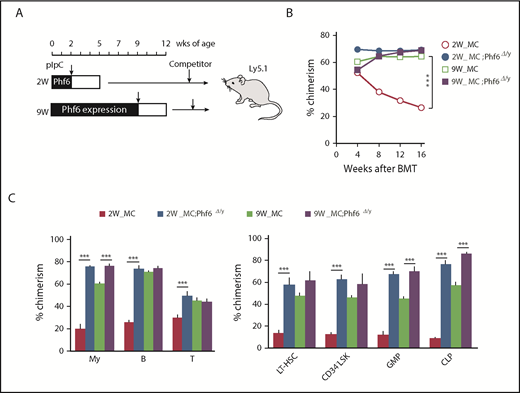
Cycling HSCs are sensitive to the loss of Phf6. (A) Strategy for competitive repopulating assays using the Mx1-Cre system. Mx1-Cre;Phf6wt/y and Mx1-Cre;Phf6fl/y mice were injected with pIpC at 2 or 9 weeks of age and BM cells were harvested for competitive transplantation at 5 or 12 weeks of age, respectively. CD45.2 BM cells (5 × 10⁶) were transplanted into lethally irradiated CD45.1 recipient mice along with the same number of CD45.1 WT BM cells. (B) The chimerism of CD45.2 donor cells in PB after transplantation (n = 5 or 6). (C) The chimerism of My, B-, and T-cell lineages in PB and those of HSCs and progenitors 16 weeks after transplantation are shown (n = 5 or 6). Data are shown as the mean plus or minus SEM. *P < .05, **P < .01, ***P < .001 by the Student t test.
Cycling HSCs are sensitive to the loss of Phf6. (A) Strategy for competitive repopulating assays using the Mx1-Cre system. Mx1-Cre;Phf6wt/y and Mx1-Cre;Phf6fl/y mice were injected with pIpC at 2 or 9 weeks of age and BM cells were harvested for competitive transplantation at 5 or 12 weeks of age, respectively. CD45.2 BM cells (5 × 10⁶) were transplanted into lethally irradiated CD45.1 recipient mice along with the same number of CD45.1 WT BM cells. (B) The chimerism of CD45.2 donor cells in PB after transplantation (n = 5 or 6). (C) The chimerism of My, B-, and T-cell lineages in PB and those of HSCs and progenitors 16 weeks after transplantation are shown (n = 5 or 6). Data are shown as the mean plus or minus SEM. *P < .05, **P < .01, ***P < .001 by the Student t test.
Effects of the Phf6 deletion on steady-state hematopoiesis
To test the effects of the Phf6 deletion on steady-state hematopoiesis, we generated CreERT;Phf6fl/y mice in which Cre was activated by injecting tamoxifen. We transplanted whole BM cells from CreERT;Phf6wt/y and CreERT;Phf6fl/y with CD45.1 competitor cells into lethally irradiated CD45.1 recipient mice. After confirming engraftment, we deleted Phf6 by intraperitoneal injections of tamoxifen 4 weeks after transplantation (Figure 4A). The efficient deletion of Phf6 was confirmed by genomic PCR on peripheral WBC and the western blotting of peripheral B cells (supplemental Figure 2A-B). We hereafter refer to tamoxifen-treated CreERT;Phf6wt/y and CreERT;Phf6fl/y mice as CE and CE;Phf6Δ/y mice, respectively. The tamoxifen injection to recipient mice did not increase the chimerism of CE;Phf6Δ/y cells in PB (Figure 4B-C). In contrast, CE;Phf6Δ/y cells outcompeted CD45.1+ competitor cells in all 3 hematopoietic lineages of PB in 2° recipients (Figure 4B-C). The chimerism of CE;Phf6Δ/y cells also increased in HSCs and progenitor cells in 2° recipients (Figure 4C). These results were in marked contrast to neonatal HSCs, which acquired a competitive advantage immediately after the deletion of Phf6 (Figure 3), and indicate that adult HSCs require long periods of time or hematopoietic stress, such as transplantation, which activates dormant HSCs, to exert an obvious competitive advantage. It is also important to note that 2° recipients reconstituted with CE;Phf6Δ/y cells had mild splenomegaly and increased numbers of LSK cells in the spleen (Figure 4D-F), indicating that VC;Phf6Δ/y HSCs established more active extramedullary hematopoiesis than the control. Consistent with these results, the Phf6 deletion did not have any significant impact on the proliferation of HSCs in cultures immediately after the deletion (Figure 4G).
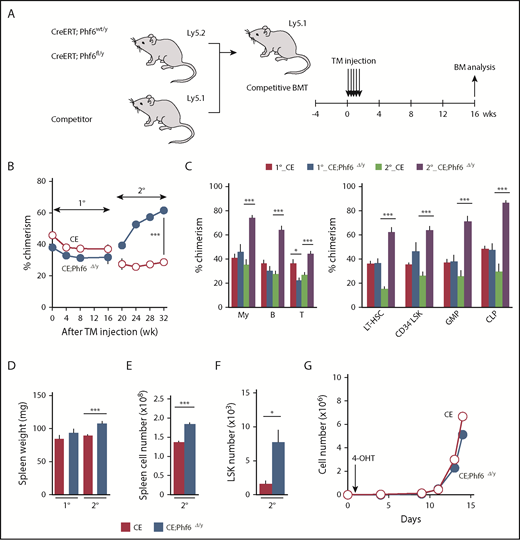
Deletion of Phf6 in steady-state hematopoiesis. (A) Competitive reconstitution assays using the CreERT system. BM cells from 8-week-old CreERT and CreERT;Phf6fl/y mice were transplanted into lethally irradiated recipient mice with the same number of competitor BM cells (5 × 10⁶ cells). Four weeks after transplantation, recipient mice were injected with tamoxifen (TM) for 5 consecutive days. Serial transplantations were performed as described in Figure 2E. PB analyses were performed every 4 weeks and a BM analysis was performed 16 weeks after the tamoxifen injection. (B) The chimerism of CD45.2+ donor-derived cells in the PB of recipient mice is shown (n = 5 or 6). (C) The chimerism of My, B-, and T-cell lineages in PB and those of HSCs and progenitors at 16 and 32 weeks after 1° transplantation are shown (n = 5 or 6). (D-F) Spleen weight (D), spleen cell number (E), and the number of LSK cells in the spleen (F) 16 and 32 weeks after 1° transplantation are shown (n = 5). (G) Growth of CE and CE;Phf6Δ/y CD150+CD34−LSK HSCs in vitro. Freshly sorted HSCs were cultured under HSC culture conditions (SCF+TPO) for 14 days (n = 3). During the culture, cells were treated with 200 nM 4-hydroxytamoxifen (4-OHT) for 16 hours from 24 hours after cell sorting to induce the CreERT-mediated excision of Phf6. Data are shown as the mean plus or minus SEM. *P < .05, **P < .01, ***P < .001 by the Student t test.
Deletion of Phf6 in steady-state hematopoiesis. (A) Competitive reconstitution assays using the CreERT system. BM cells from 8-week-old CreERT and CreERT;Phf6fl/y mice were transplanted into lethally irradiated recipient mice with the same number of competitor BM cells (5 × 10⁶ cells). Four weeks after transplantation, recipient mice were injected with tamoxifen (TM) for 5 consecutive days. Serial transplantations were performed as described in Figure 2E. PB analyses were performed every 4 weeks and a BM analysis was performed 16 weeks after the tamoxifen injection. (B) The chimerism of CD45.2+ donor-derived cells in the PB of recipient mice is shown (n = 5 or 6). (C) The chimerism of My, B-, and T-cell lineages in PB and those of HSCs and progenitors at 16 and 32 weeks after 1° transplantation are shown (n = 5 or 6). (D-F) Spleen weight (D), spleen cell number (E), and the number of LSK cells in the spleen (F) 16 and 32 weeks after 1° transplantation are shown (n = 5). (G) Growth of CE and CE;Phf6Δ/y CD150+CD34−LSK HSCs in vitro. Freshly sorted HSCs were cultured under HSC culture conditions (SCF+TPO) for 14 days (n = 3). During the culture, cells were treated with 200 nM 4-hydroxytamoxifen (4-OHT) for 16 hours from 24 hours after cell sorting to induce the CreERT-mediated excision of Phf6. Data are shown as the mean plus or minus SEM. *P < .05, **P < .01, ***P < .001 by the Student t test.
Expression profiling of Phf6Δ/y HSCs
To elucidate the molecular mechanisms underlying the enhanced self-renewal capacity of HSCs in the absence of Phf6, we performed RNA sequencing using CD150+CD34−LSK HSCs from 12-week-old VC and VC;Phf6Δ/y, 12-week-old MC and MC;Phf6Δ/y that had been injected with pIpC at 3 weeks of age, and 1° recipients reconstituted with CE or CE;Phf6Δ/y BM cells. BM cells from 12-week-old MC;Phf6Δ/y mice that had been injected with pIpC at 7 weeks of age (young adult) also showed an enhanced repopulating capacity (data not shown). Therefore, we also performed RNA sequencing using CD150+CD34−LSK HSCs from 12-week-old MC and MC;Phf6Δ/y that had been injected with pIpC at 7 weeks of age. The results of this analysis revealed that gene-expression profiles were specific to the deleter strain and/or developmental stages of the Phf6 deletion; for example, only 2 of 296 upregulated genes and 7 of 95 downregulated genes in VC;Phf6Δ/y HSCs relative to VC HSCs were common in these 4 gene sets (supplemental Figure 3A-B), whereas all 4 Phf6-deficient HSCs showed similar gene-expression changes in the principal component analysis (supplemental Figure 3C). To identify the gene(s) and/or pathway (s) responsible for the enhanced self-renewal of Phf6-deficient HSCs, we divided these data sets into 2 groups according to the Phf6 genotypes, Phf6W/y and Phf6Δ/y, and performed a statistical analysis and gene-set enrichment analysis (GSEA). Seventy-two differentially expressed genes with a q value of <0.05 were identified between Phf6W/y and Phf6Δ/y HSCs (Figure 5A-B) and some of these expression changes were confirmed by reverse transcription (RT)-qPCR (Figure 5C). Sixty-eight of the 72 differentially expressed genes were downregulated in Phf6Δ/y HSCs, indicating that Phf6 is primarily implicated in transcriptional activation in HSCs; however, Phf6 has been reported to modulate the local chromatin structure in both transcriptionally active and inactive gene promoters.17 GSEA revealed the positive enrichment of gene sets for E2F targets, MYC targets, and oxidative phosphorylation in Phf6Δ/y HSCs. In contrast, gene sets for TNFα signaling (which restricts HSC activity),21 transforming growth factor β signaling (an important niche-associated signaling pathway that maintains HSCs in a dormant state),22 and the apoptosis pathway were negatively enriched in Phf6Δ/y HSCs (Figure 5D). These signaling pathways have a negative impact on HSC proliferation and/or survival and may contribute to the unique characteristics of Phf6-deficient HSCs, which showed active cell cycling and proliferation. We then investigated the effects of the TNFα treatment on HSC proliferation. VC;Phf6Δ/y HSCs grew significantly better than the control even in the presence of TNFα. The proliferation of VC HSCs was inhibited to the same degree by 1 ng/mL TNFα as 20 ng/mL TNFα. In contrast, the same amount of TNFα did not significantly affect the proliferation of VC;Phf6Δ/y HSCs. VC;Phf6Δ/y HSCs proliferated to a similar degree as nontreated VC HSCs even in the presence of 5 ng/mL TNFα (Figure 5E). These results indicate that VC;Phf6Δ/y HSCs are significantly more resistant to TNFα-induced growth inhibition than VC HSCs and at least partially explain why the loss of Phf6 confers a competitive advantage on HSCs.
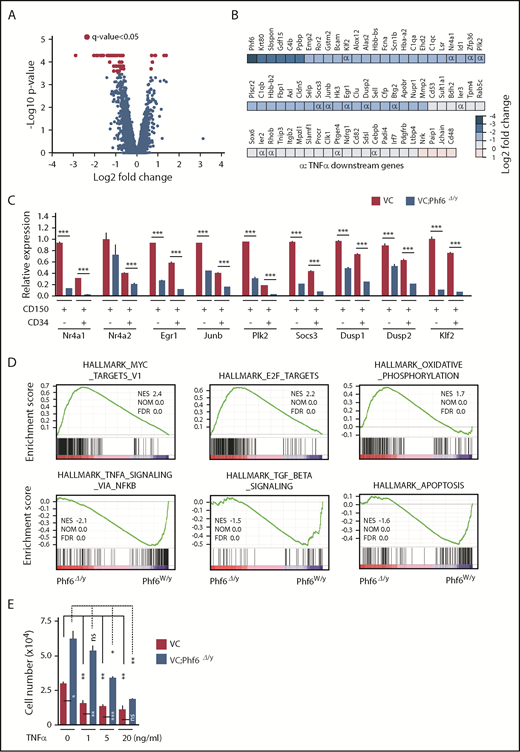
Expression profiling on Phf6-deficient HSCs. (A) Volcano plot showing gene-expression changes upon the Phf6 deletion. Red circles indicate genes that showed significant expression changes (q value < 0.05) in Phf6Δ/y HSCs. (B) Differentially expressed genes and their fold-expression changes are shown as a heatmap. “α” shows genes included in the gene set “HALLMARK_TNFA_SIGNALING_VIA_NFKB.” (C) RT-qPCR analysis of the indicated genes in CD150+CD34−LSK and CD150+CD34+LSK cells. Hprt1 was used to normalize the amount of input RNA. Data are shown as the mean plus or minus SEM (n = 3). Significance is shown relative to VC. *P < .05, **P < .01, ***P < .001 by the Student t test. (D) GSEA performed using RNA-sequence data. GSEA plots of representative data are shown. Normalized enrichment scores (NES), nominal P values (NOM), and false discovery rates (FDR) are indicated. (E) Effects of TNFα on HSC proliferation. Freshly sorted HSCs were cultured under HSC culture conditions (10 ng/mL SCF and TPO) with various dosages of TNFα for 10 days. Data are shown as the mean plus or minus SEM. *P < .05; **P < .005; ***P < .0005 by the Student t test. TGF, transforming growth factor.
Expression profiling on Phf6-deficient HSCs. (A) Volcano plot showing gene-expression changes upon the Phf6 deletion. Red circles indicate genes that showed significant expression changes (q value < 0.05) in Phf6Δ/y HSCs. (B) Differentially expressed genes and their fold-expression changes are shown as a heatmap. “α” shows genes included in the gene set “HALLMARK_TNFA_SIGNALING_VIA_NFKB.” (C) RT-qPCR analysis of the indicated genes in CD150+CD34−LSK and CD150+CD34+LSK cells. Hprt1 was used to normalize the amount of input RNA. Data are shown as the mean plus or minus SEM (n = 3). Significance is shown relative to VC. *P < .05, **P < .01, ***P < .001 by the Student t test. (D) GSEA performed using RNA-sequence data. GSEA plots of representative data are shown. Normalized enrichment scores (NES), nominal P values (NOM), and false discovery rates (FDR) are indicated. (E) Effects of TNFα on HSC proliferation. Freshly sorted HSCs were cultured under HSC culture conditions (10 ng/mL SCF and TPO) with various dosages of TNFα for 10 days. Data are shown as the mean plus or minus SEM. *P < .05; **P < .005; ***P < .0005 by the Student t test. TGF, transforming growth factor.
Phf6 activates downstream effectors of TNFα signaling
Fourteen of the 72 differentially expressed genes, such as Nr4a1, Egr1, and Junb, were included in the gene set for TNFα signaling and were downregulated in Phf6Δ/y HSCs (marked as α in Figure 5B). Nr4a1 is a member of the Nr4a family of genes encoding orphan nuclear receptors, including Nr4a1, Nr4a2, and Nr4a3. In contrast to typical nuclear receptors, NR4A subfamily members act as ligand-independent constitutively active transcription factors.23 Nr4a1 and Nr4a3 are tumor-suppressor genes in hematological malignancies and the concomitant deletion of Nr4a1 and Nr4a3 was previously shown to induce myeloid malignancies associated with the abnormal expansion of LT-HSCs.24,25 The overexpression of Nr4a2 has an adverse impact on the repopulating capacity and in vitro proliferation of HSCs by enforcing the quiescence of HSCs.26 Furthermore, the expression of Nr4a1 is known to be under the control of TNFα in fibroblasts and dopamine neurons.27 Egr1 and Junb have also been implicated in the negative regulation of HSC functions,28,29 and are downregulated in leukemia cells that weakly express Nr4a.25 Collectively, these findings strongly indicate that Nr4a1 is a target of Phf6 and negatively regulates HSC proliferation, similar to Nr4a2, possibly by activating Egr1 and Junb under the control of TNFα. This idea was supported by the results showing that the enforced expression of Phf6 significantly induced the expression of Nr4a1 in LSK cells (Figure 6A) and that Phf6 binds to the NR4A1 promoter in K562 leukemic cells (Figure 6B).
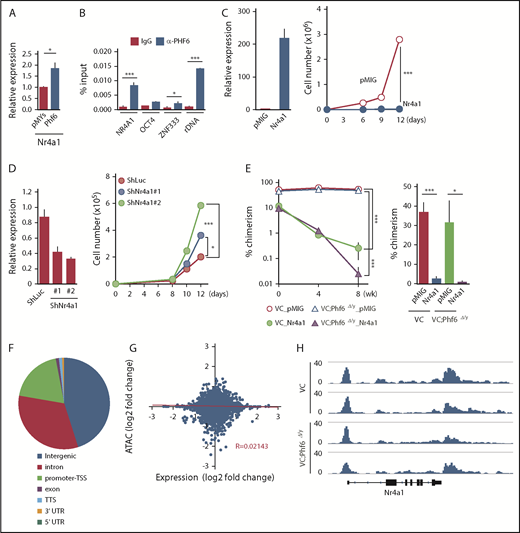
Phf6 activates downstream effectors of TNFα signaling. (A) RT-qPCR analysis of Nr4a1 in control (pMYs) or Phf6-transduced LSK cells. (B) ChIP qPCR analysis using the PHF6 antibody in K562 cells. The relative amount of immunoprecipitated DNA is depicted as a percentage of input DNA. Data are shown as the mean plus or minus SEM of triplicate PCRs. Significance is shown relative to the immunoglobulin G (IgG) control. (C) Gain-of-function analysis of the Nr4a1 gene. HSCs were transduced with a control retrovirus (pMIG) or a retrovirus expressing Nr4a1 (Nr4a1). After GFP sorting, GFP+ cells were subjected to a RT-qPCR analysis (left panel) and proliferation assay (right panel). In the proliferation assay, GFP+ cells were cultured under HSC culture conditions (SCF+TPO) for 12 days. (D) Loss-of-function analysis of the Nr4a1 gene. HSCs were transduced with lentiviruses generating shRNAs against Luciferase (Luc) or Nr4a1, and GFP+ cells were then processed as shown in panel C. (E) Effects of Nr4a1 expression on VC;Phf6Δ/y HSCs in vivo. HSCs were sorted from VC or VC;Phf6Δ/y mice, transduced with a control retrovirus (pMIG), or a retrovirus expressing Nr4a1 (Nr4a1), and transplanted into irradiated CD45.1 recipients together with CD45.1 rescue BM cells. The chimerism of GFP+CD45.2+ donor-derived cells in PB (left panel) and BM HSCs 8 weeks after transplantation (right panel) is shown (n = 5 or 6). The chimerism at 0 weeks shows the transduction efficiency of HSCs examined just before transplantation. (F) Pie chart showing the distribution of 75 230 ATAC peaks in HSCs. (G) Scatterplot showing gene-expression changes in Phf6Δ/y HSCs relative to Phf6W/y HSCs and changes in ATAC signals at the proximal promoter regions in VC;Phf6Δ/y HSCs relative to VC HSCs. The correlation coefficient between changes in expression and ATAC signals as well as the linear regression are shown in red. (H) Gene tracks showing ATAC peaks in VC and VC;Phf6Δ/y HSCs at the Nr4a1 locus. The x-axis indicates the linear sequence of genomic DNA, and the y-axis represents the total number of mapped reads. rDNA, ribosomal DNA; TTS, transcription termination site; UTR, untranslated region.
Phf6 activates downstream effectors of TNFα signaling. (A) RT-qPCR analysis of Nr4a1 in control (pMYs) or Phf6-transduced LSK cells. (B) ChIP qPCR analysis using the PHF6 antibody in K562 cells. The relative amount of immunoprecipitated DNA is depicted as a percentage of input DNA. Data are shown as the mean plus or minus SEM of triplicate PCRs. Significance is shown relative to the immunoglobulin G (IgG) control. (C) Gain-of-function analysis of the Nr4a1 gene. HSCs were transduced with a control retrovirus (pMIG) or a retrovirus expressing Nr4a1 (Nr4a1). After GFP sorting, GFP+ cells were subjected to a RT-qPCR analysis (left panel) and proliferation assay (right panel). In the proliferation assay, GFP+ cells were cultured under HSC culture conditions (SCF+TPO) for 12 days. (D) Loss-of-function analysis of the Nr4a1 gene. HSCs were transduced with lentiviruses generating shRNAs against Luciferase (Luc) or Nr4a1, and GFP+ cells were then processed as shown in panel C. (E) Effects of Nr4a1 expression on VC;Phf6Δ/y HSCs in vivo. HSCs were sorted from VC or VC;Phf6Δ/y mice, transduced with a control retrovirus (pMIG), or a retrovirus expressing Nr4a1 (Nr4a1), and transplanted into irradiated CD45.1 recipients together with CD45.1 rescue BM cells. The chimerism of GFP+CD45.2+ donor-derived cells in PB (left panel) and BM HSCs 8 weeks after transplantation (right panel) is shown (n = 5 or 6). The chimerism at 0 weeks shows the transduction efficiency of HSCs examined just before transplantation. (F) Pie chart showing the distribution of 75 230 ATAC peaks in HSCs. (G) Scatterplot showing gene-expression changes in Phf6Δ/y HSCs relative to Phf6W/y HSCs and changes in ATAC signals at the proximal promoter regions in VC;Phf6Δ/y HSCs relative to VC HSCs. The correlation coefficient between changes in expression and ATAC signals as well as the linear regression are shown in red. (H) Gene tracks showing ATAC peaks in VC and VC;Phf6Δ/y HSCs at the Nr4a1 locus. The x-axis indicates the linear sequence of genomic DNA, and the y-axis represents the total number of mapped reads. rDNA, ribosomal DNA; TTS, transcription termination site; UTR, untranslated region.
To understand the impact of deregulated Nr4a1 in Phf6Δ/y HSCs, we conducted gain- and loss-of-function analyses on Nr4a1 in HSCs. CD150+CD34−LSK HSCs from wild-type (WT) mice were transduced with an empty or Nr4a1 virus, sorted according to the expression of green fluorescent protein (GFP) as a marker of transduction, and then cultured for 12 days in media containing SCF and TPO. The enforced expression of Nr4a1 severely compromised the proliferation of HSCs (Figure 6C), similar to Nr4a2.26 In contrast, the shRNA-mediated knockdown of Nr4a1 promoted the proliferation of HSCs (Figure 6D). We then investigated the effects of Nr4a1 overexpression on VC and VC;Phf6Δ/y HSCs in vivo. VC or VC;Phf6Δ/y HSCs were transduced with a control or Nr4a1 retrovirus and transplanted into lethally irradiated recipients along with Ly5.1 rescue cells. Exogenous Nr4a1 induced progressive declines in the chimerism of VC and VC;Phf6Δ/y donor cells in PB and HSCs (Figure 6E). These results suggest that the reduced expression of Nr4a1 at least partially accounts for the enhanced repopulating capacity of Phf6Δ/y HSCs.
To clarify whether the Phf6 deletion has any impact on the chromatin configuration in HSCs, we performed an Assay for Transposase Accessible chromatin with high-throughput sequencing (ATAC-Seq) analysis on CD34−LSK HSCs from VC and VC;Phf6Δ/y mice with 2 independent biological replicates. ATAC-Seq profiles open chromatin regions enriched for transcriptional regulatory regions, such as enhancers and promoters. We detected 75 230 peaks after peak calling by counting the peaks in VC and VC;Phf6Δ/y HSCs. These ATAC peaks were mostly located in intergenic regions, promoter TSSs, and introns (Figure 6F). Among them, only 781 and 858 peaks were consistently upregulated (log2 fold change > 1) and downregulated (log2 fold change less than −1), respectively, in 2 VC;Phf6Δ/y HSC replicates from those in VC control HSC replicates. A motif analysis of ATAC peaks in the proximal promoter (TSS ± 2 kb) revealed that only a few DNA motifs were weakly enriched in VC;Phf6Δ/y HSCs (supplemental Figure 3D), whereas none were in VC HSCs. We then extracted ATAC peaks in the proximal promoter, compared them with expression profiling data, and found that ATAC signal intensities in proximal promoters positively correlated with the expression levels of genes in VC HSCs (supplemental Figure 3E), which supported the validity of ATAC-Seq data. However, no correlation was observed between fold changes in gene expression and ATAC signals in VC;Phf6Δ/y HSCs relative to VC HSCs (Figure 6G). For example, the ATAC signal was similarly observed at the Nr4a1 promoter in VC and VC;Phf6Δ/y HSCs (Figure 6H), even though the expression of Nr4a1 had clearly decreased in VC;Phf6Δ/y HSCs. These results demonstrate that the Phf6 deletion had a minimal effect on the chromatin configuration, suggesting that Phf6 regulates transcriptional activation at the step after chromatin relaxation around transcriptional regulatory elements.
PHF6 has been reported to bind to gene bodies and proximal promoter/enhancer regions of many annotated genes, where it modulates the binding or activity of lineage-specific transcription factors.17 The binding motifs of NF-κB, an important downstream effector in the TNFα signaling pathway, were enriched in PHF6-bound DNA fragments.17 Physical interaction of PHF6 with NF-κB has also been reported.17 These results imply that PHF6 physically interacts with transcription factors, such as NF-κB, and augments their capacity to activate transcription. However, we could not reproduce the physical interaction between PHF6 and NF-κB (p65) in TNFα-treated K562 cells (data not shown). We then performed chromatin immunoprecipitation (ChIP) combined with high-throughput sequencing of PHF6 and NF-κB (p65) using K562 cells treated with TNFα. PHF6 and NF-κB peaks were mainly detected in the intergenic regions, introns, and promoter TSSs (Figure 7A). The average sizes for the PHF6 and NF-κB peaks were 162 bp and 223 bp, respectively. Of note, PHF6 and NF-κB peaks significantly overlapped in K562 cells treated with TNFα (Figure 7B-C). NF-κB signals were markedly enhanced in all genomic regions upon TNFα treatment, whereas PHF6 signals in these NF-κB–bound regions were moderately albeit significantly enhanced in the promoter TSSs regions and, to a lesser extent, in introns (Figure 7D). These observations strongly indicate the functional interaction between PHF6 and NF-κB. When we checked the colocalization of the PHF6 and NF-κB peaks within 100 bp upstream and downstream of each peak, an additional 52 peaks appeared to be in close proximity to each other, suggesting that PHF6 also facilitates p65 binding in an indirect way via changing the chromatin accessibility in the locus.
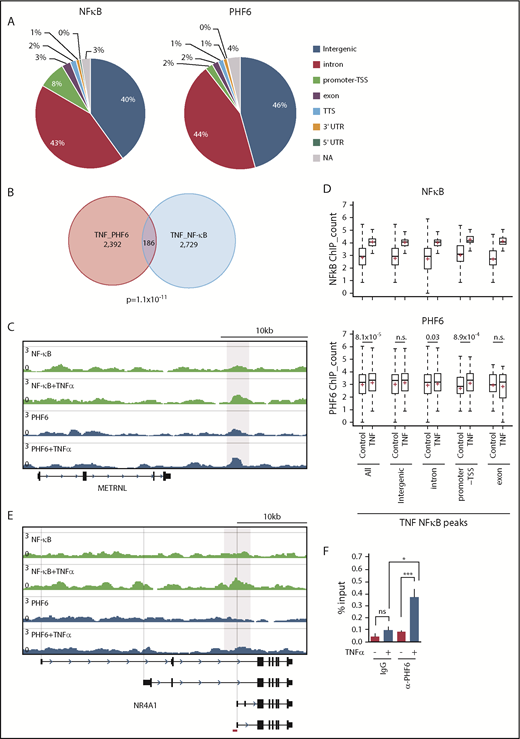
TNFα enhances the genomic binding of PHF6. (A) Pie chart showing the distribution of PHF6 and NF-κB (p65) peaks. (B) Venn diagram showing the overlap between PHF6 and NF-κB (p65) peaks. (C) Gene tracks showing PHF6 and NF-κB (p65) peaks in control and TNFα-treated K562 cells at the METRNL locus. The x-axis indicates the linear sequence of genomic DNA, and the y-axis represents the total number of mapped reads. (D) Box-and-whisker plots showing NF-κB (p65) and PHF6 ChIP combined with high-throughput sequencing signals in the NF-κB–bound regions identified in TNFα-treated K562 cells. Boxes represent 25 to 75 percentile ranges. Vertical lines represent 10 to 90 percentile ranges. Horizontal bars represent medians. Mean values are indicated by red crosses. (E) Gene tracks showing PHF6 and NF-κB (p65) peaks in control and TNFα-treated K562 cells at the NR4A1 locus. The x-axis indicates the linear sequence of genomic DNA, and the y-axis represents the total number of mapped reads. The region detected by ChIP qPCR is indicated by a red bar. (F) ChIP qPCR assays for NF-κB (p65) and PHF6 in control and TNFα-treated K562 cells at the NR4A1 locus. The relative amounts of immunoprecipitated DNA are depicted as percentages of input DNA. Data are shown as the mean plus or minus SEM of triplicate PCRs. *P < .05, **P < .01, ***P < .001 by the Student t test. NA, not applicable; n.s., not significant.
TNFα enhances the genomic binding of PHF6. (A) Pie chart showing the distribution of PHF6 and NF-κB (p65) peaks. (B) Venn diagram showing the overlap between PHF6 and NF-κB (p65) peaks. (C) Gene tracks showing PHF6 and NF-κB (p65) peaks in control and TNFα-treated K562 cells at the METRNL locus. The x-axis indicates the linear sequence of genomic DNA, and the y-axis represents the total number of mapped reads. (D) Box-and-whisker plots showing NF-κB (p65) and PHF6 ChIP combined with high-throughput sequencing signals in the NF-κB–bound regions identified in TNFα-treated K562 cells. Boxes represent 25 to 75 percentile ranges. Vertical lines represent 10 to 90 percentile ranges. Horizontal bars represent medians. Mean values are indicated by red crosses. (E) Gene tracks showing PHF6 and NF-κB (p65) peaks in control and TNFα-treated K562 cells at the NR4A1 locus. The x-axis indicates the linear sequence of genomic DNA, and the y-axis represents the total number of mapped reads. The region detected by ChIP qPCR is indicated by a red bar. (F) ChIP qPCR assays for NF-κB (p65) and PHF6 in control and TNFα-treated K562 cells at the NR4A1 locus. The relative amounts of immunoprecipitated DNA are depicted as percentages of input DNA. Data are shown as the mean plus or minus SEM of triplicate PCRs. *P < .05, **P < .01, ***P < .001 by the Student t test. NA, not applicable; n.s., not significant.
Among 68 of the 72 differentially expressed genes downregulated in Phf6Δ/y HSCs, only 11 genes (Gstm2, Klf2, Fbp1, Cd82, Mpzl1, Sox6, Cd53, Cldn5, Ptger4, Ror2, and Selp) appeared to be the direct targets of PHF6 in K562 cells. Although the peak calling failed to identify PHF6 peaks at the NR4A1 locus, TNFα enhanced binding of PHF6 to the region encompassing introns 3 and 4 of NR4A1, in which the ENCODE project identified the peak of acetylated histone H3 at lysine 27 (https://genome.ucsc.edu) (Figure 7E). This observation was validated by ChIP qPCR (Figure 7F). These results indicate that PHF6 regulates expression of the downstream effector genes of TNFα signaling at the step after chromatin relaxation around transcriptional regulatory elements, by modulating the function of transcription factors, such as NF-κB.
Discussion
In the present study, we demonstrated that Phf6 is a critical negative regulator of HSC self-renewal. The loss of Phf6 potentiated the repopulating capacity of adult HSCs independently of the developmental stages of the Phf6 deletion. However, we observed a marked difference in kinetics; neonatal HSCs acquired a competitive advantage immediately after the loss of Phf6, whereas adult HSCs required a longer time period or hematopoietic stress, such as secondary transplantation, indicating that actively cycling HSCs are more sensitive to the Phf6 deletion than dormant HSCs. In the S phase of the cell cycle, chromatin undergoes transient disruption and restoration to replicate parental chromatin. During the restoration process, parental nucleosomes containing histone marks are diluted by the deposition of newly synthesized histones. Thus, chromatin replication is a time window of opportunity for changing the chromatin structure, thereby altering the transcription factor profile on chromatin.30 A proteomic analysis identified PHF6 as a component of nascent chromatin.31 These findings implicate PHF6 in the loading of transcription factors on chromatin or the functional regulation of transcription factors in the S phase. This may explain why cycling HSCs acquired enhanced repopulating activity in a shorter time than dormant HSCs upon Phf6 deletion. Of note, the CRISPR/Cas9-mediated deletion of Phf6 did not affect the proliferation of ES cells or leukemic cell lines (S. Miyagi, unpublished data), indicating that Phf6 is not a general negative regulator of cell-cycle progression, but functions in a cell-context–dependent manner. The Phf6 deletion led to the downregulation of a set of genes associated with TNFα signaling and conferred resistance against the TNFα-mediated growth inhibition on HSCs by directly and indirectly activating the downstream effectors of TNFα signaling, such as Nr4a1, Egr1, and Junb. TNFα is induced by hematopoietic stress, such as total-body irradiation, infection, and inflammation. Correspondingly, a previous study demonstrated that the deletion of genes encoding receptors for TNFα, Tnfrsf1a and Tnfrsf1b, enhanced the repopulating capacity of HSCs without affecting the HSC pool size in donor mice after transplantation21 ; however, the role for TNFα in steady-state hematopoiesis remains controversial. Therefore, the impact of Phf6 loss may become more apparent under stress conditions, such as transplantation, but not under steady-state conditions.
Recurrent inactivating mutations have been identified in the X-linked PHF6 gene in various hematological malignancies. Consistent with this, Phf6Δ/y HSCs showed better chimerism than control HSCs in a competitive setting, which was maintained in the long-term in a serial transplantation setting, indicating that a Phf6 deficiency promotes HSC self-renewal. The expression and secretion of inflammatory cytokines, such as TNFα and interleukin-6 (which are inhibitory toward normal HSCs),32-34 are deregulated in hematological malignancies, including myelodysplastic syndrome and AML. These findings together with the present results showing that the loss of Phf6 confers resistance to TNFα on HSCs suggest a role for inactivating mutations in PHF6 in promoting the transformation and clonal evolution of hematopoietic cells. Because cycling HSCs readily acquired a growth advantage over dormant HSCs by the loss of Phf6, a PHF6 insufficiency in infants and young children may have a stronger impact on the pathogenesis of hematological malignancies than in adults. PHF6 has been identified as the second most frequently mutated gene in pediatric cancers.35 However, VC;Phf6Δ/y HSCs retained a multilineage differentiation capacity during serial transplantations and did not induce any hematological malignancies, even in 3° recipient mice. These findings indicate that a Phf6 insufficiency alone is not adequate to induce hematopoietic transformation; cooperating mutations are needed. This idea is supported by the overexpression of microRNA targeting Phf6 accelerating the onset of leukemia in Notch1-induced T-ALL in mice.36 In this regard, it will be interesting to examine whether the deletion of Phf6 accelerates the development of AML induced by RUNX1 mutants because RUNX1 mutations significantly co-occur with PHF6 mutations in patients with myeloid malignancies.12
HSCs from VC;Phf6Δ/y male mice showed an enhanced repopulating capacity; therefore, HSCs from VC;Phf6Δ/Δ females and VC;Phf6Δ/wt females with inactivated WT X chromosomes are considered to acquire an enhanced repopulating capacity in a similar manner to HSCs from Phf6Δ/y males. Although PHF6 mutations are highly male biased in AML and T-ALL,10,11 it will also be interesting to investigate the phenotypes of HSCs from VC;Phf6Δ/wt and VC;Phf6Δ/Δ female mice.
During the preparation of our revised manuscript, Wendorff et al reported that the Phf6 deletion using Vav1-iCre and CreERT deleter lines enhances self-renewal of HSCs in a setting of serial transplantation.37 Their findings are consistent with ours. However, there are several differences in profiles of altered gene expression and chromatin accessibility upon the deletion of Phf6. Wendorff et al performed these analyses using the CreERT2 deleter, whereas we used the Vav1-iCre deleter. We speculate that the discrepancies are mainly attributed to the deleter strains and the developmental stages of Phf6 deletion. As we showed in the present study, the expression profiles of HSCs upon the deletion of Phf6 are greatly affected by these factors.
The next-generation sequencing data reported in this article have been deposited in the DNA Data Bank of Japan (DDBJ; numbers DRA007053 and DRA008015).
The online version of this article contains a data supplement.
The publication costs of this article were defrayed in part by page charge payment. Therefore, and solely to indicate this fact, this article is hereby marked “advertisement” in accordance with 18 USC section 1734.
Acknowledgments
The supercomputing resource was provided by the Human Genome Center, the Institute of Medical Science, University of Tokyo.
The work in the Helin laboratory was supported by grants from the Danish National Research Foundation (DNRF82; K.H.) and through a center grant from the Novo Nordisk Foundation (NNF17CC0027852; K.H.). The work in the Iwama laboratory was supported in part by Grants-in-Aid for Scientific Research (#16K09840) and Scientific Research on Innovative Areas “Stem Cell Aging and Disease” (#26115002) from Ministry of Education, Culture, Sports, Science and Technology (MEXT), Japan. P.S. was supported by a Marie Curie Intra-European postdoctoral fellowship.
Authorship
Contribution: S. Miyagi, J.C., K.H., and A.I. designed this study; S. Miyagi performed experiments, analyzed data, and actively wrote the manuscript; P.S., Y.K., Y.N.-T., O.R., Y.M., and N.T. performed experiments and analyzed data; M.O. analyzed next-generation sequencing data; A.S., S. Mizuno, F.S., and S.T. generated the Phf6 knockout mouse; and K.H. and A.I. conceived of and directed the project, secured funding, and actively wrote the manuscript.
Conflict-of-interest disclosure: The authors declare no competing financial interests.
Correspondence: Satoru Miyagi, Department of Life Science, Faculty of Medicine, Shimane University, 89-1 Enya, Izumo City, Shimane 693-8501, Japan; e-mail: miyagi@med.shimane-u.ac.jp; Kristian Helin, Biotech Research and Innovation Centre (BRIC), University of Copenhagen, Ole Maaløes Vej 5, 2200 Copenhagen, Denmark; e-mail: helink@mskcc.org; or Atsushi Iwama, Department of Cellular and Molecular Medicine, Graduate School of Medicine, Chiba University, 1-8-1 Inohana, Chuo-ku, Chiba 260-8670, Japan; e-mail: 03aiwama@ims.u-tokyo.ac.jp.

This feature is available to Subscribers Only
Sign In or Create an Account Close Modal