

Key Points
Loss of the selective autophagy receptor p62 impairs leukemia development in a murine leukemia model.
p62 binds to mitochondria in leukemia cells and is required for efficient removal of damaged mitochondria by mitophagy.

Abstract
Autophagy maintains hematopoietic stem cell integrity and prevents malignant transformation. In addition to bulk degradation, selective autophagy serves as an intracellular quality control mechanism and requires autophagy receptors, such as p62 (SQSTM1), to specifically bridge the ubiquitinated cargos into autophagosomes. Here, we investigated the function of p62 in acute myeloid leukemia (AML) in vitro and in murine in vivo models of AML. Loss of p62 impaired expansion and colony-forming ability of leukemia cells and prolonged latency of leukemia development in mice. High p62 expression was associated with poor prognosis in human AML. Using quantitative mass spectrometry, we identified enrichment of mitochondrial proteins upon immunoprecipitation of p62. Loss of p62 significantly delayed removal of dysfunctional mitochondria, increased mitochondrial superoxide levels, and impaired mitochondrial respiration. Moreover, we demonstrated that the autophagy-dependent function of p62 is essential for cell growth and effective mitochondrial degradation by mitophagy. Our results highlight the prominent role of selective autophagy in leukemia progression, and specifically, the importance of mitophagy to maintain mitochondrial integrity.
Introduction
The well-accepted paradigm of leukemogenesis in acute myeloid leukemia (AML) postulates that transformation occurs at the hematopoietic stem cell (HSC) or progenitor cell stage. During this process, HSCs reprogram their metabolic machinery to escape cell death, become autonomous, and acquire new invasive properties leading to expansion of myeloid blasts in the bone marrow (BM). It has been shown that deregulation of autophagy in HSCs contributes to leukemogenesis.1
Macroautophagy, hereafter referred to as autophagy, is a catabolic degradative process delivering cytoplasmic components to the lysosome.2 Through “self-digestion” of its own cytoplasmic contents, the cell recycles all nutrients when energy supply is limited. In addition, under nutrient-rich conditions, autophagy serves as an intracellular quality control system to selectively remove, among others, protein aggregates and damaged or redundant organelles. This so-called selective autophagy represents an alternative molecular mechanism that requires key scaffold proteins to transport specific substrates into autophagosomes. p62/SQSTM1 (sequestosome 1, hereafter referred to as p62) is 1 of the best characterized selective autophagy receptors that participates in different types of selective autophagy, including aggrephagy (targeting protein aggregates), pexophagy (targeting peroxisomes), and mitophagy (targeting damaged mitochondria).3-7 Importantly, it has been shown that p62 targets NF-κB, mTOR, and Wnt signaling, providing a molecular link between autophagy and cancer.8 Moreover, it was reported that p62 has a prosurvival function during all-trans retinoic acid treatment in acute promyelocytic leukemia depending on NF-κB activation.9 However, little is known about the contribution of p62 in leukemia development in the context of selective autophagy. In this study, we present conclusive evidence that supports a role for p62 in leukemia development and progression as a selective autophagy receptor for damaged mitochondria.
Methods
Detailed methods are available in the supplemental Methods, available on the Blood Web site.
Mice
We used the previously published p62−/− mice.10 Wild-type (WT) C57BL/6J (6- to 12-week-old) mice were purchased from Janvier Labs (Mayenne, France). All mice were kept under pathogen-free conditions in the research animal facility of the University Hospital Frankfurt according to institutional guidelines. All animal experiments were approved by the official committee on animal experimentation (Regierungspräsidium Darmstadt).
Competitive proliferation assay
Competitive proliferation assay was performed in human and murine leukemia cell lines after CRISPR/Cas9–based knockout and short hairpin RNA–based knockdown of p62, respectively. In the human AML cell lines, puromycin-selected cells were cocultured in a ratio of 50% GFP+ (Crp62):50% GFP− (CrNTC), and GFP expression was monitored daily using flow cytometry.
Murine leukemia model
The detailed procedures of the murine leukemia model by BM transplantation are described in the supplemental Methods.
Quantitative interaction proteomics
For tandem mass tag (TMT) labeling-based quantitative proteomic experiments, 108 cells were expanded in Iscove's modified Dulbecco's medium and treated with dimethyl sulfoxide or 100 nm bafilomycin A1 (BafA) for 3 hours. Cells were harvested and lysed in lysis buffer containing 150 nM NaCl, 50 nM Tris (pH 7.5-7.8), 5 mM NaF, 0.5% nonyl phenoxypolyethoxylethanol 40, 1× Protease Inhibitor Cocktail (Roche), and 2 mM sodium orthovanadate. Cell lysates were incubated with mouse anti-SQSTM1/p62 (Abnova) overnight at 4°C. All proteins that bound into p62 were coimmunoprecipitated using Protein A/G PLUS-Agarose beads (Santa Cruz Biotechnology). The detailed protocol of sample preparation for TMT and proteomic analysis is described in supplemental Methods.
Measurement of OCR
Mitochondrial respiration was measured by the oxygen consumption rate (OCR) of cells in real time by the fully integrated 96-well Seahorse Bioscience Extracellular Flux Analyzer XF96 (Seahorse Bioscience) using the XF Cell Mito Stress Test Kit (Seahorse Bioscience). Cells (0.5 × 10⁶) were seeded in growth medium at 37°C in XF96 Polystyrene Cell Culture Microplate (Seahorse Bioscience) for 3 hours. Afterward, cells were washed twice with basal Dulbecco’s modified Eagle medium and kept in culture at 37°C for an additional 1 hour without CO2 in the stress assay medium as described by the manufacturer. OCR was measured in the presence of 20 µM oligomycin, 50 µM carbonyl cyanide 4-(trifluoromethoxy)phenylhydrazone (FCCP), and antimycine and rotenone, each 20 µM.
Statistical analysis
Data are shown in mean value ± standard error of the mean (SEM). All statistical tests and diagrams, unless stated otherwise, were performed in GraphPad Prism 5 software. Normally distributed groups were compared using 2-tailed Student t test with P ≤ .05 considered statistically significant. Correlation analysis was performed using Pearson’s correlation.
Results
High p62 expression in AML blasts is associated with poor survival
We hypothesized that p62 may have a prognostic role in AML and examined its relevance on clinical outcome in AML patients. Therefore, p62 expression values from RNA sequencing data and survival data from the TCGA LAML data set containing 173 adult patients with de novo AML were analyzed. Kaplan-Meier survival curves of AML patients were stratified by low (first quartile) and high (fourth quartile) p62 gene expression.11 High p62 expression was significantly associated with poor overall survival of adult patients with de novo AML (Figure 1A). Subgroup analyses showed no correlation of p62 expression levels with cytogenetic risk groups or FLT3-ITD status (supplemental Table 2). Although there was a weak correlation of NPM1 mutation with high p62 expression (supplemental Table 2), Kaplan-Meier survival curves of NPM1-mutated patients displayed no significant differences regarding p62 expression levels (supplemental Figure 1A). Notably, similar analyses for other autophagy receptors, including NBR1, NDP52, CALCOCO3, and FUNDC1, revealed no influence on overall survival (supplemental Figure 1B-E).

p62 levels correlate with survival, and p62 depletion impairs cell growth in human and murine leukemia cells. (A) Kaplan-Meier survival curves of adult AML patients were stratified by lowest (red) and highest (black) p62 gene expression (n = 40 in lowest quartile, n = 41 in highest quartile; P = .026), which was analyzed from RNA sequencing data and survival data from the TCGA LAML data set containing 173 adult patients with de novo AML. (B) Competitive cell growth of CRISPR/Cas9 targeted human p62 (Crp62, GFP+) and human nontargeting control (CrNTC, GFP−) in human AML cell lines THP1, U937, NB4, and Molm13 measured by flow cytometry on indicated days (pooled data from 3 independent experiments). (C) Quantification of cell proliferation of shp62 and scrambled nucleotide control short hairpin RNA (shCtrl) MN1- and HoxA9/Meis1-driven ldMBM leukemia cells was performed by seeding 104 cells and counting live cells (by Trypan blue exclusion) at the indicated time points. (D) Colony numbers and (E) cell numbers were determined in serial colony-forming unit assays of p62 knockdown (shp62) and control (shCtrl) MN1-driven ldMBM leukemia cells. (F) shp62 and shCtrl MN1-driven ldMBM leukemia cells were stained with BrdU and 7AAD and analyzed by flow cytometry. The graph shows percentage of cells in each cell-cycle phase (G0/G1, BrdU− 2 N DNA content; S: BrdU+; G2/M, BrdU− 4N DNA content). All experiments in panels B-F were performed in triplicate. The statistical significance between 2 groups was analyzed by a standard Student t test. Error bars represent SEM. *P ≤ .05; **P ≤ .01; ***P ≤ .001.
p62 levels correlate with survival, and p62 depletion impairs cell growth in human and murine leukemia cells. (A) Kaplan-Meier survival curves of adult AML patients were stratified by lowest (red) and highest (black) p62 gene expression (n = 40 in lowest quartile, n = 41 in highest quartile; P = .026), which was analyzed from RNA sequencing data and survival data from the TCGA LAML data set containing 173 adult patients with de novo AML. (B) Competitive cell growth of CRISPR/Cas9 targeted human p62 (Crp62, GFP+) and human nontargeting control (CrNTC, GFP−) in human AML cell lines THP1, U937, NB4, and Molm13 measured by flow cytometry on indicated days (pooled data from 3 independent experiments). (C) Quantification of cell proliferation of shp62 and scrambled nucleotide control short hairpin RNA (shCtrl) MN1- and HoxA9/Meis1-driven ldMBM leukemia cells was performed by seeding 104 cells and counting live cells (by Trypan blue exclusion) at the indicated time points. (D) Colony numbers and (E) cell numbers were determined in serial colony-forming unit assays of p62 knockdown (shp62) and control (shCtrl) MN1-driven ldMBM leukemia cells. (F) shp62 and shCtrl MN1-driven ldMBM leukemia cells were stained with BrdU and 7AAD and analyzed by flow cytometry. The graph shows percentage of cells in each cell-cycle phase (G0/G1, BrdU− 2 N DNA content; S: BrdU+; G2/M, BrdU− 4N DNA content). All experiments in panels B-F were performed in triplicate. The statistical significance between 2 groups was analyzed by a standard Student t test. Error bars represent SEM. *P ≤ .05; **P ≤ .01; ***P ≤ .001.
Loss of p62 impairs cell growth of human and murine AML cell lines
To address the functional role of p62 in tumor growth, we performed proliferation assays in human AML cell lines THP1, U937, NB4, and Molm13 and generated sublines after CRISPR/Cas9-based knockout of p62. We observed that loss of p62 significantly decreased proliferation of all AML cell lines (Figure 1B; supplemental Figure 2A).
Furthermore, lineage-depleted mouse bone marrow (ldMBM) cells were engineered to express the leukemia oncogene Meningioma 1 (MN1) or Hoxa9/Meis1, which are known to induce AML in mice.12,13 Consistent with findings in human AML cell lines (Figure 1B), p62 knockdown with short hairpin RNA (shp62) (supplemental Figure 2B) led to inhibition of cell growth in MN1- and Hoxa9/Meis1-driven ldMBM leukemia cells compared with control cells (shCtrl) (Figure 1C; supplemental Figure 2C). This was also reflected in a defective self-renewal capacity with decreased colony numbers and reduced cell numbers, as shown in serial colony-forming unit assays with MN1-driven ldMBM leukemia cells (Figure 1D-E). Notably, we observed a significant proportional increase of cells in the G0/G1 phase associated with a shortened S phase after loss of p62 (Figure 1F; supplemental Figure 2E), whereas no differences in the apoptosis rate were found (supplemental Figure 2D). Thus, loss of p62 impairs leukemia cell proliferation and decreases colony growth in vitro.
p62 deficiency does not affect HSC function, but delays leukemia development in mice
Detailed baseline characteristics of normal hematopoiesis from p62−/− mice revealed no qualitative differences in the long-term and short-term HSCs and progenitor compartments of the BM (supplemental Figure 3A-B), except a slight decrease of the lineage−Sca1+cKit+ compartment in p62−/− BM (supplemental Figure 3B). Furthermore, loss of p62 had no functional influence on colony-forming and replating efficiency (supplemental Figure 3C-D), implicating that under steady-state condition the presence or absence of p62 has no severe impact on hematopoiesis.
We therefore asked whether p62 has a role under oncogenic stress. To address this issue, we transformed normal lin− BM cells with different oncogenes (MN1, Hoxa9/Meis1) and examined p62 stabilization after blocking autophagic degradation with the lysosomal inhibitor BafA. Interestingly, we found increased p62 turnover in the transformed leukemia cells compared with normal BM cells (supplemental Figure 2F-G), accompanied by higher LC3-II conversion, indicating increased autophagy flux (supplemental Figure 2H). However, loss of p62 did not affect the autophagy flux in MN1-transformed cells (supplemental Figure 2I-J), demonstrating that p62 is dispensable for bulk autophagy but may be required during the process of leukemogenesis.
To elucidate the importance of p62 in myeloid transformation and leukemia development, we used a murine AML model through BM transplantation of ldMBM cells transduced with either MN1 or Hoxa9/Meis1 in the presence or absence of p62 (supplemental Figure 4A). Deletion of p62 was confirmed by genomic polymerase chain reaction (data not shown) and immunoblotting (supplemental Figure 4B-C). When injected into lethally irradiated recipient mice, both MN1- and Hoxa9/Meis1-transformed cells gave rise to leukemia as expected (supplemental Figure 4G-J). Importantly, the loss of p62 led to a significantly longer survival in MN1- (median survival 38 days vs 32 days) as well as in Hoxa9/Meis1-driven leukemia (median survival 37 days vs 32 days) (Figure 2A-B). Peripheral blood analyses at time of death showed increased white blood cell counts and decreased red blood cell counts in p62−/− MN1-leukemic mice (supplemental Figure 4D). Flow cytometric analysis revealed a more immature phenotype after p62 loss in MN1- and Hoxa9/Meis1-driven leukemia as shown by increased lin− population (Figure 2C-D) and increased Lin−cKit+ (LK) cells (supplemental Figure 4E-F). To examine the contribution of p62 in leukemogenesis, we evaluated the frequency of leukemia initiating cell (LIC) populations, which are L-CMPs and L-GMPs in MN1- and Hoxa9/Meis1-driven leukemia, respectively.13,14 Interestingly, loss of p62 led to a significant increase of LIC frequency in both MN1- and Hoxa9/Meis1-driven leukemia (Figure 2C-D).

Loss of p62 delays leukemia development. (A) Kaplan-Meier curve represents survival of WT (n = 10) and p62−/− (n = 15) MN1 leukemic mice. (B) Kaplan-Meier curve represents survival of shCtrl (n = 10) and shp62 (n = 11) Hoxa9/Meis1 leukemic mice. (C) Flow cytometric analysis of Lin− and leukemic common lymphoid progenitor (L-CMP) (cKit+Sca1−CD34+CD16/32+) in MN1 leukemic mice at time of death (n = 9 in WT and n = 8 in p62−/− group). (D) Flow cytometric analysis of Lin− and leukemic granulocyte macrophage progenitor (L-GMP) (cKit+Sca1−CD34+CD16/32−) in Hoxa9/Meis1 leukemic mice at time of death (n = 10 in shCtrl and n = 11 in shp62 group). (E) Colony numbers and (F) cell numbers were determined in colony-forming unit assays of p62−/− and WT MN1-driven ldMBM leukemia cells isolated from the BM of sick mice at time of death (n = 8 in WT and n = 14 in p62−/− group). Each experiment was performed in triplicate with 500 LK cells. (G) Kaplan-Meier curve represents survival of secondary recipients transplanted with 104 GFP+ cells from WT or p62−/− MN1 leukemic mice (n = 9 in both groups) into sublethally irradiated (5.5 Gy) WT-recipient mice. Values are mean ± SEM. *P ≤ .05; **P ≤ .01; ***P ≤ .001.
Loss of p62 delays leukemia development. (A) Kaplan-Meier curve represents survival of WT (n = 10) and p62−/− (n = 15) MN1 leukemic mice. (B) Kaplan-Meier curve represents survival of shCtrl (n = 10) and shp62 (n = 11) Hoxa9/Meis1 leukemic mice. (C) Flow cytometric analysis of Lin− and leukemic common lymphoid progenitor (L-CMP) (cKit+Sca1−CD34+CD16/32+) in MN1 leukemic mice at time of death (n = 9 in WT and n = 8 in p62−/− group). (D) Flow cytometric analysis of Lin− and leukemic granulocyte macrophage progenitor (L-GMP) (cKit+Sca1−CD34+CD16/32−) in Hoxa9/Meis1 leukemic mice at time of death (n = 10 in shCtrl and n = 11 in shp62 group). (E) Colony numbers and (F) cell numbers were determined in colony-forming unit assays of p62−/− and WT MN1-driven ldMBM leukemia cells isolated from the BM of sick mice at time of death (n = 8 in WT and n = 14 in p62−/− group). Each experiment was performed in triplicate with 500 LK cells. (G) Kaplan-Meier curve represents survival of secondary recipients transplanted with 104 GFP+ cells from WT or p62−/− MN1 leukemic mice (n = 9 in both groups) into sublethally irradiated (5.5 Gy) WT-recipient mice. Values are mean ± SEM. *P ≤ .05; **P ≤ .01; ***P ≤ .001.
To further characterize the phenomenon of reduced aggressiveness and increased frequency of LICs in the p62-deficient leukemia, functional analyses from the in vivo experiment were performed in the context of the oncogene MN1. Ex vivo colony-forming assays from LKs displayed lower colony numbers and cell numbers (Figure 2E-F) in p62−/− leukemic mice. Consistent with the in vitro data (Figure 1D-E), again no difference in rate of apoptotic cells was observed between the 2 groups (supplemental Figure 4K). Moreover, serial retransplantation of MN1-driven leukemia cells from primary into secondary recipient animals significantly diminished leukemia progression in p62−/− mice (median = 41 days; range 31-51 days) compared with WT mice (median = 31 days, range 26-41 days) (Figure 2G).
These results indicate that p62 is required for rapid MN1-driven leukemia development and progression.
p62 interacts with mitochondria in an autophagy-dependent manner in MN1-driven leukemia cells
To gain molecular insight into the function of p62 during myeloid transformation, we performed TMT labeling-based quantitative proteomic experiments to identify autophagy-dependent interactors of p62 (Figure 3A).15 We blocked lysosomal degradation by BafA treatment in WT MN1 leukemia cells to maximize p62 interaction with putative autophagic cargos and used p62−/− MN1 leukemia cells to clearly discriminate between interacting proteins and nonspecific binders. We detected 21 proteins significantly enriched with p62, including p62 as the immunoprecipitated bait protein (Figure 3B), and also the well-known p62 interaction partners NBR1 and Keap1, although just below the threshold of significance (P = .14 and P = .0519, respectively). Importantly, 9 in 21 (43%) interaction partners were classified as mitochondrial proteins (Figure 3C-D). In order to test whether known mitochondrial proteins cluster within the set of identified potential p62 interactors in a nonrandom way, we performed a gene enrichment analysis. This revealed a statistically highly significant (P = .0045, Fisher’s exact test) enrichment of mitochondrial proteins within the set of potential interactors. Validation experiments for 1 mitochondrial (GBAS) and 1 nonmitochondrial identified protein (TMEM160) confirmed an interaction by coimmunoprecipitation followed by immunoblot analysis (Figure 3G). Strikingly, we found an enrichment of every single detected mitochondrial protein upon inhibition of autophagic degradation by BafA (Figure 3E). However, levels of nonmitochondrial proteins interacting with p62 did not alter in 50% of the cases or were found to be reduced, indicating autophagy-independent degradation (Figure 3F). We confirmed that the translocation of p62 to mitochondria occurs and accumulates after blocking lysosomal degradation by subcellular fractionation and isolation of the mitochondrial fraction (Figure 3H).
![Figure 3. TMT-based p62 interactome analysis demonstrates binding of p62 to mitochondria in leukemia cells. (A) Experimental scheme. (B) Identification of interactors by quantification of proteins in WT samples compared with a p62−/− cell line as control. Fold change (FC) [log2] is plotted against corrected P values (Benjamini Hochberg, FDR 0.05). Significant hits (P values <.05 and FC >0.5 log2) are separated by dotted lines. Significantly enriched proteins are considered interactors. (C) Volcano plot as in panel B with all identified mitochondrial proteins is indicated in red. (D) Venn diagram demonstrating the distribution of mitochondrial and nonmitochondrial proteins enriched by p62 immunoprecipitation. (E) Heat map of all identified mitochondrial interactors, with scaled intensities per protein across all replicates and treatments. (F) Heat map of interactors not localizing to mitochondria with scaled intensities for all replicates and treatments. (G) Coimmunoprecipitation validation of interaction between p62 and identified interactors in steady state and after 3 hours of treatment with 100 nM BafA. Lysates were analyzed by western blotting for p62, mitochondrial interactor GBAS, and nonmitochondrial interactor TMEM160. Total cell lysate (TCL) was used as an expression control. (H) Mitochondrial fractions were isolated from WT and p62−/− MN1-driven ldMBM leukemia cells. Lysates from mitochondria (MT) and TCL were analyzed by western blotting for p62 and mitochondrial marker VDAC1, COXIV. β-Actin served as a loading control. Experiments (G-H) were performed in triplicate. IgG, immunoglobulin G.](https://ash.silverchair-cdn.com/ash/content_public/journal/blood/133/2/10.1182_blood-2018-02-833475/7/m_blood833475f3.png?Expires=1765896653&Signature=PIXDysENoELfoifG4gHLDZlsOUAqToqTydm2ohCI6Xnk1Su47pFp7ZfmHhICMXTH8Pa5CatexpPd-sUcl4q~NZq2SNqCHXpyaaZz7i9lVDRewHMXUxjVePwwd2DQvV0PL2k-dQWTxyPPoncQi09xI60gUVwIrLAEpYBVBLk60jvxumagG9vlybxNqkCdnUY5qzkk0RrkXwEQdr6~2k3FWdaxHQUvrU02nyPoyV2i6URUpkVPjaWWAPCZIeNtlwh1srLlTjB69YdClSWbfOITZ0DP5pVOwMQfG1~cX3yKYj0rnw-Z~xAEqBlsGfcY3ezwx-kXWfzoOHtjvPn2FUTzJA__&Key-Pair-Id=APKAIE5G5CRDK6RD3PGA)
TMT-based p62 interactome analysis demonstrates binding of p62 to mitochondria in leukemia cells. (A) Experimental scheme. (B) Identification of interactors by quantification of proteins in WT samples compared with a p62−/− cell line as control. Fold change (FC) [log2] is plotted against corrected P values (Benjamini Hochberg, FDR 0.05). Significant hits (P values <.05 and FC >0.5 log2) are separated by dotted lines. Significantly enriched proteins are considered interactors. (C) Volcano plot as in panel B with all identified mitochondrial proteins is indicated in red. (D) Venn diagram demonstrating the distribution of mitochondrial and nonmitochondrial proteins enriched by p62 immunoprecipitation. (E) Heat map of all identified mitochondrial interactors, with scaled intensities per protein across all replicates and treatments. (F) Heat map of interactors not localizing to mitochondria with scaled intensities for all replicates and treatments. (G) Coimmunoprecipitation validation of interaction between p62 and identified interactors in steady state and after 3 hours of treatment with 100 nM BafA. Lysates were analyzed by western blotting for p62, mitochondrial interactor GBAS, and nonmitochondrial interactor TMEM160. Total cell lysate (TCL) was used as an expression control. (H) Mitochondrial fractions were isolated from WT and p62−/− MN1-driven ldMBM leukemia cells. Lysates from mitochondria (MT) and TCL were analyzed by western blotting for p62 and mitochondrial marker VDAC1, COXIV. β-Actin served as a loading control. Experiments (G-H) were performed in triplicate. IgG, immunoglobulin G.
TMT-based p62 interactome analysis demonstrates binding of p62 to mitochondria in leukemia cells. (A) Experimental scheme. (B) Identification of interactors by quantification of proteins in WT samples compared with a p62−/− cell line as control. Fold change (FC) [log2] is plotted against corrected P values (Benjamini Hochberg, FDR 0.05). Significant hits (P values <.05 and FC >0.5 log2) are separated by dotted lines. Significantly enriched proteins are considered interactors. (C) Volcano plot as in panel B with all identified mitochondrial proteins is indicated in red. (D) Venn diagram demonstrating the distribution of mitochondrial and nonmitochondrial proteins enriched by p62 immunoprecipitation. (E) Heat map of all identified mitochondrial interactors, with scaled intensities per protein across all replicates and treatments. (F) Heat map of interactors not localizing to mitochondria with scaled intensities for all replicates and treatments. (G) Coimmunoprecipitation validation of interaction between p62 and identified interactors in steady state and after 3 hours of treatment with 100 nM BafA. Lysates were analyzed by western blotting for p62, mitochondrial interactor GBAS, and nonmitochondrial interactor TMEM160. Total cell lysate (TCL) was used as an expression control. (H) Mitochondrial fractions were isolated from WT and p62−/− MN1-driven ldMBM leukemia cells. Lysates from mitochondria (MT) and TCL were analyzed by western blotting for p62 and mitochondrial marker VDAC1, COXIV. β-Actin served as a loading control. Experiments (G-H) were performed in triplicate. IgG, immunoglobulin G.
Taken together, these findings strongly suggest that p62 binding to mitochondria occurs predominantly in an autophagy-dependent way.
Loss of p62 compromises mitochondrial function in leukemia cells
Given the fact that the interactome analysis revealed a predominant interaction of p62 with mitochondria in MN1-driven leukemia cells, we investigated the potential role of mitochondria contributing to the delayed leukemia progression in p62−/− mice (Figure 2B). We found differences in mitochondrial morphology after knockdown of p62 in MN1-driven ldMBM leukemia cells, as mitochondrial network appeared disorganized with increased elongated mitochondria displaying inhomogeneous cristae distribution (supplemental Figure 5A-B).
Next, we investigated the functionality of mitochondria in p62−/− leukemic mice. Severe mitochondrial damage causes increased levels of reactive oxygen species (ROS), which are generated as by-products during mitochondrial oxidative phosphorylation.16 To exclude the possibility that oncogenic stress itself may increase ROS production, we determined ROS levels in MN1 blasts of leukemic mice and their equivalent HSC compartment (LK) in healthy animals. Mitochondrial superoxide levels, the primary and most abundant ROS, were measured by flow cytometry (MitoSOX).17 In the presence of p62, MN1-mediated transformation had no influence on MitoSOX levels, whereas deficiency of p62 led to significant accumulation of mitochondrial superoxide in leukemic mice (Figure 4A). Notably, normal HSCs of p62−/− mice tended toward lower MitoSOX levels than WT mice. As mitochondrial superoxide is normally scavenged by mitochondrial superoxide dismutase, its accumulation can be defined as a surrogate marker for mitochondrial dysfunction. Strikingly, increased MitoSOX levels positively correlated with prolonged survival during leukemia development (Figure 4B). Measuring the mitochondrial OCR as a more precise method to quantify mitochondrial function18 revealed reduced basal and maximal respiratory capacity (Figure 4C-D) in mitochondria from p62−/− blasts. In summary, these data confirm a significantly compromised mitochondrial function in p62−/− MN1-driven leukemia cells. This emphasizes the crucial role of p62 to maintain mitochondrial homeostasis under oncogenic stress.
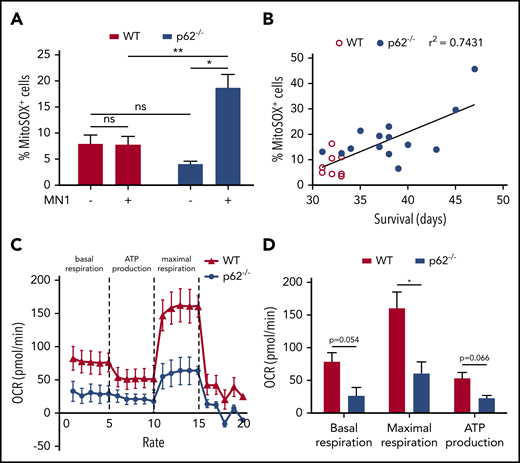
Mitochondrial functions in p62−/−leukemia cells were defective. (A) Mitochondrial superoxide levels of LK HSC cells from healthy mice (n = 3 per group) and GFP+ LK blasts from MN1 leukemic mice (n = 8 in WT and n = 14 in p62−/− leukemic mice) were analyzed by flow cytometry using MitoSOX. (B) Pearson’s correlation was used to determine the correlation between the proportions of MitoSOX+ leukemic cells with the survival time of leukemic mice. (C) Mitochondrial respiration of WT and p62−/− MN1 leukemic mice (n = 3 per group) was determined by measuring the OCR. The experiment was performed in real time by the 96-well Seahorse Bioscience Extracellular Flux Analyzer XF96. (D) The rates of basal respiration, maximal respiration, and adenosine triphosphate (ATP) production were compared between WT and p62−/− group (n = 3 per group). Values are mean ± SEM. ns, not significant; *P ≤ .05; **P ≤ .01; ***P ≤ .001.
Mitochondrial functions in p62−/−leukemia cells were defective. (A) Mitochondrial superoxide levels of LK HSC cells from healthy mice (n = 3 per group) and GFP+ LK blasts from MN1 leukemic mice (n = 8 in WT and n = 14 in p62−/− leukemic mice) were analyzed by flow cytometry using MitoSOX. (B) Pearson’s correlation was used to determine the correlation between the proportions of MitoSOX+ leukemic cells with the survival time of leukemic mice. (C) Mitochondrial respiration of WT and p62−/− MN1 leukemic mice (n = 3 per group) was determined by measuring the OCR. The experiment was performed in real time by the 96-well Seahorse Bioscience Extracellular Flux Analyzer XF96. (D) The rates of basal respiration, maximal respiration, and adenosine triphosphate (ATP) production were compared between WT and p62−/− group (n = 3 per group). Values are mean ± SEM. ns, not significant; *P ≤ .05; **P ≤ .01; ***P ≤ .001.
Loss of p62 in murine MN1-driven leukemia cells impairs mitophagy in a PINK1/Parkin-independent manner
As our data demonstrated that loss of p62 caused accumulation of dysfunctional mitochondria, we hypothesized that p62 may be required for mitochondrial degradation by mitophagy. Mitochondrial membrane depolarization after treatment with the uncoupler carbonyl cyanide m-chlorophenyl hydrazine, frequently used to induce PINK1/Parkin-dependent mitophagy, showed no degradation of the inner mitochondrial membrane protein COXIV in MN1-driven leukemia cells (supplemental Figure 6B).5 This suggests that endogenous Parkin is not sufficient to induce mitophagy.19 To avoid Parkin overexpression, we triggered PINK1/Parkin-independent mitophagy by mitochondrial damage with the iron chelator deferiprone (DFP).20 After DFP treatment, COXIV was degraded in shCtrl cells but not in shp62 cells (Figure 5A-B). This was followed by transcriptional upregulation of p62 upon DFP treatment (supplemental Figure 6A). Knockdown of p62 in MN1-driven leukemia cells had no effect on DFP-induced autophagic flux as LC3-II turnover remained unchanged (supplemental Figure 6C-E), whereas blocking DFP-induced autophagosomal degradation with BafA inhibited mitochondrial degradation only in the presence of p62 (supplemental Figure 6C-D).

Impaired mitophagy in leukemia cells after loss of p62. (A) shCtrl and shp62 MN1-driven ldMBM leukemia cells were treated for 12 hours with 1 mM DFP. Lysates were analyzed by western blotting for the inner mitochondrial protein COXIV and the outer mitochondrial protein Tom20 and the autophagic markers p62 and LC3. β-Actin served as a loading control. (B) Quantification of remaining protein expression after 12 hours of treatment with DFP of mitochondrial proteins Tom20 and COXIV compared with 0 hours using density analysis of western blots (n = 3 independent experiments). (C) Immunofluorescent staining of shCtrl and shp62 MN1-driven ldMBM leukemia cells after 12 hours of treatment with 1 mM DFP was performed with the mitochondrial and autophagic markers Tom20 and LC3, respectively. Arrows indicate colocalization of both markers. Tom20 and LC3 were immunostained with fluorescent dyes Alexa Fluor 647 and Alexa Fluor 593, respectively. DAPI (4′,6-diamidino-2-phenylindole) was used as a nuclear stain. Scale bar = 5 µm. Original magnification ×63. (D) Colocalization of Tom20 and LC3 was analyzed by ImageJ (n = 50 for each group). (E) Immunofluorescent staining of shCtrl and shp62 MN1-driven ldMBM leukemia cells after 12 hours of treatment with 1 mM DFP was performed with the mitochondrial and lysosomal markers Tim23 and Lamp1, respectively. Arrows indicate colocalization of both markers. Tim23 and Lamp1 were immunostained with fluorescent dyes Alexa Fluor 647 and Alexa Fluor 593, respectively. SYTOX green was used as a nuclear stain. Scale bar = 5 µm. Original magnification ×63. (F) Colocalization of Tom20 and Lamp1 was analyzed by ImageJ (n = 50 for each group). Values are means ± SEM. *P ≤ .05; **P ≤ .01; ***P ≤ .001.
Impaired mitophagy in leukemia cells after loss of p62. (A) shCtrl and shp62 MN1-driven ldMBM leukemia cells were treated for 12 hours with 1 mM DFP. Lysates were analyzed by western blotting for the inner mitochondrial protein COXIV and the outer mitochondrial protein Tom20 and the autophagic markers p62 and LC3. β-Actin served as a loading control. (B) Quantification of remaining protein expression after 12 hours of treatment with DFP of mitochondrial proteins Tom20 and COXIV compared with 0 hours using density analysis of western blots (n = 3 independent experiments). (C) Immunofluorescent staining of shCtrl and shp62 MN1-driven ldMBM leukemia cells after 12 hours of treatment with 1 mM DFP was performed with the mitochondrial and autophagic markers Tom20 and LC3, respectively. Arrows indicate colocalization of both markers. Tom20 and LC3 were immunostained with fluorescent dyes Alexa Fluor 647 and Alexa Fluor 593, respectively. DAPI (4′,6-diamidino-2-phenylindole) was used as a nuclear stain. Scale bar = 5 µm. Original magnification ×63. (D) Colocalization of Tom20 and LC3 was analyzed by ImageJ (n = 50 for each group). (E) Immunofluorescent staining of shCtrl and shp62 MN1-driven ldMBM leukemia cells after 12 hours of treatment with 1 mM DFP was performed with the mitochondrial and lysosomal markers Tim23 and Lamp1, respectively. Arrows indicate colocalization of both markers. Tim23 and Lamp1 were immunostained with fluorescent dyes Alexa Fluor 647 and Alexa Fluor 593, respectively. SYTOX green was used as a nuclear stain. Scale bar = 5 µm. Original magnification ×63. (F) Colocalization of Tom20 and Lamp1 was analyzed by ImageJ (n = 50 for each group). Values are means ± SEM. *P ≤ .05; **P ≤ .01; ***P ≤ .001.
In addition, we assessed mitophagy at various stages by quantitative fluorescence microscopy. Early stage of mitophagy was monitored by colocalization of mitochondrial markers with the autophagosomal marker LC3, and late stage was detected by colocalization with the lysosomal marker Lamp1.21 Knockdown of p62 significantly reduced LC3 recruitment to mitochondria (Figure 5C-D; supplemental Figure 6F-G) and mitochondrial-lysosomal colocalization (Figure 5E-F) after DFP treatment, indicating impaired autophagic clearance of dysfunctional mitochondria.
The autophagy-dependent function of p62 is essential for efficient cell proliferation and mitophagy
As p62 is a multifunctional protein, we asked whether its autophagy-mediating LC3-interacting region (LIR) or its clustering-domain (PB1) is crucial for cell growth and mitophagy in MN1-driven leukemia cells. Therefore, p62 WT and p62 mutants ΔLIR (deletion of 11 amino acids S334-S344) and K7A/D69A of the PB1 domain22 were reexpressed in shp62 cells. Western blot analysis demonstrated that reexpression of p62 WT in shp62 cells restored endogenous protein levels, whereas expression levels of both p62 mutants were significantly elevated, suggesting their stabilization and impaired degradation (Figure 6D). Despite increased expression levels of both p62 mutants, only p62 WT was able to fully rescue cell growth and colony-forming ability (Figure 6A-C). Importantly, p62 ΔLIR reduced cell growth and colony-forming ability to the same extent as knockdown of p62; however, p62 K7A/D69A displayed an intermediated phenotype.

Reintroduction of WT p62 can rescue the phenotype, but not the ΔLIR mutant of p62. (A) Expansion analysis of shCtrl (+ mock), shp62 (+ mock), and shp62 (+ p62 WT, p62 ΔLIR, and p62 K7A/D69A) transduced MN1-driven ldMBM leukemia cells were performed by seeding 104 cells and counting live cells (by Trypan blue exclusion) at the indicated time points (n = 3 in triplicate). (B) Colony numbers and (C) cell numbers were determined in colony-forming unit assays of shCtrl, shp62, and p62 mutants transduced MN1-driven leukemia cells (n = 3 in triplicate, each with 500 cells). (D) shCtrl, shp62, and p62 mutants transduced MN1-driven leukemia cells were treated for 12 hours with 1 mM DFP. Lysates were analyzed by western blotting for the inner mitochondrial protein COXIV and p62. β-Actin served as a loading control. (E) Quantification of remaining protein expression after 12 hours of treatment with DFP of mitochondrial protein COXIV compared with 0 hours using density analysis of western blots (n = 3 independent experiments). (F) Colocalization of mitochondrial (Tom20) and autophagic (LC3) marker after treatment with 1 mM DFP in shCtrl, shp62, and p62 mutants transduced MN1-driven leukemia cells was visualized by immunofluorescent staining. Arrows indicate colocalization of both markers. Tom20 and LC3 were immunostained with fluorescent dyes Alexa Fluor 647 and Alexa Fluor 593, respectively. DAPI (4′,6-diamidino-2-phenylindole) was used as a nuclear counterstain. Scale bar = 5 µm. Original magnification ×63. (G) Colocalization of Tom20 and LC3 was analyzed by ImageJ (n = 50 for each group). Values are means ± SEM. ns, not significant; *P ≤ .05; **P ≤ .01; ***P ≤ .001.
Reintroduction of WT p62 can rescue the phenotype, but not the ΔLIR mutant of p62. (A) Expansion analysis of shCtrl (+ mock), shp62 (+ mock), and shp62 (+ p62 WT, p62 ΔLIR, and p62 K7A/D69A) transduced MN1-driven ldMBM leukemia cells were performed by seeding 104 cells and counting live cells (by Trypan blue exclusion) at the indicated time points (n = 3 in triplicate). (B) Colony numbers and (C) cell numbers were determined in colony-forming unit assays of shCtrl, shp62, and p62 mutants transduced MN1-driven leukemia cells (n = 3 in triplicate, each with 500 cells). (D) shCtrl, shp62, and p62 mutants transduced MN1-driven leukemia cells were treated for 12 hours with 1 mM DFP. Lysates were analyzed by western blotting for the inner mitochondrial protein COXIV and p62. β-Actin served as a loading control. (E) Quantification of remaining protein expression after 12 hours of treatment with DFP of mitochondrial protein COXIV compared with 0 hours using density analysis of western blots (n = 3 independent experiments). (F) Colocalization of mitochondrial (Tom20) and autophagic (LC3) marker after treatment with 1 mM DFP in shCtrl, shp62, and p62 mutants transduced MN1-driven leukemia cells was visualized by immunofluorescent staining. Arrows indicate colocalization of both markers. Tom20 and LC3 were immunostained with fluorescent dyes Alexa Fluor 647 and Alexa Fluor 593, respectively. DAPI (4′,6-diamidino-2-phenylindole) was used as a nuclear counterstain. Scale bar = 5 µm. Original magnification ×63. (G) Colocalization of Tom20 and LC3 was analyzed by ImageJ (n = 50 for each group). Values are means ± SEM. ns, not significant; *P ≤ .05; **P ≤ .01; ***P ≤ .001.
Next, we identified both p62 mutants to display an impaired mitochondrial degradation (Figure 6D-E). Strikingly, restoration of p62-WT and the p62-K7A/D69A mutant fully rescued the colocalization of LC3 and Tom20 upon DFP treatment from 55% back to 80% and 76%, respectively. In contrast, the p62-ΔLIR mutant failed to rescue LC3 recruitment to mitochondria, as colocalization remained at 57% (Figure 6F-G). These results strongly suggest that impaired proliferation in p62−/− leukemia cells is mainly autophagy-dependent and involves mitophagy.
Discussion
This study identifies the selective autophagy receptor p62 as a key component required for rapid leukemia development and progression. By using 2 murine AML models, we demonstrated that loss of p62 reduced proliferation of leukemia cells and delayed leukemia development in mice, most likely due to impaired mitochondrial function and altered energy homeostasis. In agreement with this, high p62 messenger RNA expression was associated with poor prognosis in human AML. Importantly, our results show that p62 is required for mitophagic clearance and maintenance of mitochondrial respiration. Thus, our findings highlight the prominent role of selective autophagy in leukemia development and its importance in maintaining mitochondrial integrity by mitophagy.
Numerous recent studies have underlined the particular relevance of bulk autophagy in leukemia; however, there are inconsistencies regarding its contribution to different stages of leukemia development. It has been shown that autophagy protects murine HSCs from metabolic stress to sustain HSC function and to prevent leukemic transformation.1,23,24 Furthermore, a whole exome sequencing analysis on human AML samples revealed genetic aberrations in autophagy genes (including p62) in 14% of the cases studied, suggesting that a defective autophagy machinery may be implicated in human leukemia development.25 On the contrary, it has been demonstrated that autophagy is activated during transformation from HSCs to LICs26 and established leukemia requires autophagy for its maintenance, as knockdown of ATG3 (an essential autophagy protein) impaired BCR-ABL–mediated chronic myeloid leukemia.27 Similarly, we documented that transformation of murine stem cells with different oncogenes (MN1, Hoxa9/Meis1) caused increased autophagic flux. Furthermore, Sumitomo and colleagues were able to prove that autophagy is essential for maintenance of LICs, as loss of ATG5 or ATG7 prolonged survival in leukemic mice by reducing functional LICs.28 These findings have been challenged, however, as others have demonstrated that ATG7 is not required for LIC function.26,29 So far, no data on the requirement of selective autophagy in leukemia are available.
Quality control is an important function of selective autophagy to protect normal and malignant cells from oxidative and genotoxic stress, including the efficient removal of dysfunctional mitochondria by mitophagy. Conditions that impair selective autophagy have been proposed to promote mutagenesis and cancer initiation.30,31 However, the exact role of selective autophagy in cancer remains elusive. In line with others, we found no influence of the selective autophagy receptor p62 on normal HSC function.32,33 We show that in the context of leukemia, deficiency of p62 impaired cell growth of leukemia cells and delays leukemia development in mice, implying that loss of p62 compromises cellular homeostasis of leukemic cells under oncogenic stress. Similar findings were observed in colorectal cancer, where p62 was highly expressed and its knockdown inhibited tumor growth in vitro and in a xenograft tumor model.34 Moreover, it has recently been demonstrated that p62 loss in an mTORC1-dependent renal cancer model reduced cystadenoma formation.35 These data suggest that p62 appears to be critical for oncogene-driven tumorigenesis. Notably, the underlying mechanism proposed by Lam et al includes glutathione production that altered mitochondrial integrity. This was reflected by reduced maximal respiration, increased mitochondrial ROS, and upregulation of the mitophagy marker PINK1, indicating that impaired autophagy due to loss of p62 provoked accumulation of damaged mitochondria.35
Previous studies have claimed an important role of p62 in mitochondrial dynamics as deficiency of p62 impairs mitochondrial structure and function.36,37 Similarly, we observed that p62 knockdown in MN1 leukemia cells revealed considerable differences in mitochondrial morphology with elongated mitochondria showing disorganized cristae structures. Disturbance of mitochondrial dynamics causing either mitochondrial elongation or excessive mitochondrial fragmentation is correlated with loss of membrane potential, an indicator for mitochondrial dysfunction.38 In line with this, we found increased mitochondrial ROS levels and reduced mitochondrial respiration capacity, both being evidence of mitochondrial dysfunction in leukemia cells of p62−/− mice. Although cancer cells frequently generate higher ROS levels than healthy cells,39 we found an almost equal amount of mitochondrial ROS in MN1 leukemia cells and their comparable HSC compartment in normal hematopoiesis. Moreover, HSCs of p62−/− mice tended to display even lower mitochondrial ROS levels than HSCs from WT mice. This suggests that only under oncogenic stress conditions do HSCs depend on p62 to maintain mitochondrial homeostasis.
Selective degradation of mitochondria by autophagy, known as mitophagy, is a cellular quality control mechanism necessary to remove dysfunctional mitochondria.40 Growing lines of evidence link p62 to clustering of ubiquitinated mitochondria via its UBA domain and polymerization via its PB1 domain,41-43 thereby implicating its importance in mitophagy.5,44-47 Here, we found (i) that translocation of p62 to mitochondria occurs and accumulates after inhibition of the autophagic degradation pathway, and (ii) that blocking lysosomal degradation causes enrichment of all detected mitochondrial candidates identified by our interactome analysis. Whether mitochondrial interaction with p62 occurred in an ubiquitin-dependent manner remains unclear and requires further investigation.
It has been shown that mitophagy can involve the mitochondrial protein kinase PINK1 and the ubiquitin ligase Parkin, suggesting that the autophagy receptors Optineurin and NDP52, but not p62, are required for PINK1/Parkin-mediated mitophagy.44,46 However, these studies focus solely on a particular type of mitophagy depending on Parkin overexpression, as it has been shown that endogenous Parkin is not sufficient to induce mitophagy.19 In contrast, we demonstrated here an important role of p62 in PINK1/Parkin-independent mitophagy in MN1-driven leukemia cells by inducing iron loss. We and others found that p62 was upregulated after triggering PINK1/Parkin-independent mitophagy.20 We show that loss of p62 in MN1-driven leukemia cells impaired mitochondrial degradation by mitophagy. Interestingly, p62-mediated mitochondrial ubiquitination has recently been described as an additional p62 function in Parkin-independent mitophagy in fatty liver disease.48 Importantly, we showed that LIR-dependent binding of p62 to autophagosomes is required for effective mitochondrial degradation by mitophagy. However, we noted that the p62-K7A/D69A mutant was also able to recruit mitochondrial proteins to LC3 (Figure 6F), but failed to efficiently degrade these (Figure 6D), resulting in impaired cell proliferation (Figure 6A). This can be attributed to the fact that p62-K7A/D69A disrupts self-oligomerization, which is required for the degradation of large structures such as mitochondria by selective autophagy.49
Mounting evidence suggests the clinical significance of mitochondria in AML progression, and several mitochondria-targeting drugs are under investigation for the treatment of AML.50,51 Furthermore, it has recently been demonstrated that AMPK1/FIS1-mediated mitophagy is required to maintain a healthy mitochondrial network, which in turn is essential to preserve stemness in LICs.52 This concept is consistent with our in vivo data showing that attenuated disease progression in p62−/− leukemic mice was characterized by increased frequency of LICs with reduced colony-forming ability, increased mitochondrial ROS production (Figure 4A), and impaired mitochondrial respiration (Figure 4C-D), suggesting that accumulation of dysfunctional mitochondria delayed leukemia development.
The open question remains to what extent p62 contributes to leukemogenesis in addition to its role in mitophagy. For instance, p62 modulates the NF-kB pathway by binding to RIP1 and TRAF6,8 whereas chronic NF-kB activity was shown to be essential for maintenance of LICs.53 Future studies with p62 mutants will be required to dissect which domains affect relevant signaling pathways in leukemia.
In conclusion, our data demonstrate for the first time the fundamental role of selective autophagy as a quality control mechanism in leukemia progression (schematic diagram in Figure 7). Loss of a single autophagy receptor, namely p62, failed to protect HSCs from oncogenic stress, causing ineffective elimination of damaged mitochondria and accumulation of mitochondrial superoxide. Subsequently, this impairs survival of leukemia cells and delays leukemia progression. Furthermore, our data demonstrate the prominent role of p62-mediated selective autophagy in leukemogenesis as reexpression of a p62 mutant unable to bind autophagosomes failed to restore cell proliferation and mitophagy. These findings provide a mechanism-based rationale for the development of drugs targeting selective autophagy in leukemia.
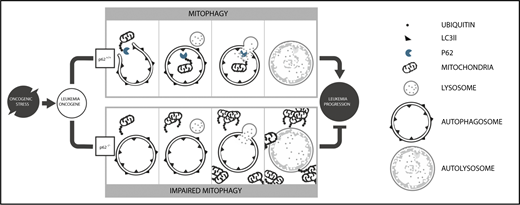
Model of p62-mediated mitophagy in AML development. Under oncogenic stress, p62 is required for (i) efficient removal of damaged mitochondria by mitophagy and (ii) rapid leukemia progression (upper). In the absence of p62, damaged mitochondria accumulate, leading to impaired mitochondrial function and reduced leukemia progression (lower).
Model of p62-mediated mitophagy in AML development. Under oncogenic stress, p62 is required for (i) efficient removal of damaged mitochondria by mitophagy and (ii) rapid leukemia progression (upper). In the absence of p62, damaged mitochondria accumulate, leading to impaired mitochondrial function and reduced leukemia progression (lower).
The online version of this article contains a data supplement.
The publication costs of this article were defrayed in part by page charge payment. Therefore, and solely to indicate this fact, this article is hereby marked “advertisement” in accordance with 18 USC section 1734.
Acknowledgments
The authors thank Katja Jakobi and Astrid Eichler for excellent assistance in animal experiments and Tobias Berg for sharing the pSF91-MN1 vector. The authors acknowledge the Electron Microscopy Core facility at EMBL Heidelberg for their technical support.
This work was supported by the Deutsche Forschungsgemeinschaft grant SFB1177 (C.H.B.), German Cancer Consortium (S.S. and C.H.B.), Deutsche José Carreras Leukämie-Stiftung R14/14 (S.S. and C.H.B.), and the Else Kröner-Forschungskolleg (S.S.).
Authorship
Contribution: T.D.N., S.S., and C.H.B. designed the experiments and analyzed the data; T.D.N., S.S., O.V., S.E.K., D.S., M.T., F.B., K.K., C.M., I.H., S.E., and A.D. performed the experiments; T.D.N., S.S., O.V., S.E.K., J.Z., T.O., H.D.O., S.E., C.B., C.M., I.D., and C.H.B. discussed the results; and T.D.N., S.S., and C.H.B. wrote the manuscript.
Conflict-of-interest disclosure: The authors declare no competing financial interests.
Correspondence: Christian H. Brandts, Department of Medicine, Hematology/Oncology, University Cancer Center Frankfurt, Goethe University, Theodor-Stern-Kai 7, D-60590 Frankfurt, Germany; e-mail: brandts@em.uni-frankfurt.de.

This feature is available to Subscribers Only
Sign In or Create an Account Close Modal