

On page 173 in the 10 January 2019 issue, in each pair of bars in Figure 4D, the left bar (wild type [WT]) should be red and the right bar (p62−/−) should be blue. The corrected Figure 4 is shown below. The error has been corrected in the online version of the article.
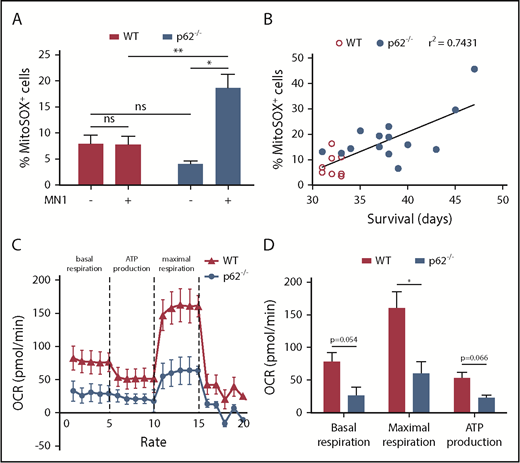
Mitochondrial functions in p62−/−leukemia cells were defective. (A) Mitochondrial superoxide levels of LK HSC cells from healthy mice (n = 3 per group) and GFP+ LK blasts from MN1 leukemic mice (n = 8 in WT and n = 14 in p62−/− leukemic mice) were analyzed by flow cytometry using MitoSOX. (B) Pearson’s correlation was used to determine the correlation between the proportions of MitoSOX+ leukemic cells with the survival time of leukemic mice. (C) Mitochondrial respiration of WT and p62−/− MN1 leukemic mice (n = 3 per group) was determined by measuring the OCR. The experiment was performed in real time by the 96-well Seahorse Bioscience Extracellular Flux Analyzer XF96. (D) The rates of basal respiration, maximal respiration, and adenosine triphosphate (ATP) production were compared between WT and p62−/− group (n = 3 per group). Values are mean ± SEM. ns, not significant; *P ≤ .05; **P ≤ .01; ***P ≤ .001.
Mitochondrial functions in p62−/−leukemia cells were defective. (A) Mitochondrial superoxide levels of LK HSC cells from healthy mice (n = 3 per group) and GFP+ LK blasts from MN1 leukemic mice (n = 8 in WT and n = 14 in p62−/− leukemic mice) were analyzed by flow cytometry using MitoSOX. (B) Pearson’s correlation was used to determine the correlation between the proportions of MitoSOX+ leukemic cells with the survival time of leukemic mice. (C) Mitochondrial respiration of WT and p62−/− MN1 leukemic mice (n = 3 per group) was determined by measuring the OCR. The experiment was performed in real time by the 96-well Seahorse Bioscience Extracellular Flux Analyzer XF96. (D) The rates of basal respiration, maximal respiration, and adenosine triphosphate (ATP) production were compared between WT and p62−/− group (n = 3 per group). Values are mean ± SEM. ns, not significant; *P ≤ .05; **P ≤ .01; ***P ≤ .001.

This feature is available to Subscribers Only
Sign In or Create an Account Close Modal