

Key Points
Lentiviral Epcr expression rescued phenotypic LT-HSCs in the model of Mpl-deficient aplastic anemia.
Lineage marker–negative, Epcr+ BM cells comprise the population with engraftment potential.

Abstract
Thrombopoietin (Thpo)/myeloproliferative leukemia virus oncogene (Mpl) signaling controls hematopoietic stem cell (HSC) self-renewal and quiescence; however, how these 2 seemingly opposing functions are controlled is not well understood. By transplantation of lentiviral-transduced hematopoietic cells in the Mpl-deficient mouse model, we addressed whether known or predicted Thpo target genes were able to rescue the Mpl-deficient phenotype of the mice. Among the tested genes, we identified endothelial protein C receptor (Epcr) to expand HSCs with the long-term (LT)-HSC surface phenotype in Mpl−/− mice and to enable secondary transplantation of Mpl-deficient bone marrow (BM). Epcr-transduced Mpl−/− HSCs enter quiescence earlier after transplantation than control-transduced Mpl−/− cells, and upregulated expression of the anti-apoptotic gene Bcl-xL. Also, in the wild-type background, Epcr expression marked the engrafting population in the BM. Furthermore, Epcr expression in Mpl−/− hematopoiesis increased the number of megakaryocytes in the BM. In vitro Thpo supported the surface expression of Epcr on primary murine hematopoietic stem and progenitor cells. With these data, we add new insights into Thpo-dependent influence on HSC engraftment after transplantation. This may be of use for the in vitro manipulation of HSCs, also in the context of gene therapy.
Introduction
Hematopoietic stem cells (HSCs) give rise to all blood cells and reside on top of the hematopoietic hierarchy. They are limited in number and located in defined spatial and microenvironmental bone marrow (BM) niches in adult mammals. To maintain their number and potential throughout life, HSCs persist mainly in quiescence and have the ability to self-renew or, in case of activation, to differentiate.
Self-renewal and differentiation of HSCs are guided by their environment and soluble factors including cytokines. One of the cytokines is thrombopoietin (THPO), which signals through its receptor myeloproliferative leukemia virus oncogene (MPL).1-3 MPL is expressed on long-term (LT) repopulating HSCs, megakaryocyte (MK) progenitors, mature MKs, and platelets.4,5 In megakaryopoiesis, THPO induces MK differentiation, proliferation, and maturation, but not platelet release.6 In addition, THPO/MPL signaling not only supports HSC proliferation and self-renewal during regenerative processes,7 but also fosters HSC quiescence during steady-state hematopoiesis.8,9 How these 2 at-first-glance opposing functions are controlled by the same cytokine/receptor signaling may be dose and context dependent, but remains mainly elusive.10
THPO binding induces MPL homodimerization, allowing cross-phosphorylation of the bound JAK2.11 Phospho-JAK2 phosphorylates tyrosine residues at the distal intracellular part of MPL, which then bind and activate STAT3/5-, phosphatidylinositol 3-kinase (PI3K)-, and RAS/MAPK-signaling proteins. Activating mutations of MPL induce myeloproliferative neoplasms.12 In contrast, inactivating mutations in MPL cause thrombocytopenia and aplastic anemia, an inherited genetic disorder named congenital amegakaryocytic thrombocytopenia.13 Our knowledge on regulation of HSC quiescence, self-renewal, and megakaryopoiesis is based on studies in Mpl−/− or Thpo−/− mouse models, mimicking the human phenotype considerably well.14,15 The BM of Mpl−/− mice contains reduced numbers of HSCs with lower repopulation potential after transplantation, ∼50% of colony-forming progenitors, and a 10-fold reduction in colony-forming unit–spleen–forming potential.16 MKs are less mature and platelet counts in Mpl−/− mice ∼10% of normal levels.14 As THPO/MPL signaling can increase platelet counts in vivo, THPO mimetics have been used in the clinics for the treatment of thrombocytopenia.17 More recently, THPO mimetics have also been applied to patients with aplastic anemia or myelodysplasia aiming to activate remaining HSCs to regenerate the dysplastic or aplastic hematopoiesis.18,19
In our project, we aim to dissect the role of THPO/MPL signaling in HSCs by investigating its potential downstream targets in the Mpl-deficient model. Based on gene-expression analysis in regenerated or aplastic HSCs in several mouse models, we selected genes differentially expressed in HSCs in response to Thpo. We postulate that lentiviral expression of Thpo/Mpl-signaling–related genes in Mpl−/− HSCs would increase HSC numbers in Mpl-deficient mice. For genetic modification of hematopoiesis, mice underwent BM stem cell transplantation with lentiviral-transduced BM cells.
Among the 5 tested genes, we identified endothelial protein C receptor (Epcr) to enhance early engraftment after transplantation, to increase the number of cells with LT-HSC surface phenotype in the BM, and to enable secondary engraftment in the Mpl-deficient model. Epcr binds activated protein C (aPC) and signals via the protease-activated receptor 1 (Par-1) on HSCs. Epcr has been associated with increased HSC retention in the BM.20 Furthermore, we show that Epcr expression on HSCs is supported by Thpo in vitro.
Materials and methods
Animals
Animal experiments were approved by the local ethical committees (regional authority in Hessen, Germany) and performed according to their guidelines. All mice were bred and kept in the specified pathogen-free animal facilities of the Paul Ehrlich Institute. To circumvent infection-associated complications after irradiation, antibiotic was supplied (ciprofloxacin 0.1 mg/mL in drinking water). C57BL/6J (B6.Ly5.2) and C57BL/6 PeP3b (B6 SJL/Ly5.1) mice were obtained from Janvier/Charles River. Mpl−/− mice were kindly provided by W. Alexander (Walter and Eliza Hall Institute [WEHI], Melbourne, VIC, Australia).14 Thpo−/− mice were obtained from F. de Sauvage (Genentech Inc., South San Francisco, CA).15
Lentiviral vector generation
The complementary DNA (cDNA) clones of Pbx1 (BC058390), Fzd4 (BC015256), Hoxa10 (BC050839), Epcr (Procr; CD201, BC028755), and Mycn (BC005453) were obtained from GenScript or Harvard Medical School plasmid depository. After polymerase chain reaction (PCR) amplification, the coding sequences of the cDNA clones were inserted into the lentiviral vector RRL.PPT.pre*.21 Expression was driven by the human phosphoglycerate kinase (PGK) promoter. The enhanced green fluorescent protein (eGFP) sequence was coupled to the gene of interest (GOI) using an internal ribosomal entry site (IRES). The obtained cDNA of Epcr was corrected by the addition of the respective transmembrane domain (LVLGILMGCFIIAGVAVGIFM). All constructs were verified by restriction digest and Sanger sequencing.
Production of viral vectors and titers
Vectors were produced in 293T cells by cotransfection of the plasmids for the transfer vector, the lentiviral-gag/pol (pcDNA3.GP.4xCTE), lentiviral-Rev (pRSV-REV), and VSV-G envelope protein (pMD.G) using the calcium phosphate transfection method. Viral supernatants were collected 36 and 48 hours posttransfection, filtered through a 0.22-µm MillexGP filter unit (Merck Millipore) and spun at 50 000g for 1.5 hours for concentration. Viral vector titers were determined by transduction of murine fibroblasts.
Isolation, transduction, and transplantation of BM cells
BM cells were flushed from femurs, tibias, and hips of either Mpl−/− (CD45.2) or C57BL/6 donor mice. Lineage-marker–negative (lin−) cells were isolated by magnetic cell sorting using lineage-specific antibodies (GR1, CD11b, CD45R/B220, CD3e, TER-119; Miltenyi Biotec). Prior to viral transduction, lin− BM cells were prestimulated for 24 hours in StemSpan (StemCell Technologies), supplemented with 10 ng/mL murine stem cell factor (SCF), 20 ng/mL murine Thpo, 10 ng/mL murine fibroblast growth factor 1 (FGF-1), 20 ng/mL human insulin-like growth factor 2 (IGF2), 1% penicillin/streptomycin, 2 mM glutamine. lin− cells were transduced twice on 2 following days with a multiplicity of infection of 5 or 10 with lentiviral vectors on retronectin-coated and preloaded wells (10 µg/cm2). On day 4 after isolation, a minimum of 5 × 10⁵ cells per mouse were IV injected into irradiated (6 Gy, 137Cs-γ rays, 0.036 Gy/s) Mpl−/− (CD45.1) or (8 Gy) C57BL/6 recipient mice. For secondary transplantation, 107 freshly isolated total BM cells were transplanted into irradiated Mpl−/− (CD45.1) mice with 1 donor for each recipient.
Blood and BM cell analysis by flow cytometry
Blood samples of transplanted mice were collected via retro-orbital bleeding. Blood cell counts were determined using the VetABC hemocytometer (SCIL Animal Care Company, Viernheim, Germany). Fc-receptor–blocked peripheral blood (PB) leukocytes (anti-CD16/32 antibody) were stained for the chimerism (CD45.2-phycoerythrin [PE], CD45.1-allophycocyanin [APC]), T and B cells (CD3-APC, B220–peridinin chlorophyll protein [PerCP]), myeloid cells (CD11b-APC, Gr-1–PerCP). BM cells were harvested from femurs, tibias, and hips and stained for stem and progenitor cell populations (lineage marker–Pacific Blue, Sca-1–PerCP–Cy5.5, c-Kit–APC, CD16/32-APC-Cy7, CD34-PE-Cy7, CD135-PE, CD45.2-BV605), LT-HSCs (lineage marker–Pacific Blue, Sca-1–PerCP–Cy5.5, c-Kit–APC, CD48-APC-Cy7, CD150 [signaling lymphocyte activation molecule (SLAM)]-PE-Cy7, CD201 [Epcr]-PE, CD45.2-BV605), and cell-cycle status (lineage marker–BV605, Sca-1–BV510, c-Kit–BV421, CD34-eF660, CD48-AF700, CD150 [SLAM]-PE, Ki-67–PE–Cy7, 7-aminoactinomycin D [7-AAD]). Antibodies were purchased from BioLegend or eBioscience. Mpl expression was detected with anti-Mpl (AMM2)-biotin (IBL America). Blood and BM cells were analyzed on an Accuri C6 (BD), Cytoflex (Beckman Coulter), and an LSRII flow cytometer (BD) or Aria Fusion cell sorter (BD).
Fluorescence-activated cell sorting
For expression analysis in stem and progenitor cells, BM cells of transplanted Mpl−/− mice or untransplanted C57BL/6 mice were stained as described and sorted for lin−, Sca1+, and cKit+ (LSK), lin−cKit+ (LK)–common myeloid progenitor (CMP), LK–granulocyte/macrophage progenitor (GMP), LK–megakaryocytic/erythroid progenitor (MEP) phenotypes directly into RNAzol. RNA was isolated using the Direct-zol RNA MicroPrep kit (Zymo Research) and reverse transcribed and amplified with the Ovation PicoSL WTA System V2 kit (NuGen). BM cells from C57BL/6 mice were stained for lineage marker, Sca-1, c-Kit, and CD201 (Epcr), and lin−Epcr− or lin−Epcr+ were sorted. Sorted cells were directly transplanted into lethally irradiated mice without competitor cells.
Quantitative PCR
The cDNA of the different stem and progenitor cell populations was used to analyze the expression of the GOIs (Pbx1, Fzd4, Hoxa10, Epcr, Mycn), anti-apoptotic genes (Bcl-xL, Bcl-2), and cell-cycle inhibitors Cdkn1c/p57 and Cdkn1a/p21. Expression levels were analyzed relative to Actin-β as housekeeping gene (TaqMan primer and probe sets, PCR Master Mix, StepOne Plus Light Cycler [Applied Biosystems]).
In vitro cultivation and phenotyping
Total BM cells were flushed from femurs, tibias, and hips of wild-type (wt), Mpl−/−, and Thpo−/− mice, and the mononuclear cell (MNC) fraction was isolated by density centrifugation using Histopaque-1083 (Sigma-Aldrich). MNCs were stained for lineage marker, Sca-1, and c-Kit. LSK cells were sorted on an Aria Fusion cell sorter (BD). A total of 104 LSK cells were seeded (96-well format) and further cultured in StemSpan supplemented with Scf (10 ng/mL) or Scf (10 ng/mL) and Thpo (100 ng/mL). At different time points, Epcr surface expression was determined by antibody staining and flow cytometry.
Histology
Organs of mice were fixed in 4% formalin for at least 24 hours and embedded in paraffin. Bones were decalcified by Decal (SERVA Electrophoresis GmbH). One- to 2-µm sections were cut and stained with hematoxylin/eosin.
Statistical analysis
For statistical significance testing between the means of 2 groups, the 2-tailed, unpaired Student t test with Welch correction (*P ≤ .05; **P ≤ .01) was used. For the comparison of >1 group, we used 1-way analysis of variance (ANOVA) with the Dunnett multiple comparisons test or 2-way ANOVA with the Tukey multiple comparisons test (#P ≤ .01; ##P ≤ .01).
Results
Selection of Thpo/Mpl-signaling–related genes
Putative Thpo target genes were selected based on our previous gene-expression analysis and by comparison with known stem cell gene sets, including a published Thpo signature in HSCs,22 using gene-set enrichment analysis (GSEA) (supplemental Figure 1, available on the Blood Web site).23,24 Five of the genes were analyzed in our study: pre–B-cell leukemia homeobox 1 (Pbx1), the Wnt receptor frizzled 4 (Fzd4), homeobox A10 (Hoxa10), Procr/Epcr, neuroblastoma-derived homolog Myc (Mycn). Expression of these genes was quantified in sorted hematopoietic stem and progenitor cells of wt mice (lineage marker–negative, Sca1+, and cKit+ [LSK] cells, CMPs, GMPs, and MEPs) by quantitative PCR. The genes were expressed at significantly higher levels in LSK cells than in the progenitor populations, except for Pbx1 with higher expression levels in CMP (Figure 1A). Epcr cell-surface presentation was further validated by flow cytometry and demonstrated a clear specificity for LT-repopulating HSCs (Figure 1B). Epcr expression was reduced on LSK cells and LT-HSCs of Mpl−/− and Thpo−/− mice.
![Figure 1. Validation of candidate genes in murine hematopoietic stem and progenitor cells. (A) Gene-expression analysis of Pbx1, Fzd4, Hoxa10, Procr (Epcr), and Mycn in sorted LSK cells, CMPs, GMPs, and MEPs from wt C57BL/6J mice. Shown is the relative expression compared with expression of β-Actin (2-CT genes/2-CT actin; 3-5 independent cell sortings from BM of 2 pooled mice (C57Bl/6J) for each sort. PCR was performed on those samples (mean plus or minus standard deviation [SD]; 1-way ANOVA with Dunnett multiple comparisons test to the expression in LSK cell population [#P ≤ .05; ##P ≤ .01]). (B) Cell-surface expression of Epcr on LK, LSK, and LT-repopulating HSCs (LSK, CD48−, CD150+) from naive C57Bl/6J, Mpl−/−, and Thpo−/− mice. Endogenous Epcr was detected by antibody staining and flow cytometry (blue color, red color indicates the unstained control in the flow cytometry blots of wt BM) (n = 4-5; unpaired Student t test with Welsh correction [**P ≤ .01]). ActB, actin beta; CT, cycle threshold; n.d., not detectable.](https://ash.silverchair-cdn.com/ash/content_public/journal/blood/133/13/10.1182_blood-2018-03-837344/3/m_blood837344f1.png?Expires=1769110377&Signature=ID-hqXt0D83mbaQBZSchmaCWZwUrLRIRUlcyxThTkH~4qbG3UETOXaIImWsTmtYb3LNZu5ehCT1Ol1esqVpIM0tFkxW0W29tPvzvCqM-h8GmCDgUaEwjab7ym6JsRoFhK2ZtoNKhoG7ZISJX~WpccCL04WeRj2ZC9gl9TKnzjArGbuf3YsJwXr~-qr8TJ2gQ0VCJ1DYWx5E8IA8hIvlLWYtivf9wnnGTLII3ymaATO7wTWDAbTdmkKtFFs-G4hf-jDVWJOpMcN1pIO2dETZFmd8A6jRwL1y0cMAtEwboq69RtxtcEgMa9p4CC2eRLwzy3v8G4IWEDCcFYHitVBXDwA__&Key-Pair-Id=APKAIE5G5CRDK6RD3PGA)
Validation of candidate genes in murine hematopoietic stem and progenitor cells. (A) Gene-expression analysis of Pbx1, Fzd4, Hoxa10, Procr (Epcr), and Mycn in sorted LSK cells, CMPs, GMPs, and MEPs from wt C57BL/6J mice. Shown is the relative expression compared with expression of β-Actin (2-CT genes/2-CT actin; 3-5 independent cell sortings from BM of 2 pooled mice (C57Bl/6J) for each sort. PCR was performed on those samples (mean plus or minus standard deviation [SD]; 1-way ANOVA with Dunnett multiple comparisons test to the expression in LSK cell population [#P ≤ .05; ##P ≤ .01]). (B) Cell-surface expression of Epcr on LK, LSK, and LT-repopulating HSCs (LSK, CD48−, CD150+) from naive C57Bl/6J, Mpl−/−, and Thpo−/− mice. Endogenous Epcr was detected by antibody staining and flow cytometry (blue color, red color indicates the unstained control in the flow cytometry blots of wt BM) (n = 4-5; unpaired Student t test with Welsh correction [**P ≤ .01]). ActB, actin beta; CT, cycle threshold; n.d., not detectable.
Validation of candidate genes in murine hematopoietic stem and progenitor cells. (A) Gene-expression analysis of Pbx1, Fzd4, Hoxa10, Procr (Epcr), and Mycn in sorted LSK cells, CMPs, GMPs, and MEPs from wt C57BL/6J mice. Shown is the relative expression compared with expression of β-Actin (2-CT genes/2-CT actin; 3-5 independent cell sortings from BM of 2 pooled mice (C57Bl/6J) for each sort. PCR was performed on those samples (mean plus or minus standard deviation [SD]; 1-way ANOVA with Dunnett multiple comparisons test to the expression in LSK cell population [#P ≤ .05; ##P ≤ .01]). (B) Cell-surface expression of Epcr on LK, LSK, and LT-repopulating HSCs (LSK, CD48−, CD150+) from naive C57Bl/6J, Mpl−/−, and Thpo−/− mice. Endogenous Epcr was detected by antibody staining and flow cytometry (blue color, red color indicates the unstained control in the flow cytometry blots of wt BM) (n = 4-5; unpaired Student t test with Welsh correction [**P ≤ .01]). ActB, actin beta; CT, cycle threshold; n.d., not detectable.
Overexpression of Thpo/Mpl-signaling–related genes by lentiviral transduction and transplantation in the Mpl−/− mouse model
To investigate whether these genes would be able to rescue the symptoms of Mpl deficiency, we overexpressed the respective cDNAs by lentiviral transduction in the hematopoiesis of Mpl−/− mice. Transduced lin− cells of Mpl−/− (CD45.2) mice were transplanted into conditioned Mpl−/− (CD45.1) recipient mice (Figure 2A). In vitro transduction efficiencies varied between 6% and 39%. Three to 10 Mpl−/− (CD45.1) recipients were transplanted per gene group (Pbx1, Fzd4, Hoxa10, Epcr, Mycn) and compared with mice transplanted with eGFP-transduced Mpl−/− cells as negative control, or eGFP-transduced wt cells as positive control (Table 1). After a 6-week repopulation phase, hematopoiesis was analyzed every 3 to 4 weeks by blood cell analysis.
![Figure 2. Epcr-transduced Mpl−/−BM cells showed increased MK numbers after transplantation. (A) Lentiviral vector architecture and transplantation scheme. lin− BM cells of Mpl−/− CD45.2 donor mice were transduced and transplanted into Mpl−/− CD45.1 primary recipient mice or serially into secondary Mpl−/− CD45.1 recipient mice. Mice were irradiated before transplantation. (B) Histology of BM sections of the Epcr and negative control (as indicated). Left, hematoxylin and eosin stain; original magnification ×400. Right, hematoxylin and eosin stain; ×1000 magnification. The MKs can be identified by their size and the multilobed nucleus (arrowheads). (C) MKs were counted in 3 to 9 BM sections per group and the number of MKs is expressed as MKs per field of view (mean plus or minus SD). Two persons counted 8 fields of view per section, independently. The number of MKs in the Epcr group (n = 6) is significantly increased by threefold compared with the negative control (n = 9) (2-tailed, unpaired Student t test with Welch correction [*P ≤ .05]; positive control (n = 5) vs negative control [**P ≤ .01]). PGK, human phosphoglycerate kinase promoter; R, repeat region; U3 and U5, unique region 3′ and 5′, respectively; wPRE, woodchuck hepatitis virus posttranscriptional regulatory element.](https://ash.silverchair-cdn.com/ash/content_public/journal/blood/133/13/10.1182_blood-2018-03-837344/3/m_blood837344f2.png?Expires=1769110377&Signature=xA85713NbS0pwo8LafVUk2R1O2wFo-3AjSNP7uvkwe3v-0LrAU36ouvrdy8PXUqatc4L6hpqxu8gWmj05I56tioOLW0xGDN-6gL0OuxneupHpipYQRtSNRLawKnRhawkOWj-I29BisRmbnvR9JtIZOOnoChXE3ckOOBHUIb75i27xdhh95-rBCIjKMbJplcNwX7bLrk4It0xcQhZmAUW4W3m631Exu6olohdiSsKxgRhzOCDHOQhmzonYrRxsfnbdeCFbGvQIbcUmD9W1GpwW-TZZsm6uINHBRNlDf4bZcx7e7np~7vaZ5MFHCF6PNy1YwbM54jKULnbNX-zrTxxAw__&Key-Pair-Id=APKAIE5G5CRDK6RD3PGA)
Epcr-transduced Mpl−/−BM cells showed increased MK numbers after transplantation. (A) Lentiviral vector architecture and transplantation scheme. lin− BM cells of Mpl−/− CD45.2 donor mice were transduced and transplanted into Mpl−/− CD45.1 primary recipient mice or serially into secondary Mpl−/− CD45.1 recipient mice. Mice were irradiated before transplantation. (B) Histology of BM sections of the Epcr and negative control (as indicated). Left, hematoxylin and eosin stain; original magnification ×400. Right, hematoxylin and eosin stain; ×1000 magnification. The MKs can be identified by their size and the multilobed nucleus (arrowheads). (C) MKs were counted in 3 to 9 BM sections per group and the number of MKs is expressed as MKs per field of view (mean plus or minus SD). Two persons counted 8 fields of view per section, independently. The number of MKs in the Epcr group (n = 6) is significantly increased by threefold compared with the negative control (n = 9) (2-tailed, unpaired Student t test with Welch correction [*P ≤ .05]; positive control (n = 5) vs negative control [**P ≤ .01]). PGK, human phosphoglycerate kinase promoter; R, repeat region; U3 and U5, unique region 3′ and 5′, respectively; wPRE, woodchuck hepatitis virus posttranscriptional regulatory element.
Epcr-transduced Mpl−/−BM cells showed increased MK numbers after transplantation. (A) Lentiviral vector architecture and transplantation scheme. lin− BM cells of Mpl−/− CD45.2 donor mice were transduced and transplanted into Mpl−/− CD45.1 primary recipient mice or serially into secondary Mpl−/− CD45.1 recipient mice. Mice were irradiated before transplantation. (B) Histology of BM sections of the Epcr and negative control (as indicated). Left, hematoxylin and eosin stain; original magnification ×400. Right, hematoxylin and eosin stain; ×1000 magnification. The MKs can be identified by their size and the multilobed nucleus (arrowheads). (C) MKs were counted in 3 to 9 BM sections per group and the number of MKs is expressed as MKs per field of view (mean plus or minus SD). Two persons counted 8 fields of view per section, independently. The number of MKs in the Epcr group (n = 6) is significantly increased by threefold compared with the negative control (n = 9) (2-tailed, unpaired Student t test with Welch correction [*P ≤ .05]; positive control (n = 5) vs negative control [**P ≤ .01]). PGK, human phosphoglycerate kinase promoter; R, repeat region; U3 and U5, unique region 3′ and 5′, respectively; wPRE, woodchuck hepatitis virus posttranscriptional regulatory element.
Overview transplantation experiments
| Experiment | Donor | Recipient | Vector (# batch no.) | Transplanted population | GFP+ at the day of transplantation, % | No. of cells transplanted per mouse | No. of mice | No. of mice at time point of analysis† |
|---|---|---|---|---|---|---|---|---|
| 1* | Bl6 (CD45.2) | MplKO (CD45.1) | PGK.GFP.pre (#1) | Bulk-transduced lin− | 37 | 5 × 10⁵ | 3 | 3× > 16 wk |
| MplKO (CD45.2) | PGK.GFP.pre (#1) | 38 | 1.2 × 10⁶ | 3 | 3× > 16 wk | |||
| MplKO (CD45.2) | PGK.Pbx1.iGFP.pre (#1) | 7 | 8.5 × 10⁵ | 3 | 4× > 16 wk | |||
| MplKO (CD45.2) | PGK.Fzd4.iGFP.pre (#1) | 26 | 6.5 × 10⁵ | 5 | 5× > 16 wk | |||
| 2* | MplKO (CD45.2) | PGK.GFP.pre (#2) | 41 | 5 × 10⁵ | 3 | 3× > 16 wk | ||
| MplKO (CD45.2) | PGK.Hoxa10.iGFP.pre (#1) | 39 | 1.8 × 10⁶ | 3 | 3× > 16 wk | |||
| MplKO (CD45.2) | PGK.Epcr.iGFP.pre (#1) | 18 | 1.6 × 10⁶ | 3 | 3× > 16 wk | |||
| 3* | Bl6 (CD45.2) | PGK.GFP.pre (#2) | 39 | 2 × 10⁶ | 3 | 3× > 16 wk | ||
| MplKO (CD45.2) | PGK.Mycn.iGFP.pre (#1) | 19 | 2 × 10⁶ | 3 | 3× > 16 wk | |||
| MplKO (CD45.2) | PGK.Pbx1.iGFP.pre (#1) | 8 | 106 | 7 | 7× > 16 wk | |||
| 4* | Bl6 (CD45.2) | PGK.GFP.pre (#3) | 35 | 1.5 × 10⁶ | 6 | 2× 1 wk, 2× 4 wk, 2× > 16 wk | ||
| MplKO (CD45.2) | PGK.GFP.pre (#3) | 36 | 1.5 × 10⁶ | 6 | 2× 1 wk, 2× 4 wk, 2× > 16 wk | |||
| MplKO (CD45.2) | PGK.Epcr.iGFP.pre (#2) | 8 | 106 | 2 | 2× > 16 wk | |||
| 5* | MplKO (CD45.2) | PGK.GFP.pre (#4) | 29 | 106 | 3 | 2× 1 wk, 1× > 16 wk | ||
| MplKO (CD45.2) | PGK.Epcr.iGFP.pre (#3) | 6 | 106 | 1 | >16 wk | |||
| 6 | MplKO (CD45.2) | PGK.GFP.pre (#4) | 33 | 106 | 2 | 1× 1 wk, 1× 4 wk | ||
| MplKO (CD45.2) | PGK.Epcr.iGFP.pre (#4) | 23 | 106 | 4 | 2× 1 wk, 2× 4 wk | |||
| 7 | Bl6 (CD45.2) | PGK.GFP.pre (#5) | 29 | 5 × 10⁵ | 4 | 2× 1 wk, 2× 4 wk | ||
| MplKO (CD45.2) | PGK.GFP.pre (#5) | 32 | 106 | 2 | 2× 4 wk | |||
| MplKO (CD45.2) | PGK.Epcr.iGFP.pre (#5) | 19 | 106 | 3 | 1× 1 wk, 2× 4 wk | |||
| 8 | Bl6 (CD45.2) | PGK.GFP.pre (#6) | 41 | 1.3 × 10⁶ | 5 | 5× > 16 wk | ||
| MplKO (CD45.2) | PGK.GFP.pre (#6) | 42 | 1.3 × 10⁶ | 3 | 3× > 16 wk |
Mice from experiments 1 to 5 (analyzed at >16 weeks postprimary transplantation) were used as individual donors for secondary transplantation. A total of 107 total BM cells were transplanted into irradiated MplKO (CD45.1) recipients.
Indicated is the number of mice analyzed at the respective time points: at 1 week, 4 weeks, or >16 weeks after transplantation.
There were no significant differences in white and red blood cell counts between the groups and the positive control group 18 weeks after transplantation, however, white blood cell recovery was delayed in the Pbx1, Fzd4, and Epcr groups (supplemental Figure 2). Blood cell lineage analysis revealed no skewing toward the myeloid compartment by any of the gene groups, but a slight shift toward T cells at the expense of B cells in the Mycn and Hoxa10 group (supplemental Figure 3).
Beside HSC aplasia, MPL deficiency causes thrombocytopenia due to defects in MK maturation. The positive control mice already showed full reconstituted platelet numbers early after transplantation, whereas the mice of the different gene groups had the low Mpl−/− characteristic platelet counts similar to the negative control (173 × 103/mm3 ± 45 × 103/mm3; supplemental Figure 2). In BM histology, enlarged MKs with multilobed nuclei were detected in the Epcr group (Figure 2B). MKs were also significantly increased in number in the Epcr group (Figure 2C).
Overexpression of Epcr increased phenotypic HSCs
Next, we assessed the chimerism in the hematopoietic system of transplanted mice as a measure of engraftment potential of the donor cells. In the positive control group, donor cells contributed to PB leukocytes with ∼93%, compared with only 60% in the negative control 16 weeks after transplantation (**P = .006; supplemental Figure 4). None of the genes significantly improved donor chimerism in the blood, among them, mice of the Fzd4-expressing group showed the lowest engraftment. Fzd4-transduced cells also contributed the least to the stem and progenitor population, defined as LSK cells. The positive control group demonstrated >90% donor chimerism in the LSK compartment (*P = .018 compared with the negative control group) whereas this was not significantly increased in the gene groups (Figure 3A). Also, the contribution of LSK cells to the BM was not altered by the expression of the genes (Figure 3B). However, when identifying LT-HSCs defined by their surface phenotype (LSK, CD34−, CD135−,25 “phenotypic HSC”), mice of the Epcr group showed a significantly increased proportion of LT-HSCs (Figure 3C-D), which was also significantly expanded in numbers (ninefold) compared with the negative control (Figure 3G). Expression of Hoxa10 and Mycn significantly decreased the proportion of multipotent progenitors (MPPs) and increased the proportion of short-term (ST)-HSCs (LSK, CD34+, CD135−) (Figure 3D-E), but this did not correlate with an increase in ST-HSC numbers (Figure 3F) or skewing to a specific progenitor population in any of the gene groups (supplemental Figure 5).
![Figure 3. Reconstitution of hematopoietic stem and progenitor cells >16 weeks in Mpl−/−mice transplanted with Mpl−/−BM transduced to express 1 of the selected genes. (A) Contribution of donor cells (CD45.2+) on LSK cells (mean plus or minus SD; 2-tailed, unpaired Student t test with Welch correction [*P = .024]; compared with the negative control). (B) Contribution of LSK cells in the nucleated BM cells (mean plus or minus SD; 2-tailed, unpaired Student t test with Welch correction [**P = .001]; compared with the negative control). (C) Representative flow cytometric analysis of LSK cells on the expression of CD34 and CD135 to discriminate between LT-HSCs, ST-HSCs, and MPP, as indicated, from mice of the gene groups Epcr and Hoxa10 compared with the negative and positive controls. (D) Contribution of MPP, ST-HSCs, and LT-HSCs on the LSK cells of the different gene groups (positive control, n = 10; negative control, n = 9; Pbx1, n = 7; Epcr, n = 6; Hoxa10 and Mycn, n = 3; mean plus or minus SD; Student t test with Welch correction [*P ≤ .05; **P ≤ .01]) (2-way ANOVA [P = .07]; Epcr vs negative control). (E) Number of total MPP, (F) ST-HSCs, and (G) LT-HSCs per mouse in the different gene groups. (E-G) Positive control, n = 10; negative control, n = 9; Pbx1, n = 7; Epcr, n = 6; Hoxa10 and Mycn, n = 3; mean plus or minus SD; 1-way ANOVA with Dunnett multiple comparisons test; Epcr vs negative control LT-HSCs (##P = .0037 [Student t test; P = .08]).](https://ash.silverchair-cdn.com/ash/content_public/journal/blood/133/13/10.1182_blood-2018-03-837344/3/m_blood837344f3.png?Expires=1769110378&Signature=3hmMdk340NcFkkPxBWNQ9RJt~K3HnSE6Q7norjGbu0ewl84tDDMpL-9fOIbJUKM2wAZBPyCcDS7FcdtzqhpUFiOjRTdxGBsItZVIIM7tcotnHBA39jMYvZ~aqemhEF6-hfenh9hsramHvr2vkzYAJTvyDVG1vCpEuVzfIw5T3K5yuiL0lkszc2X11nRV5LDY0EIZYl1sz4zSm6u8O53zX0TQrJ09AUcgPOXqnpsTaYvH4uGrK1WmYarhn4iXrj~cDkT7o3hrmFLYoyNgiVjHRoHioPfspIn3WnXFrnpvBQHvXzhjQFsHayo8FU0mRSMh1RppRL0msP1eCdj~ROIVLg__&Key-Pair-Id=APKAIE5G5CRDK6RD3PGA)
Reconstitution of hematopoietic stem and progenitor cells >16 weeks in Mpl−/−mice transplanted with Mpl−/−BM transduced to express 1 of the selected genes. (A) Contribution of donor cells (CD45.2+) on LSK cells (mean plus or minus SD; 2-tailed, unpaired Student t test with Welch correction [*P = .024]; compared with the negative control). (B) Contribution of LSK cells in the nucleated BM cells (mean plus or minus SD; 2-tailed, unpaired Student t test with Welch correction [**P = .001]; compared with the negative control). (C) Representative flow cytometric analysis of LSK cells on the expression of CD34 and CD135 to discriminate between LT-HSCs, ST-HSCs, and MPP, as indicated, from mice of the gene groups Epcr and Hoxa10 compared with the negative and positive controls. (D) Contribution of MPP, ST-HSCs, and LT-HSCs on the LSK cells of the different gene groups (positive control, n = 10; negative control, n = 9; Pbx1, n = 7; Epcr, n = 6; Hoxa10 and Mycn, n = 3; mean plus or minus SD; Student t test with Welch correction [*P ≤ .05; **P ≤ .01]) (2-way ANOVA [P = .07]; Epcr vs negative control). (E) Number of total MPP, (F) ST-HSCs, and (G) LT-HSCs per mouse in the different gene groups. (E-G) Positive control, n = 10; negative control, n = 9; Pbx1, n = 7; Epcr, n = 6; Hoxa10 and Mycn, n = 3; mean plus or minus SD; 1-way ANOVA with Dunnett multiple comparisons test; Epcr vs negative control LT-HSCs (##P = .0037 [Student t test; P = .08]).
Reconstitution of hematopoietic stem and progenitor cells >16 weeks in Mpl−/−mice transplanted with Mpl−/−BM transduced to express 1 of the selected genes. (A) Contribution of donor cells (CD45.2+) on LSK cells (mean plus or minus SD; 2-tailed, unpaired Student t test with Welch correction [*P = .024]; compared with the negative control). (B) Contribution of LSK cells in the nucleated BM cells (mean plus or minus SD; 2-tailed, unpaired Student t test with Welch correction [**P = .001]; compared with the negative control). (C) Representative flow cytometric analysis of LSK cells on the expression of CD34 and CD135 to discriminate between LT-HSCs, ST-HSCs, and MPP, as indicated, from mice of the gene groups Epcr and Hoxa10 compared with the negative and positive controls. (D) Contribution of MPP, ST-HSCs, and LT-HSCs on the LSK cells of the different gene groups (positive control, n = 10; negative control, n = 9; Pbx1, n = 7; Epcr, n = 6; Hoxa10 and Mycn, n = 3; mean plus or minus SD; Student t test with Welch correction [*P ≤ .05; **P ≤ .01]) (2-way ANOVA [P = .07]; Epcr vs negative control). (E) Number of total MPP, (F) ST-HSCs, and (G) LT-HSCs per mouse in the different gene groups. (E-G) Positive control, n = 10; negative control, n = 9; Pbx1, n = 7; Epcr, n = 6; Hoxa10 and Mycn, n = 3; mean plus or minus SD; 1-way ANOVA with Dunnett multiple comparisons test; Epcr vs negative control LT-HSCs (##P = .0037 [Student t test; P = .08]).
To further validate the increase in phenotypic LT-HSCs in the Epcr group, we analyzed their contribution and number by an alternative cell-surface marker staining (LSK, CD48−, CD150+) and confirmed a significant enrichment of LT-HSCs by Epcr expression (22-fold compared with the negative control group; ##P = .004; Figure 4A-C). When correlating the percentage of transgene-expressing LSK and LT-HSCs to transgene-positive whole BM cells (supplemental Figure 6), an accumulation of Epcr+ cells in the HSC compartment was evident (Figure 4D).
![Figure 4. Enrichment of phenotypic and functional LT-HSCs by Epcr expression. (A) Contribution of LT-HSCs (LSK, CD48−, CD150+) to LSK cells in the different gene groups in the primary recipients (Epcr vs negative control [##P < .0001]). (B) Total number of LT-HSCs of LSK cells in the different gene groups in the primary recipients (positive control, n = 10; negative control, n = 9; Pbx1, n = 7; Epcr, n = 6; Hoxa10 and Mycn, n = 3; Epcr vs negative control [##P = .004]). (C) Representative flow cytometry of a primary transplanted mouse from the Epcr group compared with the negative and positive controls. (D) The percentage of GFP+ cells was measured by flow cytometry in the LSK and LT-HSC compartment. Shown is the fold difference of GFP+ cells compared with total BM GFP+ cells. Epcr-transduced and -transplanted Mpl−/− cells are significantly enriched in the LT-HSC compartment. (A-D) Mean plus or minus SD; 2-way ANOVA with Tukey multiple comparisons test (##P < .0001). Because coexpressed GFP from the Pbx1-encoding vector was very low, the analysis was not performed in this group. (E) Contribution of LT-HSCs to LSK cells in the different gene groups in the secondary recipients. (F) Number of LT-HSCs of LSK cells in the different gene groups in the secondary recipients. (G) Donor chimerism (CD45.2+) on LT-HSCs in the different gene groups in secondary recipients. (H) To measure an expansion of LT-HSCs after transplantation, the number of transplanted phenotypic LT-HSCs from 1° recipients was correlated to the number of phenotypic LT-HSCs detected in the 2° recipients. In case the ratio was 1 or below, not efficient engraftment and expansion of LT-HSCs took place. In case the ratio was higher than 1, LT-HSCs have expanded in number (dotted line at 1, the values for Hoxa10 were 0). (E-H) Positive control, n = 5; negative control, n = 6; Pbx1, n = 7; Epcr, n = 6; Hoxa10 and Mycn, n = 3; mean plus or minus SD; 2-tailed, unpaired Student t test with Welch correction (**P ≤ .01; *P ≤ .05).](https://ash.silverchair-cdn.com/ash/content_public/journal/blood/133/13/10.1182_blood-2018-03-837344/3/m_blood837344f4.png?Expires=1769110378&Signature=fo2iWppH5GOeSZu58UvyCprfSDeT6zF1GTSZDyeuavqcgQMc6tc-PpsXUs4uIRYExESUVbu6RRxL4bJs~60~Z33LgJNgnEk4to1sFvRnN7-z31l68ImPFMOuQTh46RO5oqP43ifmDPGs9YxgvkxejLK5iP5QuxH-EgXc3CHmroYabL~jVgmhoxGu7Is5Qrd-I5K0nXTfMisBP5lLtzYeY-dhuPc2s7I8fHof9SN4~DeuORpCNbbUXG8s8VnJviml3SM2p8PS1LUUtGrgViT1Th4gxpVQckoaNUp3tWOPt043P~RcqacduFIqMergz2n88a-IcHYlY2O~YD47wOGE8g__&Key-Pair-Id=APKAIE5G5CRDK6RD3PGA)
Enrichment of phenotypic and functional LT-HSCs by Epcr expression. (A) Contribution of LT-HSCs (LSK, CD48−, CD150+) to LSK cells in the different gene groups in the primary recipients (Epcr vs negative control [##P < .0001]). (B) Total number of LT-HSCs of LSK cells in the different gene groups in the primary recipients (positive control, n = 10; negative control, n = 9; Pbx1, n = 7; Epcr, n = 6; Hoxa10 and Mycn, n = 3; Epcr vs negative control [##P = .004]). (C) Representative flow cytometry of a primary transplanted mouse from the Epcr group compared with the negative and positive controls. (D) The percentage of GFP+ cells was measured by flow cytometry in the LSK and LT-HSC compartment. Shown is the fold difference of GFP+ cells compared with total BM GFP+ cells. Epcr-transduced and -transplanted Mpl−/− cells are significantly enriched in the LT-HSC compartment. (A-D) Mean plus or minus SD; 2-way ANOVA with Tukey multiple comparisons test (##P < .0001). Because coexpressed GFP from the Pbx1-encoding vector was very low, the analysis was not performed in this group. (E) Contribution of LT-HSCs to LSK cells in the different gene groups in the secondary recipients. (F) Number of LT-HSCs of LSK cells in the different gene groups in the secondary recipients. (G) Donor chimerism (CD45.2+) on LT-HSCs in the different gene groups in secondary recipients. (H) To measure an expansion of LT-HSCs after transplantation, the number of transplanted phenotypic LT-HSCs from 1° recipients was correlated to the number of phenotypic LT-HSCs detected in the 2° recipients. In case the ratio was 1 or below, not efficient engraftment and expansion of LT-HSCs took place. In case the ratio was higher than 1, LT-HSCs have expanded in number (dotted line at 1, the values for Hoxa10 were 0). (E-H) Positive control, n = 5; negative control, n = 6; Pbx1, n = 7; Epcr, n = 6; Hoxa10 and Mycn, n = 3; mean plus or minus SD; 2-tailed, unpaired Student t test with Welch correction (**P ≤ .01; *P ≤ .05).
Enrichment of phenotypic and functional LT-HSCs by Epcr expression. (A) Contribution of LT-HSCs (LSK, CD48−, CD150+) to LSK cells in the different gene groups in the primary recipients (Epcr vs negative control [##P < .0001]). (B) Total number of LT-HSCs of LSK cells in the different gene groups in the primary recipients (positive control, n = 10; negative control, n = 9; Pbx1, n = 7; Epcr, n = 6; Hoxa10 and Mycn, n = 3; Epcr vs negative control [##P = .004]). (C) Representative flow cytometry of a primary transplanted mouse from the Epcr group compared with the negative and positive controls. (D) The percentage of GFP+ cells was measured by flow cytometry in the LSK and LT-HSC compartment. Shown is the fold difference of GFP+ cells compared with total BM GFP+ cells. Epcr-transduced and -transplanted Mpl−/− cells are significantly enriched in the LT-HSC compartment. (A-D) Mean plus or minus SD; 2-way ANOVA with Tukey multiple comparisons test (##P < .0001). Because coexpressed GFP from the Pbx1-encoding vector was very low, the analysis was not performed in this group. (E) Contribution of LT-HSCs to LSK cells in the different gene groups in the secondary recipients. (F) Number of LT-HSCs of LSK cells in the different gene groups in the secondary recipients. (G) Donor chimerism (CD45.2+) on LT-HSCs in the different gene groups in secondary recipients. (H) To measure an expansion of LT-HSCs after transplantation, the number of transplanted phenotypic LT-HSCs from 1° recipients was correlated to the number of phenotypic LT-HSCs detected in the 2° recipients. In case the ratio was 1 or below, not efficient engraftment and expansion of LT-HSCs took place. In case the ratio was higher than 1, LT-HSCs have expanded in number (dotted line at 1, the values for Hoxa10 were 0). (E-H) Positive control, n = 5; negative control, n = 6; Pbx1, n = 7; Epcr, n = 6; Hoxa10 and Mycn, n = 3; mean plus or minus SD; 2-tailed, unpaired Student t test with Welch correction (**P ≤ .01; *P ≤ .05).
Next, we performed serial transplantations into conditioned secondary Mpl−/− recipients to examine the functionality of the LT-HSCs. All mice received 1 × 10⁷ total BM cells irrespective of LSK, CD34−, CD135− cell contribution. Epcr expression supported engraftment of LT-HSCs (Figure 4E-F). Also, the chimerism in the LT-HSCs was higher than in any of the other gene groups (Figure 4G; but not blood cell chimerism; supplemental Figure 7). Platelet counts were improved in the Epcr group compared with the negative control (supplemental Figure 7C). To address the questions of whether phenotypic LT-HSCs were expanded after secondary transplantation, we calculated the number of input to output: more LT-HSCs in vivo than were transplanted indicates HSC expansion. Expression of Epcr led to a 2.7-fold increase in HSC numbers (Figure 4H).
Epcr-overexpressing Mpl−/− HSCs express Bcl-xL and enter quiescence more quickly
To investigate the underlying mechanisms of Epcr-mediated HSC expansion in Mpl−/− mice, we sorted LSK cells from the Epcr, negative, and positive control groups at >16 weeks after transplantation and analyzed RNA expression by quantitative PCR. As one of the cytoprotective effects of Epcr/Par-1 activation is mediated via anti-apoptotic gene expression, we measured messenger RNA (mRNA) levels of Bcl-2 and Bcl-xL, and found Bcl-xL expression 13-fold upregulated compared with both the positive and negative control LSK cells, whereas Bcl-2 expression was not altered (Figure 5A).
![Figure 5. Epcr expression supports HSC maintenance and supports engraftment of Mpl−/−BM cells. (A) Expression of the anti-apoptotic genes Bcl-xL and Bcl-2 and (B) cell-cycle regulators Cdkn1a/p21 and Cdkn1c/p57 in LSK cells from mice transplanted with Epcr-transduced Mpl−/− BM cells (Epcr, n = 3), GFP-transduced wt cells (positive control, n = 6) or GFP-transduced Mpl−/− cells (negative control, n = 5). Shown is the expression relative to β-actin (2-CT genes/2-CT actin). LSK cells were sorted at >16 weeks after transplantation. For statistical analysis relative expression values were transformed using Y = Log(Y) (mean plus or minus SD; 2-tailed, unpaired Student t test with Welch correction [*P ≤ .05]). (C) Cell-cycle status of HSCs (LSK, CD34−, CD150+), determined by flow cytometric measurement of Ki-67 and 7-AAD, at >16 weeks after transplantation of GFP-transduced wt (positive control, n = 10), GFP-transduced Mpl−/− (negative control n = 9), or Epcr-transduced Mpl−/− BM cells (n = 6) (box-whisker plot; 2-tailed, unpaired Student t test with Welch correction [**P ≤ .01]). (D) LSK cell counts in the BM and spleen of Mpl−/− mice transplanted with Epcr-transduced Mpl−/− BM cells (n = 3), GFP-transduced Mpl−/− (negative control, n = 5) or GFP-transduced wt lin−BM cells (positive control, n = 4) 1 week after transplantation, and 4 weeks after transplantation shown in panel E (separate transduction and transplantation experiment; Epcr, n = 4; negative control, n = 5; positive control, n = 4; mean plus or minus SD; 1-way ANOVA with Dunnett multiple comparisons test [#P ≤ .05]). (F) Cell-cycle status of HSCs (LSK, CD34−, CD150+) from mice transplanted with Epcr-transduced Mpl−/− BM cells (n = 4) in comparison with the negative (n = 5) and positive control (n = 4) groups 4 weeks after transplantation (box-whisker plot; 2-way ANOVA with Tukey multiple comparisons test [##P = .009]).](https://ash.silverchair-cdn.com/ash/content_public/journal/blood/133/13/10.1182_blood-2018-03-837344/3/m_blood837344f5.png?Expires=1769110378&Signature=y2KrW9OsFtt9VTvShE5-PKgvcFFCPX0hGsj1q-QHpySMw51kuFErfsdJHlF70SjpldVMnB1uuweRzQ8kDOxa8ym0A8-9wQx6Eet69s-iT1bjl9ifeQfVimJ09jzGBSsZFymvbz3LoC2DUsSxUegg4Ye2yRGgiX30EWEP9YTh6r0ZnkX8MB7ooRI-BWMGQO0KG-BJujxKDnaPK-r6JCx~2jR2ug1XS2jqyL4FOqVPPQ5R7Ohpj~3zVRIFm1mr5rmV1tfGu0y0nY7OkofxMT8K3tU9qWjkOMQIYlVCxwzZzJK8Esu3infXtd9fbMqG6KHlMInGKoA94ASG7qTNNvIoOQ__&Key-Pair-Id=APKAIE5G5CRDK6RD3PGA)
Epcr expression supports HSC maintenance and supports engraftment of Mpl−/−BM cells. (A) Expression of the anti-apoptotic genes Bcl-xL and Bcl-2 and (B) cell-cycle regulators Cdkn1a/p21 and Cdkn1c/p57 in LSK cells from mice transplanted with Epcr-transduced Mpl−/− BM cells (Epcr, n = 3), GFP-transduced wt cells (positive control, n = 6) or GFP-transduced Mpl−/− cells (negative control, n = 5). Shown is the expression relative to β-actin (2-CT genes/2-CT actin). LSK cells were sorted at >16 weeks after transplantation. For statistical analysis relative expression values were transformed using Y = Log(Y) (mean plus or minus SD; 2-tailed, unpaired Student t test with Welch correction [*P ≤ .05]). (C) Cell-cycle status of HSCs (LSK, CD34−, CD150+), determined by flow cytometric measurement of Ki-67 and 7-AAD, at >16 weeks after transplantation of GFP-transduced wt (positive control, n = 10), GFP-transduced Mpl−/− (negative control n = 9), or Epcr-transduced Mpl−/− BM cells (n = 6) (box-whisker plot; 2-tailed, unpaired Student t test with Welch correction [**P ≤ .01]). (D) LSK cell counts in the BM and spleen of Mpl−/− mice transplanted with Epcr-transduced Mpl−/− BM cells (n = 3), GFP-transduced Mpl−/− (negative control, n = 5) or GFP-transduced wt lin−BM cells (positive control, n = 4) 1 week after transplantation, and 4 weeks after transplantation shown in panel E (separate transduction and transplantation experiment; Epcr, n = 4; negative control, n = 5; positive control, n = 4; mean plus or minus SD; 1-way ANOVA with Dunnett multiple comparisons test [#P ≤ .05]). (F) Cell-cycle status of HSCs (LSK, CD34−, CD150+) from mice transplanted with Epcr-transduced Mpl−/− BM cells (n = 4) in comparison with the negative (n = 5) and positive control (n = 4) groups 4 weeks after transplantation (box-whisker plot; 2-way ANOVA with Tukey multiple comparisons test [##P = .009]).
Epcr expression supports HSC maintenance and supports engraftment of Mpl−/−BM cells. (A) Expression of the anti-apoptotic genes Bcl-xL and Bcl-2 and (B) cell-cycle regulators Cdkn1a/p21 and Cdkn1c/p57 in LSK cells from mice transplanted with Epcr-transduced Mpl−/− BM cells (Epcr, n = 3), GFP-transduced wt cells (positive control, n = 6) or GFP-transduced Mpl−/− cells (negative control, n = 5). Shown is the expression relative to β-actin (2-CT genes/2-CT actin). LSK cells were sorted at >16 weeks after transplantation. For statistical analysis relative expression values were transformed using Y = Log(Y) (mean plus or minus SD; 2-tailed, unpaired Student t test with Welch correction [*P ≤ .05]). (C) Cell-cycle status of HSCs (LSK, CD34−, CD150+), determined by flow cytometric measurement of Ki-67 and 7-AAD, at >16 weeks after transplantation of GFP-transduced wt (positive control, n = 10), GFP-transduced Mpl−/− (negative control n = 9), or Epcr-transduced Mpl−/− BM cells (n = 6) (box-whisker plot; 2-tailed, unpaired Student t test with Welch correction [**P ≤ .01]). (D) LSK cell counts in the BM and spleen of Mpl−/− mice transplanted with Epcr-transduced Mpl−/− BM cells (n = 3), GFP-transduced Mpl−/− (negative control, n = 5) or GFP-transduced wt lin−BM cells (positive control, n = 4) 1 week after transplantation, and 4 weeks after transplantation shown in panel E (separate transduction and transplantation experiment; Epcr, n = 4; negative control, n = 5; positive control, n = 4; mean plus or minus SD; 1-way ANOVA with Dunnett multiple comparisons test [#P ≤ .05]). (F) Cell-cycle status of HSCs (LSK, CD34−, CD150+) from mice transplanted with Epcr-transduced Mpl−/− BM cells (n = 4) in comparison with the negative (n = 5) and positive control (n = 4) groups 4 weeks after transplantation (box-whisker plot; 2-way ANOVA with Tukey multiple comparisons test [##P = .009]).
Inhibition of Mpl signaling and Thpo deficiency in mice are associated with loss of HSC quiescence.8,9 Thus, we suggested that Epcr expression in Mpl−/− HSCs may have altered HSC cycling. Therefore, expression of the 2 cell-cycle regulators, Cdkn1a/p21 and Cdkn1c/p57, was investigated and revealed 2.6-fold increased p21expression in the Epcr group, however, without reaching the levels in wt HSCs of the positive control group (Figure 5B). p57 expression was also increased compared with the negative control group but was not significant due to high variation. The cell-cycle status of HSCs (LSK, CD150+, CD34−) was investigated by flow cytometry at >16 weeks after transplantation. HSCs of Epcr-transplanted mice were more in G0 (mean, 60%) similar to wt BM-transplanted positive control mice (Figure 5C).
Epcr expression supports engraftment and expansion of HSCs shortly after transplantation
Epcr+ HSCs have been attributed to express specific adhesion molecules that control retention in the BM.20 We therefore hypothesized that Epcr overexpression may also alter engraftment kinetics and expansion after transplantation. To address this, we investigated LSK cell numbers and donor contribution in the spleen and BM at 1 and 4 weeks after transplantation of Epcr-transduced Mpl−/− BM cells into conditioned Mpl−/− recipient mice.
One week after transplantation, most LSK cells were located in the spleen (Figure 5D). After 4 weeks, however, the BM was efficiently engrafted by LSK cells in the Epcr-transduced and the positive control groups but not the negative control group (1-way ANOVA, *P ≤ .05, vs the negative control group; Figure 5E). HSCs (LSK, CD150+, CD34−) of the Epcr group were also significantly more in the G0 phase (##P = .009; Figure 5F), indicating that Epcr+ HSCs more quickly established a quiescent HSC pool compared with Mpl−/− HSCs with low Epcr expression levels. PB cell recovery in the early weeks after transplantation was undisturbed and was not altered by Epcr expression (supplemental Figure 8).
Epcr+ wt BM cells have superior engraftment potential
We next addressed whether the superior engraftment potential also coincides with Epcr expression in normal hematopoiesis. Therefore, wt BM cells were sorted for lin−Epcr+ or lin−Epcr− phenotypes (supplemental Figure 9) and transplanted into wt mice (Table 2). One week after transplantation, there were significantly more LSK cells in the spleen of mice transplanted with Epcr− cells (Figure 6A), which correlated with higher spleen weights (supplemental Figure 10). Four weeks after transplantation, LSK cell numbers in the BM were markedly increased. In Epcr+-transplanted mice, LSK cell numbers were significantly higher than in Epcr−-transplanted mice and mainly donor derived (Figure 6B). Also, the donor contribution in the blood was now >90%, which further increased, whereas donor contribution in the blood of Epcr−-transplanted mice dropped constantly (Figure 6C). At 20 weeks, the LSK compartment in both mouse groups was recovered, however, only in the Epcr+-transplanted group donor cells contributed significantly to LSK cells and LT-HSCs (in the Epcr− group, the contribution of LSK was 5%, and for LT-HSCs it was <2%; Figure 6D-E). In conclusion, Epcr+ HSPCs repopulated the BM more efficiently and established LT hematopoiesis after transplantation.
Overview of the transplantations with Epcr+ vs Epcr− sorted lin− BM cells
| Experiment | Donor | Recipient | Vector | Transplanted population | GFP+ at transplantation | No. of cells transplanted per mouse | No. of mice | No. of mice at time point of analysis* |
|---|---|---|---|---|---|---|---|---|
| 9 | Bl6 (CD45.1) | Bl6 (CD45.2) | Untransduced | lin−Epcr− | n.a. | 1.5 × 10⁶ | 5 | 2× 1 wk, 3× 4 wk |
| lin−Epcr+ | n.a. | 1.5 × 10⁴ | 5 | 3× 1 wk, 2× 4 wk | ||||
| 10 | lin−Epcr− | n.a. | 1.5 × 10⁶ | 5 | 3× 1 wk, 2× 4 wk | |||
| lin−Epcr+ | n.a. | 1.5 × 10⁴ | 5 | 3× 1 wk, 2× 4 wk | ||||
| 11 | lin−Epcr− | n.a. | 1.5 × 10⁶ | 6 | 6× > 16 wk | |||
| lin−Epcr+ | n.a. | 1.5 × 10⁴ | 9 | 9× > 16 wk |
n.a., not applicable.
Indicated is the number of mice analyzed at the respective time points: at 1 week, 4 weeks, or >16 weeks after transplantation.
![Figure 6. Epcr+ wt BM cells have a repopulation advantage in wt mice. BM cells were isolated by fluorescence-activated cell sorting as described in “Methods.” After sorting, a number of 1.5 × 10⁴ Epcr+lin− or 1.5 × 10⁶ Epcr−lin− cells were transplanted per recipient mouse. (A) LSK cell number in the BM and spleens of wt mice transplanted with Epcr+ or Epcr− lin− BM cells 1 week after transplantation. (B) Total LSK cell number (white bar) and the respective donor contribution (gray or blue bar) in the BM and spleens of wt mice transplanted with Epcr+ or Epcr− lin− BM cells 4 weeks after transplantation. (A-B) n = 5; mean plus or minus SD; 1-way-ANOVA with Dunnett multiple comparisons test [##P ≤ .01]) (C) Donor contribution in the PB over the course of the experiment from 1 to 20 weeks after transplantation. In the Epcr+ group, donor contribution increased significantly (mean plus or minus SD; 2-tailed, unpaired Student t test with Welch correction to compare Epcr+ vs Epcr− at each time point [**P ≤ .01]). (D) Total LSK cell number (white bar) and the respective donor contribution (gray or blue bar) in the BM of wt mice transplanted with Epcr+ or Epcr− lin− BM cells 20 weeks after transplantation. (Epcr+, n = 9; Epcr−, n = 6; mean plus or minus SD; 1-way-ANOVA with Dunnett multiple comparisons test [##P ≤ .01]). (E) Donor contribution on LT-HSCs in the BM 20 weeks after transplantation (Epcr+, n = 9; Epcr−, n = 6; mean plus or minus SD; 2-tailed, unpaired Student t test with Welch correction [**P ≤ .01]). (F) Flow cytometric cell-cycle analysis of naive wt and Mpl−/− LSK cells and LT-HSCs (LSK, CD150+, CD48−) discriminated by the expression of Epcr. Mpl−/− LSK cells that are negative for Epcr are significantly more in G1 compared with Epcr− wild-type LSK. (C57Bl/6J n = 4, Mpl−/− n = 3, mean plus or minus SD, 2-way ANOVA with Tukey multiple comparisons test [##P ≤ .01]). (G) Epcr+ and Epcr− lin− populations were sorted independently from 3 mice for subsequent RNA isolation and cDNA synthesis. The expression of the 2 anti-apoptotic genes Bcl-2 and Bcl-xL, and the 2 cell-cycle inhibitors Cdkn1a/p21 and Cdkn1c/p57 was measured by real-time qPCR (n = 3; mean plus or minus SD).](https://ash.silverchair-cdn.com/ash/content_public/journal/blood/133/13/10.1182_blood-2018-03-837344/3/m_blood837344f6.png?Expires=1769110378&Signature=cK7x0mb9y116ZUHAnd9lG9HbMGd9mMtT9gqsdP-nuucUN-17Q83f8YMJ-emSuMw0KWWeG-mhfMVW7NQnRNgwyp6hsqa7DMYXd5RsGNxhHqVt27QcZL-~XvETp~wELm6~B2ofejh9cEc6sRH4X26y1gAWLZLBQTG51rM6pIG5qG6doc5nYe2iKGfB7D0S0aY3lThQQ-LkMrhrkHZPyjMjt0EX7ZHBwTgjOV7CSxV2bEg9eKLwiuExtOd04EHY10UP2mK2Y~137zSoxiRC-JeIP6xIxiHhPjRJjKtHgQcBaKRZ6f0hq6gmBfh1ZJ6l1C8aX6oa~jqofnXH46IFqSWQxQ__&Key-Pair-Id=APKAIE5G5CRDK6RD3PGA)
Epcr+ wt BM cells have a repopulation advantage in wt mice. BM cells were isolated by fluorescence-activated cell sorting as described in “Methods.” After sorting, a number of 1.5 × 10⁴ Epcr+lin− or 1.5 × 10⁶ Epcr−lin− cells were transplanted per recipient mouse. (A) LSK cell number in the BM and spleens of wt mice transplanted with Epcr+ or Epcr− lin− BM cells 1 week after transplantation. (B) Total LSK cell number (white bar) and the respective donor contribution (gray or blue bar) in the BM and spleens of wt mice transplanted with Epcr+ or Epcr− lin− BM cells 4 weeks after transplantation. (A-B) n = 5; mean plus or minus SD; 1-way-ANOVA with Dunnett multiple comparisons test [##P ≤ .01]) (C) Donor contribution in the PB over the course of the experiment from 1 to 20 weeks after transplantation. In the Epcr+ group, donor contribution increased significantly (mean plus or minus SD; 2-tailed, unpaired Student t test with Welch correction to compare Epcr+ vs Epcr− at each time point [**P ≤ .01]). (D) Total LSK cell number (white bar) and the respective donor contribution (gray or blue bar) in the BM of wt mice transplanted with Epcr+ or Epcr− lin− BM cells 20 weeks after transplantation. (Epcr+, n = 9; Epcr−, n = 6; mean plus or minus SD; 1-way-ANOVA with Dunnett multiple comparisons test [##P ≤ .01]). (E) Donor contribution on LT-HSCs in the BM 20 weeks after transplantation (Epcr+, n = 9; Epcr−, n = 6; mean plus or minus SD; 2-tailed, unpaired Student t test with Welch correction [**P ≤ .01]). (F) Flow cytometric cell-cycle analysis of naive wt and Mpl−/− LSK cells and LT-HSCs (LSK, CD150+, CD48−) discriminated by the expression of Epcr. Mpl−/− LSK cells that are negative for Epcr are significantly more in G1 compared with Epcr− wild-type LSK. (C57Bl/6J n = 4, Mpl−/− n = 3, mean plus or minus SD, 2-way ANOVA with Tukey multiple comparisons test [##P ≤ .01]). (G) Epcr+ and Epcr− lin− populations were sorted independently from 3 mice for subsequent RNA isolation and cDNA synthesis. The expression of the 2 anti-apoptotic genes Bcl-2 and Bcl-xL, and the 2 cell-cycle inhibitors Cdkn1a/p21 and Cdkn1c/p57 was measured by real-time qPCR (n = 3; mean plus or minus SD).
Epcr+ wt BM cells have a repopulation advantage in wt mice. BM cells were isolated by fluorescence-activated cell sorting as described in “Methods.” After sorting, a number of 1.5 × 10⁴ Epcr+lin− or 1.5 × 10⁶ Epcr−lin− cells were transplanted per recipient mouse. (A) LSK cell number in the BM and spleens of wt mice transplanted with Epcr+ or Epcr− lin− BM cells 1 week after transplantation. (B) Total LSK cell number (white bar) and the respective donor contribution (gray or blue bar) in the BM and spleens of wt mice transplanted with Epcr+ or Epcr− lin− BM cells 4 weeks after transplantation. (A-B) n = 5; mean plus or minus SD; 1-way-ANOVA with Dunnett multiple comparisons test [##P ≤ .01]) (C) Donor contribution in the PB over the course of the experiment from 1 to 20 weeks after transplantation. In the Epcr+ group, donor contribution increased significantly (mean plus or minus SD; 2-tailed, unpaired Student t test with Welch correction to compare Epcr+ vs Epcr− at each time point [**P ≤ .01]). (D) Total LSK cell number (white bar) and the respective donor contribution (gray or blue bar) in the BM of wt mice transplanted with Epcr+ or Epcr− lin− BM cells 20 weeks after transplantation. (Epcr+, n = 9; Epcr−, n = 6; mean plus or minus SD; 1-way-ANOVA with Dunnett multiple comparisons test [##P ≤ .01]). (E) Donor contribution on LT-HSCs in the BM 20 weeks after transplantation (Epcr+, n = 9; Epcr−, n = 6; mean plus or minus SD; 2-tailed, unpaired Student t test with Welch correction [**P ≤ .01]). (F) Flow cytometric cell-cycle analysis of naive wt and Mpl−/− LSK cells and LT-HSCs (LSK, CD150+, CD48−) discriminated by the expression of Epcr. Mpl−/− LSK cells that are negative for Epcr are significantly more in G1 compared with Epcr− wild-type LSK. (C57Bl/6J n = 4, Mpl−/− n = 3, mean plus or minus SD, 2-way ANOVA with Tukey multiple comparisons test [##P ≤ .01]). (G) Epcr+ and Epcr− lin− populations were sorted independently from 3 mice for subsequent RNA isolation and cDNA synthesis. The expression of the 2 anti-apoptotic genes Bcl-2 and Bcl-xL, and the 2 cell-cycle inhibitors Cdkn1a/p21 and Cdkn1c/p57 was measured by real-time qPCR (n = 3; mean plus or minus SD).
In untransplanted hematopoiesis, Epcr+ HSPCs reside more in G0, irrespective of the expression of Mpl (Figure 6F). This is in agreement with the expression of the cell-cycle regulator Cdkn1c/p57 in Epcr+Lin− cells from wt mice (Figure 6G). Bcl-xL, Bcl-2, and p21 expression was not altered depending on Epcr expression in wt Lin−, Epcr+ cells under steady-state condition.
Epcr expression is maintained by Thpo in vitro
For lentiviral transduction, hematopoietic cells are cultured and prestimulated with cytokines, which will alter the HSC phenotype. As cell-surface expression of Epcr on HSCs coincides with improved repopulation potential early after transplantation, we measured Epcr on LSK cells by flow cytometry during 3 days of culture with Scf vs Scf/Thpo (Figure 7A) or Scf/Flt3-L vs Scf/Flt3-L/Thpo (Figure 7B-D). Without Thpo stimulation, Epcr expression decreased in vitro, whereas in the presence of Thpo, Epcr expression was more stable and better maintained. In addition, Epcr was mainly expressed on the Mpl+ LSK cell populations in the BM in vivo (Figure 7E). Thpo−/− mice showed decreased Epcr and no strong correlation with Mpl expression on the cell surface, indicating the importance of Thpo/Mpl signaling for efficient Epcr expression.
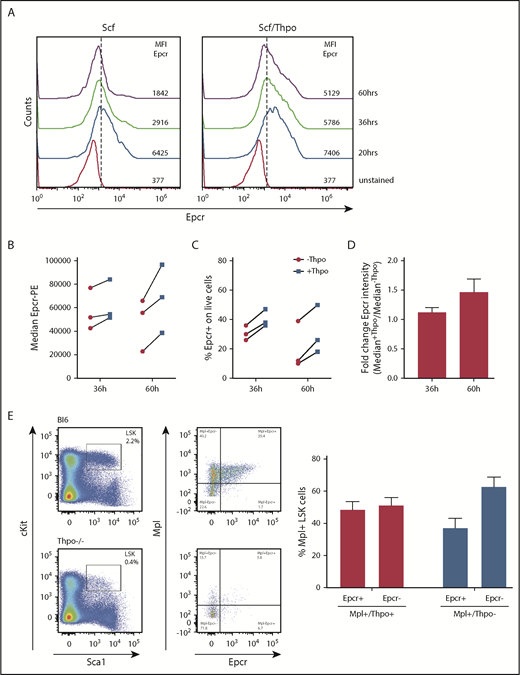
Epcr expression on murine LSK cells is stabilized by Thpo/Mpl signaling in vitro and in vivo. (A) Epcr expression of in vitro cultured wt LSK cells in medium supplemented with 20 ng/mL Scf or 10 ng/mL Scf/100 ng/mL Thpo 20, 36, and 60 hours after isolation and culture time. (B-D) Epcr expression of in vitro–cultured wt LSK cells in medium supplemented with 20 ng/mL Scf and 20 ng/ml Flt3-L (-Thpo) or 20 ng/mL Scf, 20 ng/mL Flt3-L, and 100 ng/mL Thpo (+Thpo) 36 and 60 hours after isolation and culture time (3 independent LSK sorts). Based on the median Epcr intensity, the fold change of Epcr intensity was calculated. Thpo stimulation of LSK cells maintained Epcr expression at both time points (P = .031; Wilcoxon test; paired analysis; comparing the Thpo+ vs Thpo− cultures). (E) Total BM of wt (n = 3) and Thpo−/− (n = 3) mice was stained for LSK and analyzed for the expression of Epcr and Mpl. The bars summarize the Epcr expression on the Mpl+ population of the LSK cells. In the absence of Thpo, there is no positive correlation of Epcr and Mpl. MFI, median fluorescence intensity.
Epcr expression on murine LSK cells is stabilized by Thpo/Mpl signaling in vitro and in vivo. (A) Epcr expression of in vitro cultured wt LSK cells in medium supplemented with 20 ng/mL Scf or 10 ng/mL Scf/100 ng/mL Thpo 20, 36, and 60 hours after isolation and culture time. (B-D) Epcr expression of in vitro–cultured wt LSK cells in medium supplemented with 20 ng/mL Scf and 20 ng/ml Flt3-L (-Thpo) or 20 ng/mL Scf, 20 ng/mL Flt3-L, and 100 ng/mL Thpo (+Thpo) 36 and 60 hours after isolation and culture time (3 independent LSK sorts). Based on the median Epcr intensity, the fold change of Epcr intensity was calculated. Thpo stimulation of LSK cells maintained Epcr expression at both time points (P = .031; Wilcoxon test; paired analysis; comparing the Thpo+ vs Thpo− cultures). (E) Total BM of wt (n = 3) and Thpo−/− (n = 3) mice was stained for LSK and analyzed for the expression of Epcr and Mpl. The bars summarize the Epcr expression on the Mpl+ population of the LSK cells. In the absence of Thpo, there is no positive correlation of Epcr and Mpl. MFI, median fluorescence intensity.
Discussion
In our study, we made use of lentiviral transduction and BM transplantations in Mpl−/− mice to investigate whether selected Thpo/Mpl-signaling–related genes would rescue the aplastic phenotype in these mice. Among the 5 genes tested, we found Epcr to enrich HSCs and enable secondary transplantation. Furthermore, we show that Epcr expression was maintained by Thpo in vitro, and that Epcr expression supported engraftment, possibly by establishing a quiescent HSC pool early after transplantation. As we did not test the number of repopulating HSCs (by single-cell transplantation), we cannot definitively quantify the enrichment of HSCs with repopulation potential but demonstrate the increase of cells with a surface phenotype characteristic to LT-HSCs,25 also in the secondary recipients. By back calculation of input-to-output HSC numbers based on their cell-surface phenotype, an improved expansion of these HSCs in the secondary recipients compared with the Mpl−/− uncorrected cells was evident.
Most of our current knowledge on Epcr function is based on studies in endothelial cells and the coagulation pathway. In the anticoagulation pathway, Epcr binds and presents protein C (PC) to the thrombin:thrombomodulin complex, which leads to aPC with proteolytic activity to inactivate coagulation factors Va and VIIIa. In a cellular context, the aPC/Epcr/Par-1 axis accounts for the cytoprotective effect of endothelial cells in damaged tissues inducing anti-apoptotic and anti-inflammatory responses. The same pathway maintained fetal liver (FL)-HSCs in their perisinusoidal niche and prevented apoptosis of FL-HSCs in in vitro cultures.26 Transient overexpression of Bcl-xL in hematopoietic cells has been shown to prevent transplantation-induced apoptosis in mice and guaranteed LT engraftment although expression was only short-term.27 Thus, upregulated expression of Bcl-xL in Epcr-transduced Mpl−/− BM cells in our experiments might have supported HSC survival upon transplantation-induced stress. The aPC/Epcr/Par-1 pathway in LT-HSCs has also been associated with HSC mobilization and BM niche retention by the regulation of nitric oxide levels and the expression of adhesion molecules like integrin α4β1 (Vla4) in Epcr+ cells.20,28
Full HSC function is also associated with their cell-cycle status, with quiescent HSCs being most efficient in LT hematopoietic reconstitution.29,30 Nevertheless, to maintain or reestablish a constant LT-HSC pool, these cells also possess a strong self-renewal capacity. Both properties are affected by Thpo/Mpl signaling and correlate with differential expression of cell-cycle regulators,8,9 especially CIP/KIP family members of cyclin-dependent kinase inhibitors. In a murine leukemia model, Cdkn1a/21 was shown to be downstream of Par1 signaling.31 In our experiments, Cdkn1a/p21 expression (in some mice also Cdkn1c/p57) in LSK cells of transplanted mice of the Epcr group was upregulated to almost wt levels. In wt steady-state hematopoiesis, Epcr+ LT-HSCs resided predominantly in quiescence, independent of Mpl expression. These observations support the interpretation that Epcr maintained or induced HSC quiescence and compensated for some of the missing functions in Mpl−/− cells. In megakaryopoiesis, the second site of the manifestation of Mpl deficiency, we detected an increase of MKs in the BM with mature phenotype, however, platelet counts were only elevated in secondary recipients. Therefore, the rescue in MKs was only partial and further genes and pathways are needed to restore Mpl function for fully functional thrombopoiesis. Epcr expression also did not increase peripheral leukocyte counts.
In contrast to Epcr, expression of the other genes did not correct HSC numbers in Mpl−/− mice, although the selected genes have a clear preference of expression in LT-HSCs. This was especially surprising for the transcription factor Hoxa10, which had been shown to increase the repopulation potential of wt murine BM cells.32 However, efficient DNA binding of homeobox proteins is facilitated by cofactors, such as Meis1, which is also expressed with severely reduced levels in Mpl−/− HSCs. Meis1 is also a cofactor of Pbx1 and knockout of each of them had been connected to HSC defects.33 Similarly, we did not coexpress the Fzd4 coreceptor Lrp5, which may have hampered Wnt signaling. Considering that 4 of the genes could not correct the Mpl−/−-dependent HSC defects, although all 4 of them are clearly associated with the HSC phenotype, makes the observation that Epcr does enhance HSC numbers in the Mpl-deficient background even more remarkable.
Epcr expression has been described to mark LT-HSCs in mice and humans.34-36 Murine Epcr+/Sca1+ BM cells engrafted more efficiently in mice compared with Sca1+ and Sca1+/Epcr− BM cells.37 In the murine and human FL, Epcr+ LSK cells also hold the LT-reconstitution capacity.26,38 Our observations of Epcr-dependent efficient engraftment in both the Mpl−/− and wt background are in agreement with these reports. In addition, we demonstrate that expression of Epcr can rescue the engraftment defect in the Mpl-deficient situation. Therefore, aPC/Epcr can substitute some of the Thpo/Mpl signals, however, we could not verify Epcr as a direct Thpo-induced transcriptional target in vitro (data not shown). Instead, we show that Epcr cell-surface expression was maintained in vitro by Thpo and declines when Thpo was not supplemented. In combination with the superior engraftment of Epcr+ cells, this is a very interesting observation that can be exploited in the future, for example, for the transplantation of genetically modified cells that have to undergo in vitro manipulation for several days. Importantly, as a cell-surface complex, the aPC/Epcr/Par-1 axis is easily accessible for activation; it might be an interesting (new) target to support engraftment of in vitro–modified HSCs in gene and cell therapy.
The online version of this article contains a data supplement.
The publication costs of this article were defrayed in part by page charge payment. Therefore, and solely to indicate this fact, this article is hereby marked “advertisement” in accordance with 18 USC section 1734.
Acknowledgments
The authors thank Marion Wingerter (Central Animal Facility, Paul Ehrlich Institute) for excellent technical histologic assistance. The authors also thank Susanne Wingert (Department for Hematology/Oncology, Goethe University Frankfurt) and Melanie Grassl (Cell Sorting Facility, Paul Ehrlich Institute) for assistance with fluorescence-activated cell sorting. The lentiviral vector backbone (RRL.PPT.pre*) was kindly provided by Axel Schambach (Hannover Medical School).
This work was supported by the German Research Foundation (DFG) and the LOEWE Center for Cell and Gene Therapy, Frankfurt (HMWK III L 4-518/17.004 [2013]).
Authorship
Contribution: S.K., M.G.E.R., F.S., and K.C. performed and analyzed experiments; U.M. designed research; and U.M., S.K., and M.G.E.R. interpreted data and wrote the manuscript.
Conflict-of-interest disclosure: The authors declare no competing financial interests.
Correspondence: Ute Modlich, Research Group for Gene Modification in Stem Cells, Division of Veterinary Medicine, Paul Ehrlich Institute, 63225 Langen, Germany; e-mail: ute.modlich@pei.de.

This feature is available to Subscribers Only
Sign In or Create an Account Close Modal