

Key Points
Assessing pretreatment genomic aberrations improves risk stratification of FL independent of clinical/mutation markers.
Gain or cnLOH of 2p is correlated with 2-year progression; CDKN2A/B deletion with worse PFS; CREBBP and TP53 deletions predict worse OS.

Abstract
Although recent advances in molecular genetics have enabled improved risk classification of follicular lymphoma (FL) using, for example, the m7-FLIPI score, the impact on treatment has been limited. We aimed to assess the prognostic significance of copy-number aberrations (CNAs) and copy-neutral loss of heterozygosity (cnLOH) identified by chromosome genomic-array testing (CGAT) at FL diagnosis using prospectively collected clinical trial specimens from 255 patients enrolled in the SWOG study S0016. The impact of genomic aberrations was assessed for early progression (progressed or died within 2 years after registration), progression-free survival (PFS), and overall survival (OS). We showed that increased genomic complexity (ie, the total number of aberration calls) was associated with poor outcome in FL. Certain chromosome arms were critical for clinical outcome. Prognostic CNAs/cnLOH were identified: whereas early progression was correlated with 2p gain (P = .007; odds ratio [OR] = 2.55 [1.29, 5.03]) and 2p cnLOH (P = .005; OR = 10.9 [2.08, 57.2]), 2p gain specifically encompassing VRK2 and FANCL predicted PFS (P = .01; hazard ratio = 1.80 [1.14, 2.68]) as well as OS (P = .005; 2.40 [1.30, 4.40]); CDKN2A/B (9p) deletion correlated with worse PFS (P = .004, 3.50 [1.51, 8.28]); whereas CREBBP (16p) (P < .001; 6.70 [2.52, 17.58]) and TP53 (17p) (P < .001; 3.90 [1.85, 8.31]) deletion predicted worse OS. An independent cohort from the m7-FLIPI study was explored, and the prognostic significance of aberration count, and TP53 and CDKN2A/B deletion were further validated. In conclusion, assessing genomic aberrations at FL diagnosis with CGAT improves risk stratification independent of known clinical parameters, and provides a framework for development of future rational targeted therapies.
Introduction
Follicular lymphoma (FL) is a heterogeneous disease with variable outcomes. Despite modern therapy with frontline anthracycline and routine use of monoclonal antibodies such as rituximab, and an overall survival (OS) of 10 years in almost 80% of patients,1 20% to 30% of FL patients will experience disease progression within 2 years of diagnosis or treatment.2 These patients have markedly inferior outcome and can benefit from accurate risk assessment prior to treatment.3-5 Several pretreatment risk-assessment methods exist, most of which focus on clinical parameters: the best validated is the Follicular Lymphoma International Prognostic Index (FLIPI),6 which assesses age, Ann Arbor stage, number of nodal sites involved, hemoglobin levels, and serum lactate dehydrogenase (LDH) levels; FLIPI-2 evaluates age, hemoglobin levels, longest diameter of largest involved lymph node, β-2 microglobulin (β2M) levels, and bone marrow involvement7 ; [18F]fluorodeoxyglucose positron emission tomography (PET) has been shown to predict clinical outcome in FL patients with high tumor burden.8 A simplified clinical scoring system, called the PRIMA-Prognostic Index, has recently been proposed, which considers only bone marrow involvement and β2M.9 Although robust, these clinical scoring systems are limited in clinical utility and have not yet informed a precision approach to treatment.
Integration of tumor genomic aberrations has been shown to improve FL prognosis. Recent effort by Pastore et al presented a clinicogenetic risk model, the m7-FLIPI score, which included the mutation status of 7 genes (EZH2, ARID1A, MEF2B, EP300, FOXO1, CREBBP, and CARD11), the FLIPI, and Eastern Cooperative Oncology Group (ECOG) performance status.10 The m7-FLIPI score refines the high-risk group, defining a relatively small group of patients with poor outcomes. Four factors within the m7-FLIPI system, including high-risk FLIPI, and nonsilent mutations in EP300, FOXO1, and EZH2, were also part of the Progression of Disease within 24 months (POD24) Prognostic Index (POD24-PI), a clinicogenetic risk model that predicted early progression.5 In addition, Huet et al published a 23-gene expression-based predictor for risk stratification of FL patients at diagnosis.11
Besides pathogenic single-nucleotide variant and aberrant gene expression, FL is known to harbor microscopic or submicroscopic chromosomal aberrations in virtually all cases; and some have been shown to have prognostic impact.12 Yet, none of these aberrations are currently used in clinic for risk stratification or to guide treatment decisions. S0016 compared 6 cycles of cyclophosphamide, doxorubicin, vincristine, prednisone (CHOP) plus rituximab (CHOP-R) with 6 cycles of CHOP followed by iodine 131I tositumomab radioimmunotherapy (CHOP-RIT) for patients with advanced-stage FL. The recent 10-year update on follow-up outcome demonstrated better progression-free survival (PFS), but not OS, in the radioimmunotherapy arm.1 We previously showed that lactate dehydrogenase, β2M, and FLIPI scores were significantly correlated with outcome,13 but histological grades were not.14 In this study, we aimed to identify clinically useful genomic aberrations by chromosomal genomic-array testing (CGAT) to help predict patients who will progress within 2 years and who will have worse PFS and OS.
Methods
Patient samples
A total of 255 formalin-fixed paraffin-embedded (FFPE) lymphoma tissue specimens that were available from the SWOG S0016 trial were obtained for the current study without further selection (Figure 1). A total of 247 samples (96.9%) yielded sufficient DNA, all of which generated analyzable CGAT data. One patient withdrew consent and was excluded from all analyses. Table 1 displays the demographics of the remaining 246 patients. PFS was defined as the time from registration to the first observation of progression or death as a result of any cause.15 For the analysis on early progression (progression or death within 2 years after registration), 1 additional patient was excluded, who withdrew consent after 50 days from registration. This study was approved by the institutional review board of Fred Hutchinson Cancer Research Center.
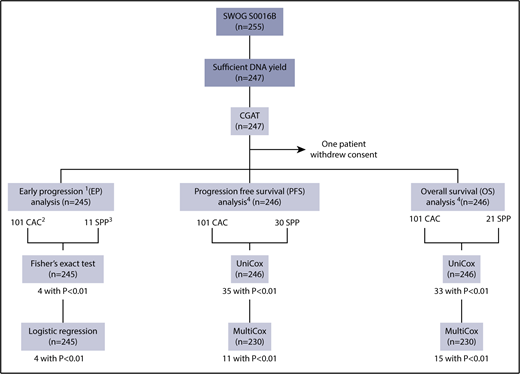
Study overview. 1. Early progression is defined as progression or death within 2 years after registration. One additional patient was excluded from this set of analyses, who withdrew consent after 50 days from registration. 2. CAC seen in >5 patients. 3. Regions identified through SPP analysis with log-rank statistics using Nexus (see “Methods”). P < .01 was used as a cutoff for the Fisher exact test for early progression, and univariate and multivariate Cox analyses for PFS and OS.
Study overview. 1. Early progression is defined as progression or death within 2 years after registration. One additional patient was excluded from this set of analyses, who withdrew consent after 50 days from registration. 2. CAC seen in >5 patients. 3. Regions identified through SPP analysis with log-rank statistics using Nexus (see “Methods”). P < .01 was used as a cutoff for the Fisher exact test for early progression, and univariate and multivariate Cox analyses for PFS and OS.
Patient demographics
| All patients, N = 246 | CHOP alone, N = 11 | CHOP-R,* N = 107 | CHOP-RIT,* N = 128 | |
|---|---|---|---|---|
| Age, median (min, max), y | 54 (24, 82) | 57 (38, 76) | 55 (31, 81) | 53 (24, 82) |
| <60, n (%) | 175 (71) | 7 (64) | 74 (69) | 94 (73) |
| Male, n (%) | 140 (57) | |||
| Non-Hispanic, n (%) | 218 (89) | |||
| White, n (%) | 222 (90) | |||
| Performance status, n (%) | ||||
| 0 | 180 (73) | |||
| 1 | 50 (20) | |||
| 2 | 4 (2) | |||
| FL grade, n (%) | ||||
| I/II | 205 (83) | |||
| III | 39 (16) | |||
| B symptoms, n (%) | 61 (25) | |||
| Stage III-IV, n (%) | 242 (98) | 11 (100) | 105 (98) | 126 (98) |
| Bulky disease, n (%) | 57 (23) | 2 (18) | 19 (18) | 36 (28) |
| Elevated serum β2M, n (%) | 148 (60) | 3 (27) | 64 (60) | 81 (63) |
| LDH (U/I),†n (%) | ||||
| Normal | 181 (74) | 8 (73) | 80 (75) | 93 (73) |
| Elevated | 60 (24) | 3 (27) | 23 (21) | 34 (27) |
| Serum β2M and LDH,†n (%) | ||||
| Low | 79 (32) | 7 (64) | 30 (28) | 42 (33) |
| Medium | 118 (48) | 2 (18) | 60 (56) | 56 (44) |
| High | 44 (18) | 2 (18) | 13 (12) | 29 (23) |
| FLIPI risk,†n (%) | ||||
| Low | 68 (28) | 29 (27) | 39 (30) | |
| Intermediate | 105 (43) | 52 (49) | 53 (41) | |
| High | 62 (25) | 26 (24) | 36 (28) | |
| Early progression,‡ n (%) | 55 (22) | 6 (55) | 26 (24) | 23 (18) |
| 5-y PFS, n (%) | 161 (61) | 3 (27) | 66 (62) | 83 (65) |
| 5-y OS, n (%) | 213 (87) | 10 (91) | 98 (92) | 108 (84) |
| Progression/death, n (%) | 126 (51) | 9 (82) | 59 (55) | 58 (45) |
| Follow-up for PFS, median (min, max), mo | 89 (1, 173) | 24 (11, 151) | 86 (7, 173) | 95 (1, 157) |
| Follow-up for OS, median (min, max), mo | 114 (2, 177) | 135 (47, 177) | 116 (12, 175) | 111 (2, 175) |
CHOP-R, 6 cycles of CHOP chemotherapy at 3-week intervals with 6 doses of rituximab; CHOP-RIT, 6 cycles of CHOP followed by consolidation with iodine 131I tositumomab radioimmunotherapy.
LDH is not available from 5 patients, 4 on CHOP-R, and 1 on CHOP-RIT; FLIPI risk is not available from 11 patients, all on CHOP alone.
Early progression is defined as progression or death within 2 years after registration.
CGAT
For each specimen, tissue curls were sectioned from areas on the block deemed to contain at least 30% tumor by a SWOG pathologist. Genomic DNA was isolated using the QIAamp DSP DNA FFPE Tissue kit (Qiagen, Valencia, CA) and measured using the Qubit dsDNA HS Assay kit (Thermo Fisher, Waltham, MA). A total of 96-ng double-stranded DNA was used per assay. CGAT was performed using the OncoScan FFPE assay kit (ThermoFisher). Data curation was performed on Nexus by a board-certified clinical cytogeneticist.
Candidate aberrations for outcome analyses
Candidate aberrations to be analyzed for clinical outcome were identified via 2 complementary approaches: chromosome arm–based aberration code (CAC) and survival predictive power (SPP) analysis. Briefly, the CAC approach identified critical chromosome arms without further distinguishing the location of the aberrations within the same arm, whereas the SPP approach revealed important genomic segments within a given chromosome arm that are prognostically significant. Details are described in supplemental Methods (available on the Blood Web site).
Early progression: Fisher exact test and logistic regression
The Fisher exact test was applied to compare the difference in distribution of early progressors (who progressed or died within 2 years after registration) among patients with or without a given CAC or SPP (Figure 1). Those observed to be significant were further analyzed using logistic regression for early progression (Table 2). Considering that multiple variables were tested, α value was set to 0.01.
Aberrations significant for early progression identified by Fisher exact test (P < .01)
| Hg19 coordinates | Size, bp | Aberration | n (%) | Fisher exact test | Multivariate logistic model | ||||||||
|---|---|---|---|---|---|---|---|---|---|---|---|---|---|
| Early progression, n (%) | P | OR | 95% CI | RC | SE | P | OR | 95% CI | |||||
| Absent | Present | ||||||||||||
| chr2p:58 999 505-59 187 207 | 187 703 | Gain | 49 (20) | 36 (18) | 19 (39) | .0038 | 2.80 | (1.3, 5.8) | 0.94 | 0.35 | .007 | 2.55 | (1.29, 5.03) |
| chr2p:59 467 016-59 825 992 | 358 977 | Gain | 52 (21) | 36 (19) | 19 (37) | .0086 | 2.50 | (1.2, 5.1) | |||||
| chr2p:59 846 982-60 471 823 | 624 842 | Gain | 54 (22) | 35 (18) | 20 (37) | .0054 | 2.61 | (1.3, 5.3) | |||||
| chr2p:57 275 499-59 260 307* | 1 984 809 | cnLOH | 8 (3) | 49 (21) | 6 (75) | .0020 | 11.36 | (2.0, 118.5) | 2.39 | 0.85 | .005 | 10.9 | (2.08, 57.2) |
OR, odds ratio; RC, regression coefficient; SE, standard error.
The last row denotes distal 2p cnLOH, which encompasses chr2p:57 275 499-59 260 307.
PFS and OS: univariate and multivariate Cox regression analyses
CAC and SPP were tested for PFS and OS via univariate Cox regression (univariate Cox; n = 246) analysis first, from which the significant ones were further analyzed using multivariable Cox regression (multivariate Cox; n = 230) with clinical covariates, including bulky disease, FLIPI risk,6 serum β2M, and elevated LDH level. Considering that multiple variables were tested, α value was set to 0.01 for both tests (Tables 3 and 4).
CAC associated with PFS and OS by univariate and multivariate Cox regression analyses (P < .01)
| CAC* | Aberration | n (%) | S0016B: Univariate Cox analysis, n = 246 | Multivariate Cox analysis,† n = 230 | ||||
|---|---|---|---|---|---|---|---|---|
| Location | P | HR | 95% CI | P | HR | 95% CI | ||
| PFS | ||||||||
| 17q | Gain | 45 (18) | .0064 | 1.76 | (1.17, 2.64) | .010 | 1.80 | (1.15, 2.70) |
| OS | ||||||||
| 2p | Gain | 60 (24) | .0024 | 2.35 | (1.36, 4.08) | .010 | 2.20 | (1.21, 3.93) |
| 2q | Deletion | 8 (3) | .0018 | 4.37 | (1.74, 11.03) | .002 | 4.80 | (1.77, 12.94) |
| 8q | Deletion | 9 (4) | .0001 | 5.40 | (2.30, 12.67) | .000 | 5.50 | (2.25, 13.69) |
| 16p | Deletion | 6 (2) | .0002 | 5.75 | (2.28, 14.52) | .000 | 6.70 | (2.52, 17.58) |
| 17p | Deletion | 23 (9) | .0024 | 2.91 | (1.46, 5.80) | .003 | 3.00 | (1.47, 6.31) |
| 22q | Deletion | 7 (3) | .0007 | 5.00 | (1.98, 12.65) | .001 | 5.70 | (2.07, 15.80) |
All CAC are larger than 1 Mb.
Multivariate Cox analysis was performed with clinical covariates, including bulky disease, FLIPI risk, serum β2M, and elevated LDH level.
SPP associated with PFS and OS by univariate and multivariate Cox analyses (P < .01)
| SPP | Size, bp | Aberration | n (%) | S0016B: Univariate Cox analysis, n = 246 | Multivariate Cox analysis,* n = 230 | ||||
|---|---|---|---|---|---|---|---|---|---|
| Genomic coordinates [hg19] (cancer gene) | P | HR | 95% CI | P | HR | 95% CI | |||
| PFS | |||||||||
| chr1q:174 534 242-175 945 964 | 1 411 723 | Gain | 45 (18) | .0028 | 1.85 | (1.23, 2.76) | <.0001 | 2.40 | (1.54, 3.60) |
| chr1q:186 786 032-188 822 614 | 2 036 583 | Gain | 47 (19) | .0039 | 1.80 | (1.21, 2.68) | <.0001 | 2.40 | (1.55, 3.59) |
| chr1q:188 836 200-189 407 527 | 571 328 | Gain | 47 (19) | .0039 | 1.80 | (1.21, 2.68) | <.0001 | 2.40 | (1.55, 3.59) |
| chr1q:223 686 766-228 558 892 (H3F3A) | 4 872 127 | Gain | 44 (18) | .0078 | 1.74 | (1.16, 2.61) | .000 | 2.20 | (1.44, 3.38) |
| chr2p:58 350 532-58 999 505 | 648 974 | Gain | 48 (20) | .0021 | 1.87 | (1.26, 2.78) | .010 | 1.80 | (1.14, 2.68) |
| chr4q:190 151 131-190 915 650 | 764 520 | Deletion | 7 (3) | .0008 | 3.74 | (1.73, 8.06) | .000 | 4.70 | (2.12, 10.37) |
| chr9p:21 944 544-21 971 352 (CDKN2A) | 26 809 | Deletion | 17 (7) | <.0001 | 3.04 | (1.76, 5.23) | .000 | 3.20 | (1.78, 5.58) |
| chr9p:22 549 702-23 132 263 | 582 562 | Deletion | 8 (3) | .0029 | 3.53 | (1.54, 8.10) | .004 | 3.50 | (1.51, 8.28) |
| chr15q:60 573 491-61 048 578 | 475 088 | Deletion | 10 (4) | .0042 | 2.88 | (1.40, 5.95) | .0048 | 3.10 | (1.41, 6.84) |
| chr17q:61 872 037-62 042 841 (CD79B) | 170 805 | Gain | 42 (17) | .0098 | 1.73 | (1.14, 2.62) | .010 | 1.80 | (1.15, 2.74) |
| OS | |||||||||
| chr2p:58 350 532-58 999 505 | 648 974 | Gain | 48 (20) | .0006 | 2.69 | (1.53, 4.71) | .005 | 2.40 | (1.30, 4.40) |
| chr2p:59 846 982-60 471 823 | 624 842 | Gain | 54 (22) | .0013 | 2.49 | (1.43, 4.34) | .007 | 2.30 | (1.26, 4.16) |
| chr5q:106 531 735-112 728 044 (APC) | 5 554 932 | Deletion | 8 (3) | .0026 | 4.12 | (1.64, 10.37) | .000 | 7.00 | (2.62, 18.95) |
| chr8p:32 662 782-34 324 581 | 1 661 800 | Deletion | 9 (4) | .0025 | 4.15 | (1.65, 10.47) | .0058 | 3.80 | (1.47, 9.67) |
| chr16p:2 838 274-6 941 015 (CREBBP) | 3 760 316 | Deletion | 6 (2) | .0002 | 5.75 | (2.28, 14.52) | .000 | 6.70 | (2.52, 17.58) |
| chr17p:7 394 281-8 225 873 (TP53) | 831 593 | Deletion | 21 (9) | .0005 | 3.39 | (1.70, 6.76) | .0004 | 3.90 | (1.85, 8.31) |
| chr17p:18 250 455-18 915 374 | 664 920 | Deletion | 14 (6) | .0001 | 4.43 | (2.07, 9.47) | .0003 | 4.90 | (2.06, 11.81) |
Multivariate Cox analysis was performed with clinical covariates, including bulky disease, FLIPI risk, serum β2M, and elevated LDH level.
Interaction between genomic aberration and treatment
The effect of CHOP-R and CHOP-RIT on PFS and OS was compared between patients with or without an abnormality. The CHOP-alone arm was excluded from this analysis given the limited number of patients. The P value was calculated based on Cox regression for the effect of the aberration, treatment, and the interaction between the 2. After patients were grouped based on genomic aberration, the hazard ratio (HR) with 95% confidence interval (CI) was given for CHOP-RIT compared with CHOP-R.
Statistical considerations for multiple comparisons
The analysis strategy above, although well specified, is exploratory in nature, both the final significance of the effects of the markers. The algorithms of the filtering for CAC vs SPP are different. There is no outcome adaptive selection with the initial selection of CAC because the filtering is based solely on frequency of the aberrations. Therefore, the selection at a nominal level of .01 would be expected to yield ∼.01 × CAC results. For the identification of SPP, Nexus uses the survival outcomes to select regions, which is an algorithm that does not yield easily adjustable type 1 error control. For consistency, the nominal type 1 error of .01 was chosen as for CAC to select/filter for promising aberrations to be used for model building. Ultimately, unbiased estimates and P values will require a subsequent test data set. This was carried out for 4 of the SPP.
Validation of prognostic markers on an independent cohort
Prognostic markers were further tested using sequencing results from the m7-FLIPI study.10 Copy-number analysis was inferred using Nexus7.1 (BioDiscovery) after calculating the sequencing coverage using PICARD (http://broadinstitute.github.io/picard/) (see more detail in the legend to supplemental Figure 3). Coverages were normalized over GC content using a Lowess regression. Four genes targeted by sequencing in the m7-FLIPI study were among the final list of prognostic SPP markers in our study (Table 4): CREBBP, TP53, CDKN2A, and CD79B. Kaplan-Meier analysis was performed to investigate the prognostic significance of copy-number aberrations (CNAs) of these genes with PFS and OS in FL patients from the German Low-Grade Lymphoma trial (GLSG2000) and the BC Cancer cohorts.
Data-sharing statement
For original data, please contact M.F. (mfang@fredhutch.org).
Results
Patient demographic and clinical characteristics
The patients included in this study account for almost half of the SWOG S0016 cohort (n = 546). Of the 246 patients analyzed (Table 1), B symptoms were evident in 61 (25%); 39 patients (16%) had follicular grade 3; 62 patients (25%) had high FLIPI risk; and 55 (22%) had early progression. In the entire SWOG S0016 cohort, B symptoms, FL grade 3, high FLIPI risk, and early progression were found in 27%, 16%, 24%, and 22% patients, respectively. Overall clinical outcomes were similar between the entire S0016 cohort (10-year estimated PFS, 49%; and OS, 78%) and this subset (10-year estimated PFS, 49% [120 patients; median, 7.4 years, ranging from 1 month to 14.4 years]; and OS, 78% [193; 9.5 years, 2 months to 14.8 years]).1 A total of 11, 107, and 128 patients were assigned on the CHOP, CHOP-R, and CHOP-RIT treatments, respectively.
FL overall genome complexity and clinical outcome
Most FL genome showed multiple abnormalities. As many as 242 of the 246 samples (98.4%) were abnormal by CGAT, and most of the genomes were complex (median abnormality count, 8; range, 1-64; Figure 2A). Some aberrations were highly frequent (Figure 2B), such as: large (>1 Mb) deletions in 6q (33%), 1p (23%), and 10q (20%); large gains in 18 (30%), X (25%), 7 (24%), 2p (24%), and 1q (24%); and copy-neutral loss of heterozygosity (cnLOH) of 1p (30%), 16p (25%), and 6p (20%).

Summary of genomic aberrations in FL identified by CGAT. (A) Histogram of total aberration count per patient. (B) Aggregate view of aberrations, including gain (blue), deletion (red), and cnLOH (gold), demonstrating the frequency (y-axis) of aberration on each chromosome (x-axis).
Summary of genomic aberrations in FL identified by CGAT. (A) Histogram of total aberration count per patient. (B) Aggregate view of aberrations, including gain (blue), deletion (red), and cnLOH (gold), demonstrating the frequency (y-axis) of aberration on each chromosome (x-axis).
Increased genomic complexity is associated with worse clinical outcome. Patients were divided into 3 groups based on the total aberration count: counts of 6 and 12 were chosen as the cutoffs to achieve the most even distribution of patients possible among the groups. As the total count of aberration increased, so did the percentage of early progression. As a result, 16% of patients with 5 or fewer aberrations (12 of 76) progressed within 2 years, compared with 19% of patients with 6 to 11 aberrations (17 of 91), and 33% of patients with 12 or more aberrations (26 of 78) (P = .022). Kaplan-Meier analyses showed that increased aberration count was also associated with worse PFS and OS (Figure 3A-B). Because groups with “5 or fewer” and “6 to 11” had similar survival outcomes, we combined the 2 groups into 1. These patients showed significantly lower frequency of early progression (17%; P = .008) and better PFS and OS (Figure 3C-D), compared with those with 12 or more aberrations. Therefore, higher genomic complexity may be defined as 12 or more genomic aberrations identified.

Higher genomic complexity is associated with worse survival. Kaplan-Meier analysis was performed to investigate the association between complexity of the genome (total number of aberrations) and the clinical outcome. (A-B) PFS and OS comparisons among patients categorized into 3 groups based on total aberration counts. (C-D) Comparisons between patients with the highest aberration counts (12 or more) and all others.
Higher genomic complexity is associated with worse survival. Kaplan-Meier analysis was performed to investigate the association between complexity of the genome (total number of aberrations) and the clinical outcome. (A-B) PFS and OS comparisons among patients categorized into 3 groups based on total aberration counts. (C-D) Comparisons between patients with the highest aberration counts (12 or more) and all others.
Chromosome arms critical for clinical outcome
Chromosome arms critical for clinical outcome were identified using analyses that grouped aberrations based on chromosome locations (CAC). Our analysis showed prognostic significance of large CNAs (>1 Mb) and cnLOH at the following locations, which passed all statistical filters (Tables 2 and 3): cnLOH of 2p predicted early progression; gain on 17q was associated with inferior PFS; and gain on 2p and deletion on 2q, 8q, 16p, 17p, and 22q were associated with worse OS. Smaller CNAs were also evaluated. However, these were less frequent in the FL genome, and only very small deletion on 9p (100-500 kb) was noted to predict worse PFS (univariate Cox analysis, P = .02; HR = 2.30; 95% CI [1.17, 4.54]).
Lesions in specific genomic regions and clinical outcome
Key subregions on chromosome arms were identified via SPP analysis. A total of 212, 442, and 402 SPP (each present in 6 or more patients) were identified for early progression, PFS, and OS, respectively. Visualization of SPP on the genome browser (supplemental Figure 1) revealed critical subregions within chromosome arms. Many segmental gains/deletions were significant for multiple types of outcome, including gain in 17q, and deletion in 4q, 8p, 16p, 17p, and 22q. The +2p16.3-p13.3, −9p21.3, −15q22.2, and −Yp11.2 were associated with all 3 types of outcomes. Of all the cnLOH identified, only 2p cnLOH was associated with early progression.
Table 4 and Figures 4 and 5 show SPP selected from these subregions that passed all statistical filters and are associated with poor clinical outcome (see detailed description in supplemental Results).
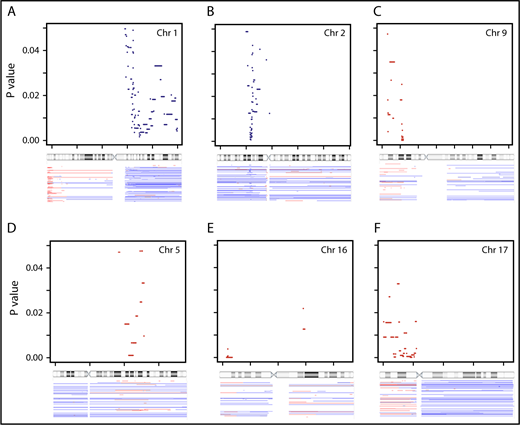
Genomic aberrations associated with PFS and OS identified using SPP analysis (P < .05). PFS predicting SPP on chromosomes (Chr) 1 (A), 2 (B), and 9 (C); OS predicting SPP on chromosomes 5 (D), 16 (E), and 17 (F). These are regions identified through SPP analysis with log-rank statistics using Nexus. The top portion of each panel displays the genomic location with reference to chromosome ideogram (x-axis) and the P value (y-axis, ranging from 0 to .05). The bottom portion of each panel displays the aberrations seen in the cohort. Blue denotes gain and red denotes deletion.
Genomic aberrations associated with PFS and OS identified using SPP analysis (P < .05). PFS predicting SPP on chromosomes (Chr) 1 (A), 2 (B), and 9 (C); OS predicting SPP on chromosomes 5 (D), 16 (E), and 17 (F). These are regions identified through SPP analysis with log-rank statistics using Nexus. The top portion of each panel displays the genomic location with reference to chromosome ideogram (x-axis) and the P value (y-axis, ranging from 0 to .05). The bottom portion of each panel displays the aberrations seen in the cohort. Blue denotes gain and red denotes deletion.

Genomic aberrations may be associated with both PFS and OS. (A-B) Gain in 2p (encompassing VRK2, FANCL, and LINC01122); (C-D) gain in 1q (H3F3A); and (E-F) deletion in 17p (TP53). Patients were grouped based on the presence (red) or absence (blue) of the aberration. Kaplan-Meier analysis was performed to investigate the association between the aberration and clinical outcome, including PFS (A,C,E) and OS (B,D,F). N.S., not significant.
Genomic aberrations may be associated with both PFS and OS. (A-B) Gain in 2p (encompassing VRK2, FANCL, and LINC01122); (C-D) gain in 1q (H3F3A); and (E-F) deletion in 17p (TP53). Patients were grouped based on the presence (red) or absence (blue) of the aberration. Kaplan-Meier analysis was performed to investigate the association between the aberration and clinical outcome, including PFS (A,C,E) and OS (B,D,F). N.S., not significant.
Treatment-arm effect on clinical outcome
Most genomic aberrations did not show a treatment-arm effect. However, when large deletion (>1 Mb) is present on 16p, treatment with CHOP-RIT may be associated with better clinical outcome compared with CHOP-R. Six patients showed large 16p deletions, all of which encompassed [hg19] chr16p: 2838274-6941015, including TNFRSF12A and CREBBP. This deletion was associated with better PFS (HR, 0.02; P = .003; 95% CI, 0.002-0.266) and superior OS (HR, 0.06; P = .02; 95% CI, 0.005-0.671) when comparing the CHOP-RIT arm with CHOP-R.
Prognostic markers and genomic complexity
The majority of the prognostic markers were associated with increased genomic complexity (Table 5). The Student t test showed that all aberrations significant by multivariate Cox analysis, except 4q and 5q, were associated with higher aberration count.
Association between prognostic markers and genomic complexity
| Genomic location [hg19] | Size, bp | Aberration | n (%) | Median aberration count | P* | |
|---|---|---|---|---|---|---|
| Absent | Present | |||||
| PFS markers | ||||||
| chr1q:174 534 242-175 945 964 | 1 411 723 | Gain | 45 (18) | 7 | 16 | 1.07E-06 |
| chr1q:186 786 032-188 822 614 | 2 036 583 | Gain | 47 (19) | 7 | 16 | 4.99E-07 |
| chr1q:188 836 200-189 407 527 | 571 328 | Gain | 47 (19) | 7 | 16 | 4.99E-07 |
| chr1q:223 686 766-228 558 892 | 4 872 127 | Gain | 44 (18) | 7 | 16.5 | 1.02E-06 |
| chr2p:58 350 532-58 999 505 | 648 974 | Gain | 48 (20) | 7 | 14 | 1.24E-05 |
| chr4q:190 151 131-190 915 650 | 764 520 | Deletion | 7 (3) | 8 | 15 | N.S. |
| chr9p:21 944 544-21 971 352 | 26 809 | Deletion | 17 (7) | 8 | 17 | .01169 |
| chr9p:22 549 702-23 132 263 | 582 562 | Deletion | 8 (3) | 8 | 18 | .00634 |
| chr15q:60 573 491-61 048 578 | 475 088 | Deletion | 10 (4) | 8 | 14.5 | .02538 |
| 17q | >1 M | Gain | 45 (18) | 7 | 14 | 3.41E-05 |
| chr17q:61 872,037-62 042 841 | 170 805 | Gain | 42 (17) | 7 | 14 | 4.76E-05 |
| OS markers | ||||||
| 2p | >1 M | Gain | 60 (24) | 7 | 13.5 | 6.63E-07 |
| chr2p:58 350 532-58 999 505 | 648 974 | Gain | 48 (20) | 7 | 14 | 1.24E-05 |
| chr2p:59 846 982-60 471 823 | 624 842 | Gain | 54 (22) | 7 | 14 | 1.32E-06 |
| 2q | >1 M | Deletion | 8 (3) | 8 | 18.5 | 7.84E-03 |
| chr5q:106 531 735-112 728 044 | 5 554 932 | Deletion | 8 (3) | 8 | 7 | N.S. |
| chr8p:32 662 782-34 324 581 | 1 661 800 | Deletion | 9 (4) | 8 | 29 | .01362 |
| 8q | >1 M | Deletion | 9 (4) | 8 | 19 | .01323 |
| 17p | >1 M | Deletion | 23 (9) | 7 | 18 | 1.82E-04 |
| chr17p:7 394 281-8 225 873 | 831 593 | Deletion | 21 (9) | 7 | 18 | 4.96E-04 |
| chr17p:18 250 455-18 915 374 | 664 920 | Deletion | 14 (6) | 8 | 18 | 5.72E-03 |
| 16p | >1 M | Deletion | 6 (2) | 8 | 31.5 | .02373 |
| chr16p:2 838 274-6 941 015 | 3 760 316 | Deletion | 6 (2) | 8 | 31.5 | .02373 |
| 22q | >1 M | Deletion | 7 (3) | 8 | 23 | .01145 |
N.S., not significant.
Welch unequal variances Student t test.
Partial validation using FL cohort from the m7-FLIPI study
To validate the identified markers in an independent cohort, we analyzed the GLSG2000 and BC Cancer cohorts used for the m7-FLIPI study. Four genes were common between our final list of markers and the genes targeted by next-generation sequencing (NGS), from which copy-number data at these loci were inferred. In the m7-FLIPI cohort, deletion of CDKN2A (9p, 9 of 258 patients [3.5%]) and TP53 (17p, 16 of 258 [6.2%]) both correlated with inferior PFS (P < .05, pairwise log-rank test; Figure 6A-B); but gain of CD79B (17q, 30 of 258 [11.6%]; supplemental Figure 3) and deletion of CREBBP (16p, 9 of 258 [3.5%]) did not. When all 4 genes were evaluated, patients with at least 2 abnormalities (14 of 258 [5.4%]) had significantly poorer PFS than the others (Figure 6C), which is consistent with our observation (Figure 6D). There was no significant impact on OS.
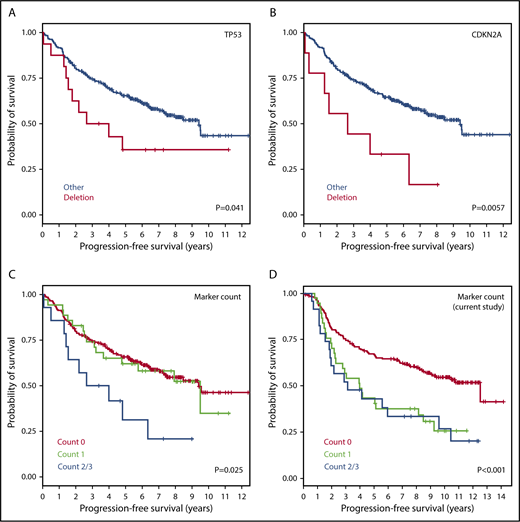
Validation of 4 prognostic markers using CNAs inferred from independent data sets (GLSG2000 + BC Cancer). Kaplan-Meier curves for PFS are presented for (A) TP53 deletion, (B) CDKN2A deletion, (C) total aberration count among the 4 markers inferable from the m7-FLIPI study, and (D) total aberration count among the same markers in the current study. The 4 markers are deletions of TP53, CDKN2A, and CREBBP, and gain of CD79B.
Validation of 4 prognostic markers using CNAs inferred from independent data sets (GLSG2000 + BC Cancer). Kaplan-Meier curves for PFS are presented for (A) TP53 deletion, (B) CDKN2A deletion, (C) total aberration count among the 4 markers inferable from the m7-FLIPI study, and (D) total aberration count among the same markers in the current study. The 4 markers are deletions of TP53, CDKN2A, and CREBBP, and gain of CD79B.
Genetic markers reduced the significance of clinical prognosticators
To understand the significance of genetic markers in the context of standard clinical prognosticators for FL, we conducted analyses using both clinical factors (bulky disease, FLIPI risk, serum β2M and elevated LDH level) and a summary measure of the counts of aberrations (positive for 0, 1, 2, or ≥3 prognostic aberrations for a given outcome, as shown in Tables 3 and 4). Our results showed that the genetic lesions reduce the prognostic significance of clinical prognosticators. For the 230 patients with complete data for both genetic and clinical factors, the analyses showed the following: for PFS, without the aberration count, the joint impact of the clinical prognosticators is highly significant (P < .0001); after accounting for aberration count, the prognostic effect is reduced or no longer significant (P = .69). For OS, without the aberration count, the joint impact of the clinical prognosticators is less pronounced (P < .036); after accounting for aberration count, the prognostic effect is reduced and no longer significant (P = .091).
We further evaluated the 4 genetic markers used for validation in the GLSG2000/BC Cancer cohorts (deletions of TP53, CDKN2A, and CREBBP and gain of CD79B) by assessing whether the genomic aberration count would predict survival after the FLIPI score has been applied (Figure 7). Patients positive for at least 2 of the 4 markers did worse in both the S0016 cohort and the GLSG2000/BC Cancer cohorts. The statistical significance was achieved from patients with a FLIPI score of 0 or 1 in S0016 and those with a FLIPI score of 2 in the GLSG2000/BC Cancer cohorts. Similar results were observed for OS for the S0016 cohort but not for the GLSG2000/BC Cancer cohorts (supplemental Figure 4).
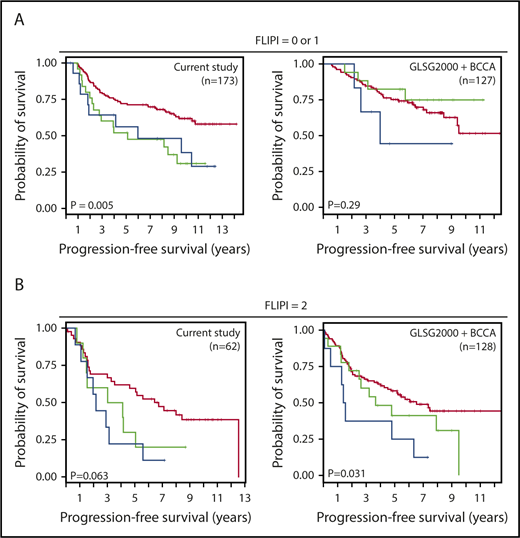
Genetic markers further stratified patients after FLIPI risks have been applied. Four genetic markers were used to generate an aberration count, including deletions of TP53, CDKN2A, and CREBBP, and gain of CD79B. Kaplan-Meier analyses of the prognostic significance of the aberration count in FL patients with (A) low FLIPI risk (score = 0 or 1) and (B) high FLIPI risk (score = 2). Red, green, and blue lines denote patients positive for 0, 1, or at least 2 markers, respectively.
Genetic markers further stratified patients after FLIPI risks have been applied. Four genetic markers were used to generate an aberration count, including deletions of TP53, CDKN2A, and CREBBP, and gain of CD79B. Kaplan-Meier analyses of the prognostic significance of the aberration count in FL patients with (A) low FLIPI risk (score = 0 or 1) and (B) high FLIPI risk (score = 2). Red, green, and blue lines denote patients positive for 0, 1, or at least 2 markers, respectively.
Discussion
Pretreatment risk stratification methods are particularly important for both clinical trial design and actual clinical decision on frontline therapy. Clinical prognostic markers are helpful but are still of limited value in FL. The development of an integrated clinicogenomic model such as m7-FLIPI may provide better risk stratification for FL patients, although it did not fully accurately identify early progressing patients,5 and is not routinely used clinically. In our prospectively collected S0016 FL cohort, we demonstrated the prognostic utility of CGAT, a molecular genomic tool that is complementary to mutation testing for m7-FLIPI.
We demonstrated a clear association between inferior clinical outcome and increased genomic complexity in FL. This was proposed previously in DLBCL,16,17 although the criteria in calling aberration were different in each study. Monti et al specifically evaluated CNAs in genomic regions encompassing genes of the CDKN2A-TP53-RB-E2F axis and showed that any CNA in these regions predicted inferior OS in DLBCL.16 Dias et al proposed that CNA in a panel of genomic regions predicts outcome.17 Given the various criteria used to define “complex” genome, caution must be exercised when applying this parameter as a marker across different platforms and cohorts. We therefore focused on evaluating the prognostic significance of specific chromosome arms and subregions.
Among the final list of prognostically significant markers for FL (Tables 2-4), deletion of 17p is a known high-risk marker in multiple cancer types. Gain of 2p and 17q and deletion in 16p were shown previously to predict adverse clinical outcome in FL.18,19 Several novel prognostic markers emerged from this study, including 1q gain, 2p cnLOH, and deletions of 2q, 4q, 5q, 8p, 8q, 15 and 22.
These novel findings are of special interest. Gain of 1q is a frequent event in various types of malignancies, and is often regarded as a secondary event that occurs during disease progression.20-24 This may be true for lymphoma as well. In our study, although gains of several subregions on 1q are highly predictive for PFS, they are not correlated with early progression or OS (Figure 5D). Many genes are impacted by this gain, 1 of which is H3F3A, a histone family member. Somatic mutation of histone genes has been reported as a recurrent aberration in FL.25
Given the known significance of 2p gain in lymphoma pathogenesis26,27 and FL transformation,18 it is possible that gain and cnLOH of 2p provide the lymphoma cells with similar growth advantage via increasing the allelic ratio of pathogenic mutations. Although it is uncertain which are the critical genes on 2p, several in 2p15-p16.1 are noteworthy: FANCL, BCL11A, REL, and XPO1. Some of these are members of the NF-κB/B-cell receptor (BCR) pathway and the SWItch/Sucrose Non-Fermentable (SWI/SNF) complex important in FL.25 Both 2p gain and 2p cnLOH are strong indicators of 2-year progression in this study, underscoring the importance of this genomic region. The prevalence of 2p gain and cnLOH is ∼20% in S0016, consistent with the rate of 2-year progression in FL patients by most published studies.2
All 4q deletions in S0016 cohort encompassed tumor suppressor FAT1. Recurrent mutation of FAT1 was reported in early T-cell precursor acute lymphoblastic leukemia.28 The SPP on 5q leads to deletion of tumor-suppressor gene APC, the role of which is well known and extensively studied in colorectal cancer.
The 8q deletion is identified to associate with poor clinical outcome regardless of base-pair location in this study. Careful examination of all affected cases revealed recurrent deletion at the TOX gene locus (supplemental Figure 2). Although no specific subregion on 8q passed all of our statistical filters, the segment encompassing TOX, [hg19] chr8:59878580-60375901, should be noted (univariate Cox analysis, P < .001; multivariate Cox analysis, P = .0162). The significance of TOX deletion on 8q for FL is not clear, nor is it well known in any type of cancer. The TOX gene encodes high-mobility group box proteins, which may induce a sharp bend in DNA, regulate gene transcription, and play important roles in T-cell development.29
Our study generated more knowledge for the previously reported FL prognostic markers. The 17q gain was a recurrent aberration in S0016 FL patients and predicted worse PFS. Kwiecinska et al showed that 17q21.33 amplification was exclusively found in transformed diffuse large B-cell lymphoma and never in FL.18 For the majority of patients with 17q gain in our cohort, many genes were affected due to the large size of the aberration. Among them, the BCR gene CD79B is known to be frequently mutated in B-cell lymphoma, including FL.25,30 CD79B was also 1 of the NF-κB/BCR-signaling genes with recurrent mutations documented in FL.31 The overexpression of CD79B in vitro correlated with decreased susceptibility to Bruton tyrosine kinase and SYK inhibitors in mantle cell lymphoma cells.32 The 9p deletion (CDKN2A/B) was reported to predict inferior OS in FL.33 Inactivation mutation of acetyltransferase gene CREBBP (16p) was proposed as an important pathogenetic mechanism in B-cell lymphoma,19 and is among the high-risk markers in the m7-FLIPI model.10 Along with EZH2 and KMT2D, CREBBP is 1 of the chromatin-modifying genes. Mutations of these genes are now considered a hallmark of FL.34 The 17p deletion, leading to haploinsufficiency of the tumor-suppressor gene TP53, is a well-known high-risk marker.
The multivariate analyses results (Tables 3 and 4) demonstrated that the genomic aberrations identified clearly added value to the clinical variables currently used for prognosis. In addition, we showed that when prognostic genetic aberrations were considered, the significance of clinical prognosticators was reduced or no longer significant.
Our results were verified using an independent FL cohort from the m7-FLIPI study. Due to technical differences between CGAT and NGS, only 4 markers from our study could be investigated using the m7-FLIPI data. Nevertheless, this partial validation showed results that supported our findings: worse PFS is associated with TP53 and CDKN2A deletion, as well as the coexistence of 2 or more markers. The significance of marker counts remained in some subgroups of patients after FLIPI risks have been applied. This partial validation provides confidence in the validity of the approach used and results obtained from this study. Future study is needed to validate all remaining candidate markers identified in this study in independent FL patient cohorts. Therefore, prognostic significance regarding the genomic markers other than the validated ones need to be interpreted with caution. In addition, SWOG S0016 did not apply the standard of care in both arms. Based on the equivalent outcome between the CHOP-R and CHOP-RIT arms, we may infer that the prognostic significance of these markers would extend to FL patients treated with CHOP-R.1 Prospective studies on patients under the current standard of care, including a bendamustin-based regimen, will further strengthen the discovery of our study.
The aberrations that predict multiple types of clinical outcome are of special interest. Our study identified 2p gain, 9p deletion, and 15q deletion associated with early progression, PFS, as well as OS. Although OS is the gold standard to assess treatment efficacy in cancer, its utility is challenged in relatively indolent diseases. In many cancer types, PFS is a well-accepted parameter to assess treatment outcome. In FL, CR30 has been validated as a surrogate end point,35 and the utility of early progression (eg, progression of disease within 24 months) has also been proposed.36 In our partial validation with the m7-FLIPI cohort, the 4 markers with data for evaluation showed significance for PFS but only a trend for association with OS. Another limitation is the lack of correlative PET, molecular remission/relapse of disease, or minimal residual disease (MRD) data for the SWOG S0016 cohort. Valuable insights may be gained from future interaction studies of genomic lesions with PET and MRD.
It is noteworthy that markers on our final list were also associated with genomic complexity (Table 5). This close association suggests potential driver and passenger relationship between these events, as well as the feasibility of using a panel of genomic aberrations (dichotomized variable) as a surrogate for genomic complexity (continuous variable) during risk assessment in FL. It is also worth noting that no favorable prognostic marker was identified in this study whereas the m7-FLIPI study identified EZH2 mutation as associated with a good prognosis. This is consistent with the hypothesis that mutations are earlier events in FL pathogenesis and that genomic gains and deletions occur later. In solid tumors, increased genetic complexity is associated with response to immunotherapy with checkpoint inhibition.37 Based upon our findings, ongoing studies of checkpoint inhibitors in FL should analyze whether genetic complexity correlates with response.
In summary, our study identified genomic aberrations associated with early progression, PFS, and OS in a large cohort of pretreatment samples from patients enrolled in a prospective phase 3 chemoimmunotherapy trial for FL. The promising results will allow novel risk-predictive models to be developed and further validated in future studies. Our findings, with further validation, may be incorporated in prospective precision medicine trials in this complex, heterogeneous disease.
The online version of this article contains a data supplement.
The publication costs of this article were defrayed in part by page charge payment. Therefore, and solely to indicate this fact, this article is hereby marked “advertisement” in accordance with 18 USC section 1734.
Acknowledgments
The authors thank Oliver W. Press for his tremendous support throughout various stages of this study. The authors also thank the following staff members from the Cytogenetics laboratory at Seattle Cancer Care Alliance for specimen processing: Paul Laurent, Alyssa Ng, Scott McElhone, and Jacob Wilson. The authors also thank Christian Steidl and Randy Gascoyne from BC Cancer, Canada, as the principal investigators of the BC Cancer cohort.
This work was supported by the National Cancer Institute of the National Institutes of Health under award numbers CA015704, CA180888, CA180819, and CA180821, and was also supported by Affymetrix Inc (now part of Thermo Fisher Scientific), and GlaxoSmithKline.
The content is solely the responsibility of the authors and does not necessarily represent the official views of the National Institutes of Health, Affymetrix, or GlaxoSmithKline.
Authorship
Contribution: M.F. conceptualized the study and acquired samples and funding; O.P. was instrumental to the conception of this study together with M.F.; O.P. was the principal investigator of the SWOG S0016 trial; R.M.B. provided the specimens and performed pathology review; X.Q. carried out the OncoScan experiment and data curation, and identified prognostic markers for statistical assessment; H.L. and M.L. performed outcome statistical analysis on SWOG S0016; O.W. and V.P. performed validation study on the m7-FLIPI cohorts; R.K. provided the BC Cancer cohort data; X.Q., M.F., H.L., and M.L. wrote the manuscript; J.W.F. provided oversight and helpful advice for the study; and all authors edited and approved the final version of the manuscript.
Conflict-of-interest disclosure: M.F. received research funding from Affymetrix for this study. The remaining authors declare no competing financial interests.
Oliver Press died on 29 September 2017.
Correspondence: Min Fang, Fred Hutchinson Cancer Research Center, 825 Eastlake Ave E, MS: G7-500, Seattle, WA 98109-1023; e-mail: mfang@seattlecca.org.

This feature is available to Subscribers Only
Sign In or Create an Account Close Modal