

Key Points
UCH-L1 stimulates protein translation by associating with and enhancing assembly of the translation initiation complex.
UCH-L1 and its catalytic activity are essential for MYC induced lymphomas in mice.

Abstract
The mechanistic target of rapamycin (mTOR) is a central regulator of cellular proliferation and metabolism. Depending on its binding partners, mTOR is at the core of 2 complexes that either promote protein biosynthesis (mTOR complex 1; mTORC1) or provide survival and proliferation signals (mTORC2). Protein biosynthesis downstream of mTORC1 plays an important role in MYC-driven oncogenesis with translation inhibitors garnering increasing therapeutic attention. The germinal center B-cell oncogene UCHL1 encodes a deubiquitinating enzyme that regulates the balance between mTOR complexes by disrupting mTORC1 and promoting mTORC2 assembly. While supporting mTORC2-dependent growth and survival signals may contribute to its role in cancer, the suppression of mTORC1 activity is enigmatic, as its phosphorylation of its substrate 4EBP1 promotes protein biosynthesis. To address this, we used proximity-based proteomics to identify molecular complexes with which UCH-L1 associates in malignant B cells. We identified a novel association of UCH-L1 with the translation initiation complex eIF4F, the target of 4EBP1. UCH-L1 associates with and promotes the assembly of eIF4F and stimulates protein synthesis through a mechanism that requires its catalytic activity. Because of the importance of mTOR in MYC-driven oncogenesis, we used novel mutant Uchl1 transgenic mice and found that catalytic activity is required for its acceleration of lymphoma in the Eμ-myc model. Further, we demonstrate that mice lacking UCH-L1 are resistant to MYC-induced lymphomas. We conclude that UCH-L1 bypasses the need for mTORC1-dependent protein synthesis by directly promoting translation initiation, and that this mechanism may be essential for MYC in B-cell malignancy.
Introduction
Inhibitors of the mechanistic target of rapamycin (mTOR) are widely used as immunosuppressive and antineoplastic therapies. A serine-threonine kinase, mTOR assembles into 2 complexes with distinct biochemical effects.1 When combined with the defining subunit raptor, the resulting mTOR complex 1 (mTORC1) phosphorylates downstream targets that in aggregate promote nucleotide, lipid, and protein synthesis. The targets p70S6 kinase (S6K) and the eIF4E binding protein 1 (4EBP1) both inhibit protein synthesis when in the unphosphorylated state. When mTOR binds to rictor to form mTORC2, it phosphorylates substrates, including AKT, that promote cellular survival and proliferation. The activity of both complexes is essential in normal physiology, with loss of either complex-defining subunit resulting in embryonic lethality in mice.2
MYC is one of the most deregulated oncogenes in humans and regulates thousands of genes through its direct and indirect activity as a transcription factor.3,4 Residing both upstream and downstream of the initiation step of mRNA translation, the oncogenic activity of MYC is closely related to its ability to increase protein biosynthesis. MYC directly stimulates protein synthesis in part by increasing the expression of translation initiation factors including eIF4E, eIF4G, and eIF4A, which assemble to form the eIF4F translation initiation complex.5,6 The importance of this mechanism is evidenced by the acceleration of MYC-driven lymphomagenesis by the overexpression of eIF4E,7 and by the impaired lymphomagenesis seen in Eμ-myc mice when eIF4F components are suppressed by shRNA or small molecule inhibitors.5,8 These strategies may provide important therapeutic insights for diseases with high MYC activity.
Through an unbiased screen, we found the expression of ubiquitin carboxy-terminal hydrolase L1 (UCH-L1) to be deregulated in B-cell lymphoma.9 Encoding a small (25 kDa) de-ubiquitinating enzyme, transgenic expression of Uchl1 is sufficient to drive spontaneous B-cell lymphomagenesis in mice and accelerate disease in the Eμ-myc model.10,11 We uncovered a previously unrecognized function of UCH-L1 in reorganizing mTOR-AKT signaling both in cell lines and in mice.12 UCH-L1 disrupts the ubiquitination of the mTORC1 subunit raptor that is required for its stable association with mTOR, leading to reduced levels of mTORC1.12,13 The direct result of UCH-L1 activity is therefore reduced phosphorylation of mTORC1 substrates, including S6K and 4EBP1.1,14 The mTOR liberated by dissociation from raptor binds to rictor, forming mTORC2, and leading to increased phosphorylation of AKT.12 Although increased survival and proliferative signaling through mTORC2 has an obvious advantage in cancer, the inhibition of mTORC1 by UCH-L1 has been enigmatic, given the importance of protein biosynthesis in cancer in general, and MYC-driven lymphomagenesis in particular.
To better assess the functions of UCH-L1, we used proximity-based proteomics. We identified a novel association of UCH-L1 with the eIF4F translation initiation complex and find that it promotes eIF4F assembly and protein synthesis, despite inhibiting mTORC1. By using mice that lack UCH-L1, or those carrying catalytically active and inactive transgenes, we find that UCH-L1 and its catalytic activity are required for efficient MYC-driven lymphomagenesis in mice. These results identify a novel mechanism by which UCH-L1 bypasses 4EBP1 to drive protein biosynthesis and demonstrate an important functional relationship between UCH-L1 and MYC in lymphomagenesis.
Methods
Mouse strains
Uchl1Tg10, Uchl1−/− (Uchl1Dgen),15 and Eμ-myc16 (obtained from Jackson Laboratories, Bar Harbor, ME) mice were previously described. All strains were maintained on the C57BL/6 background for more than 10 generations. The DMBA carcinogenesis assay was performed as described.17,18 Uchl1TgC90A mice were generated similarly to the Uchl1Tg (Hussain et al10 and in supplemental Methods, available on the Blood Web site). B-lymphocytes were purified, using magnetic separation methods as described.11 Experimental procedures involving the use of these laboratory mice were reviewed and approved by the Institutional Animal Care and Use Committee of the Mayo Clinic.
BioID proximity proteomics
Human UCH-L1 was cloned into the TSIN lentivirus vector,10 with BioID219 fused to its N-terminus, using standard techniques. For proteomic analysis, the BioID2-UCHL1 construct was stably transduced into KMS11 cells that express endogenous UCH-L1. Large-scale biotinylation and mass spectrometric protein identification was performed as described.20 BioID pulldowns were performed as described.20 Briefly, cells were pulse labeled for 16 hours with biotin (50 μM), and were then lysed in urea lysis buffer (8 M urea, 50 mM Tris at pH 7.4, 1 mM dithiothreitol, and 1× protease inhibitor), and biotin-modified proteins were retrieved using streptavidin-coupled DynaBeads (MyOne Streptavidin C1; Thermo Fisher Scientific). Additional details are available in the supplemental Methods.
Pathway analysis
The list of 244 proteins enriched in the BioID2-UCH-L1 proximity proteome was analyzed using the Database for Annotation, Visualization, and Integrated Discovery (DAVID) web tool (https://david.ncifcrf.gov), using the default DAVID annotation categories, with the classification stringency set to high. The terms within each retrieved annotation cluster were summarized, and a mean P-value was calculated. Analysis using the Search Tool for the Retrieval of Interacting Genes/Proteins (STRING; https://string-db.org/) was performed by limiting the active interaction sources to “experiments” and setting the “minimum required interaction score” to medium (0.4).
Cell culture, DUB activity assay, immunofluorescence, polysome profiling, m7GTP pulldowns, SUnSET protein synthesis monitoring
Cell lines used include HeLa (American Type Culture Collection, Manassas, VA), KMS11 and KMS12 (multiple myeloma, kindly provided by Takemi Otsuki), WSU-DLCL2, and SU-DHL6 (germinal center diffuse large B-cell lymphoma; both from American Type Culture Collection) were cultured under standard conditions.10,12 The introduction of UCH-L1 and shRNA was performed using the TSiN or pTRIPZ lentiviral systems, as reported previously.10,12 The activity of UCH-L1 and derivatives was determined using ubiquitin vinylmethylester, as previously described.21 Immunofluorescence imaging was performed as described.12 Polysome profiling was performed as described.22 Immobilized m7GTP (AC-155) was from Jena Bioscience (Jena, Germany). m7GTP pulldowns were performed as described.23 Assays for protein synthesis using the SUnSET technique were performed as described.24
Genomic analyses
RNA extracted from lymphoma samples from Uchl1TgWT mice was analyzed on the Affymetrix Mouse 430 2.0 array by the Mayo Clinic microarray core, and analyzed together with GSE35219 and GSE26408 in conjunction with the Mayo Clinic Department of Bioinformatics. Mate-pair sequencing was performed as described and mapped to the reference genome: GRCm38.p3.25,26 The meta-analysis of UCHL1 and MYC transcript levels was performed using the 2D distribution function (R2: Genomics Analysis and Visualization Platform; http://r2.amc.nl) for all available samples and data sets, using the u133p2 platform. The parametric analysis of gene set enrichment analysis was performed with the indicated gene sets, using R2.
Results
Proximity-based proteomics implicates UCH-L1 in translation initiation
To better understand its molecular activities, we used proximity-based proteomics to identify the protein complexes that include UCH-L1. We used a second-generation BirA-based biotin ligase system (BioID2)19 expressed by itself, or as an N-terminal fusion with UCH-L1 in the multiple myeloma (plasma cell) line KMS-11. We verified the integrity of the UCH-L1 fusion by assessing its catalytic activity, its ability to promote AKT phosphorylation and suppress mTORC1 activity, and its subcellular localization (Figure 1A-D).
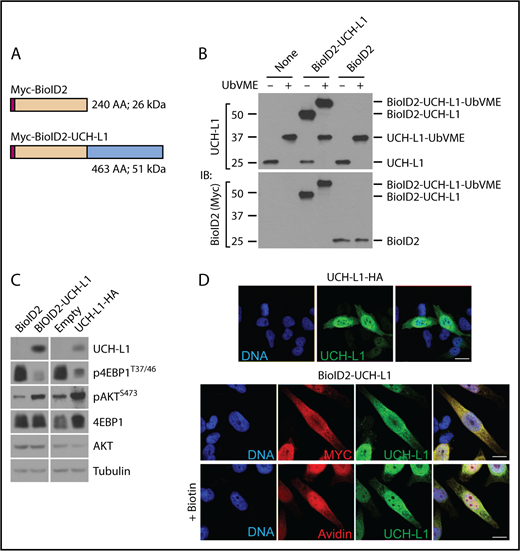
Proximity based proteomics identifies the association of UCH-L1 with translation initiation factors. (A) Schematic of the BioID2 constructs. Myc = Myc epitope tag. (B) The expression of the BioID2-UCHL1 fusions in KMS-11 cells was determined by immunoblot, as shown. Compared with the endogenous UCH-L1 (molecular weight, ∼25 kDa). Catalytic activity of the endogenous and BioID2 fusion was assessed by reactivity with the activity-based probe ubiquitin vinylmetrhyl esther (UbVME). Activity is indicated by a shift in mass of approximately 8 to 10 kDa resulting from the covalent adduct formed with active enzymes and UbVME. (C) The functional integrity of the BioID fusion proteins was assessed by its ability to promote phosphorylation of AKT and to suppress that of S6 kinase. Expression of UCHL1-HA was used for comparison. The relevant region of the blots was cropped to show the expression of BioID2-UCH-L1, or UCHL1-HA. (D) UCH-L1 (green) immunostaining of HeLa cells expressing UCHL1-HA or BioID2-UCHL1. Localization was also examined through the Myc-tag on BioID2 (red). Where indicated, biotin was added to cells expressing BioID-UCHL1 and labeled proteins were visualized with avidin (red). Scale bar = 10 μm.
Proximity based proteomics identifies the association of UCH-L1 with translation initiation factors. (A) Schematic of the BioID2 constructs. Myc = Myc epitope tag. (B) The expression of the BioID2-UCHL1 fusions in KMS-11 cells was determined by immunoblot, as shown. Compared with the endogenous UCH-L1 (molecular weight, ∼25 kDa). Catalytic activity of the endogenous and BioID2 fusion was assessed by reactivity with the activity-based probe ubiquitin vinylmetrhyl esther (UbVME). Activity is indicated by a shift in mass of approximately 8 to 10 kDa resulting from the covalent adduct formed with active enzymes and UbVME. (C) The functional integrity of the BioID fusion proteins was assessed by its ability to promote phosphorylation of AKT and to suppress that of S6 kinase. Expression of UCHL1-HA was used for comparison. The relevant region of the blots was cropped to show the expression of BioID2-UCH-L1, or UCHL1-HA. (D) UCH-L1 (green) immunostaining of HeLa cells expressing UCHL1-HA or BioID2-UCHL1. Localization was also examined through the Myc-tag on BioID2 (red). Where indicated, biotin was added to cells expressing BioID-UCHL1 and labeled proteins were visualized with avidin (red). Scale bar = 10 μm.
To identify proteins that are potential substrates and interaction partners, we performed 2 replicate purifications from biotin-pulsed KMS-11 cells expressing the BioID2 alone or the BioID2-UCH-L1 fusion. Taking advantage of the high affinity of streptavidin toward biotin, we performed these purifications on urea-denatured extracts to minimize the recovery of peripherally associated proteins. The retrieved proteins were identified by mass spectrometry, and the relative recovery of proteins between BioID2 and the BioID2-UCH-L1 fusion was used to identify putative binding partners. A total of 244 proteins were enriched at least 3-fold in the BioID2-UCH-L1 fusion compared with BioID2 alone, with 130 proteins present uniquely in pulldowns performed with the UCH-L1 fusion and not in those from cells expressing BioID2 alone (Table 1; supplemental Table 1). We analyzed the list of biotinylated proteins retrieved in cells expressing BioID2-UCH-L1, using DAVID (https://david.ncifcrf.gov). There were 6 functional clusters with significant enrichment when accounting for multiple comparisons and false-discovery rates (supplemental Table 2). Combining those with substantial overlap, we find that clusters including cell-cell adhesion, RNA-binding, translation initiation, and DEAD-box helicase are highly enriched among the proteins associating with BioID2-UCH-L1 (Table 2). Similar results were obtained analyzing this list using STRING (https://string-db.org/; supplemental Figure 1). Given the previously demonstrated role of UCH-L1 in the mTOR pathway and the importance of MYC in protein biosynthesis, we were drawn to a cluster of proteins involved in mRNA translation, particularly the process of translation initiation that is a highly regulated step (Table 3). As the assembly of the translation initiation eIF4F complex (consisting of eIF4E, eIF4G, and eIF4G) is inhibited by the mTOR substrate 4EBP1, we reasoned that this may shed more light on the mechanism of UCH-L1 in this pathway.
Classification of the proteins retrieved by proximity biotinylation
| Identified proteins | n |
|---|---|
| Unique to UCHL1-BioID2 | 130 |
| UCHL1-BioID2/BioID2 > 3 | 114 |
| UCHL1-BioID2/BioID2 0.3-3 | 404 |
| UCHL1-BioID2/BioID2 < 0.3 | 73 |
| Unique to BioID2 | 83 |
| Total proteins identified* | 804 |
| Identified proteins | n |
|---|---|
| Unique to UCHL1-BioID2 | 130 |
| UCHL1-BioID2/BioID2 > 3 | 114 |
| UCHL1-BioID2/BioID2 0.3-3 | 404 |
| UCHL1-BioID2/BioID2 < 0.3 | 73 |
| Unique to BioID2 | 83 |
| Total proteins identified* | 804 |
Found in both replicates from at least 1 construct
DAVID Functional cluster analysis of proteins retrieved with BioID2-UCH-L1
| Functional cluster | P |
|---|---|
| Cell-cell adhesion | 6.16 × 10⁻²⁹ |
| RNA binding | 3.70 × 10⁻²¹ |
| Translation initiation | 1.58 × 10⁻⁷ |
| DEAD box helicase | 1.34 × 10⁻⁵ |
| Functional cluster | P |
|---|---|
| Cell-cell adhesion | 6.16 × 10⁻²⁹ |
| RNA binding | 3.70 × 10⁻²¹ |
| Translation initiation | 1.58 × 10⁻⁷ |
| DEAD box helicase | 1.34 × 10⁻⁵ |
Proteins involved in mRNA translation identified in the UCH-L1 proximity proteome
| Gene symbol | Ratio BioID2-UCHL1/BioID2 |
|---|---|
| EIF3G | Infinite |
| EIF4A1 | Infinite |
| EIF4G3 | Infinite |
| EIF5A | Infinite |
| PABPC1 | Infinite |
| PABPC4 | Infinite |
| EIF4G2 | 102.7 |
| DHX29 | 42.7 |
| EIF2S3 | 41.6 |
| ABCE1 | 39.0 |
| EIF4B | 25.5 |
| EIF4G1 | 6.4 |
| EIF3B | 3.7 |
| EIF2A | 3.3 |
| EIF3H | 3.1 |
Proteins retrieved from each of 2 independent experiments.
UCH-L1 promotes assembly of the eIF4F translation initiation complex
We previously showed that UCH-L1 destabilizes mTORC1 and reduces 4EBP1 phosphorylation, events that should reduce cap-dependent translation (Hussain et al12 ; Figures 1C and 3D-E; supplemental Figure 4). As protein biosynthesis is essential to support the proliferation of cancer cells, this effect seems paradoxical with the oncogenic functions of UCH-L1. We therefore used the SUnSET technique to determine the rate of new protein translation in cells with or without UCH-L1 by measuring the incorporation of the aminonucleoside antibiotic puromycin into growing polypeptides.24 We consistently observed increased synthesis of new proteins in cells expressing UCH-L1 compared with control (Figure 2A). This suggests that despite reduced mTORC1 phosphorylation of 4EBP1, global translation rates are not suppressed, and are in fact enhanced in the presence of UCH-L1.
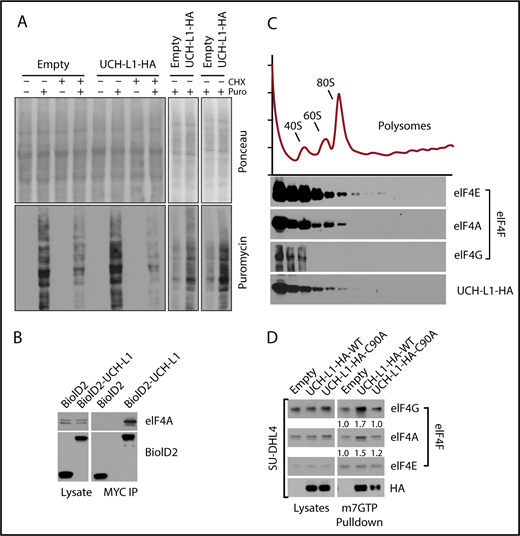
UCHL1 cosediments with and enhances the assembly of eIF4F. (A) HeLa cells were transduced as shown and, where indicated, pulsed with puromycin, with or without preincubation with cycloheximide. After a 50-minute chase period, lysates were immunoblotted as shown. Each panel represents an independent experiment. (B) Cells expressing the BioID constructs shown were subjected to immunoprecipitation with anti-Myc tag as shown. Lysates, and the resulting precipitates, were probed as shown. The results are representative of at least 2 independent experiments. (C) HeLa cells transduced with either control empty vector lentivirus or wild-type UCH-L1 were subjected to sucrose gradient centrifugation to analyze polysome components, as shown (top), and eluted protein fractions (bottom) were immunoblotted for the indicated proteins. UCH-L1 immunoreactivity corresponds to that of subpolysome complexes containing the eIF4F subunits eIF4E and eIF4A. The results are representative of 2 independent experiments. (D) Pulldowns were performed with m7GTP beads and probed as indicated. The loading of precipitates was equalized for the level of eIF4E as it directly binds m7GTP. The intensity of retrieved bands was quantitated by normalizing with eIF4E for each condition, using imageJ. Similar results were seen in 3 other cell lines (supplemental Figure 3).
UCHL1 cosediments with and enhances the assembly of eIF4F. (A) HeLa cells were transduced as shown and, where indicated, pulsed with puromycin, with or without preincubation with cycloheximide. After a 50-minute chase period, lysates were immunoblotted as shown. Each panel represents an independent experiment. (B) Cells expressing the BioID constructs shown were subjected to immunoprecipitation with anti-Myc tag as shown. Lysates, and the resulting precipitates, were probed as shown. The results are representative of at least 2 independent experiments. (C) HeLa cells transduced with either control empty vector lentivirus or wild-type UCH-L1 were subjected to sucrose gradient centrifugation to analyze polysome components, as shown (top), and eluted protein fractions (bottom) were immunoblotted for the indicated proteins. UCH-L1 immunoreactivity corresponds to that of subpolysome complexes containing the eIF4F subunits eIF4E and eIF4A. The results are representative of 2 independent experiments. (D) Pulldowns were performed with m7GTP beads and probed as indicated. The loading of precipitates was equalized for the level of eIF4E as it directly binds m7GTP. The intensity of retrieved bands was quantitated by normalizing with eIF4E for each condition, using imageJ. Similar results were seen in 3 other cell lines (supplemental Figure 3).
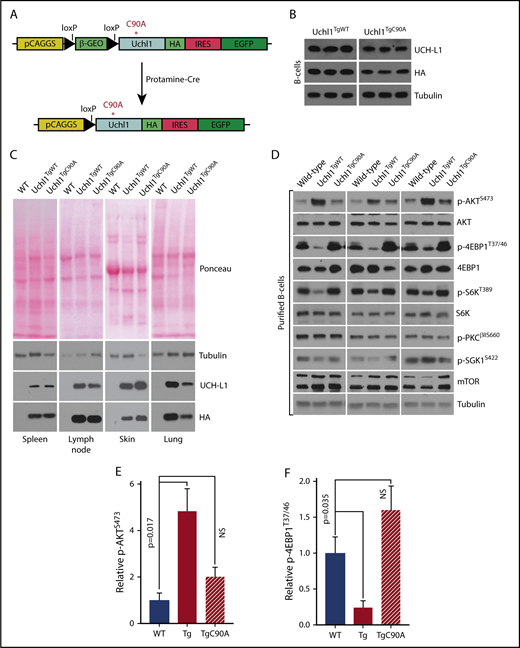
Generation of Uchl1TgC90Amice. (A) Schematic of the Uchl1C90A transgene. Note: beyond the C90A mutation, the constructs and its activation are identical to the wild-type transgene.10 (B) Expression of UCH-L1C90A in a series of tissues from the indicated transgenic mice. Results are representative of 3 independent animals each. (C) Transgene expression was determined by immunoblot in purified B cells from mice of the indicated genotypes. (D) Analysis of mTOR-AKT signaling in purified B cells from mice of the indicated genotypes (n = 3 each). (E-F) Quantitation of the changes seen in panel D. The intensities of the total and phosphorylated proteins were determined with ImageJ. The graphs represent the mean ± standard error of the mean for the ratio of phosphor/total normalized to wild-type. NS, not significant (P < .05).
Generation of Uchl1TgC90Amice. (A) Schematic of the Uchl1C90A transgene. Note: beyond the C90A mutation, the constructs and its activation are identical to the wild-type transgene.10 (B) Expression of UCH-L1C90A in a series of tissues from the indicated transgenic mice. Results are representative of 3 independent animals each. (C) Transgene expression was determined by immunoblot in purified B cells from mice of the indicated genotypes. (D) Analysis of mTOR-AKT signaling in purified B cells from mice of the indicated genotypes (n = 3 each). (E-F) Quantitation of the changes seen in panel D. The intensities of the total and phosphorylated proteins were determined with ImageJ. The graphs represent the mean ± standard error of the mean for the ratio of phosphor/total normalized to wild-type. NS, not significant (P < .05).
After confirming the co-precipitation of UCH-L1 and one of the eIF4F subunits, eIF4A (Figure 2B), we analyzed the association of UCH-L1 with the translation machinery through polysome analysis. We observed that UCH-L1 cofractionated with components of the eIF4F preinitiation complex, but not with polysomes (Figure 2C). We did not observe a significant change in the polysome profiles in cells with or without UCH-L1 (supplemental Figure 2). As we identified eIF4G and eIF4A (2 of the 3 eIF4F subunits) in our proximity proteomic data, we hypothesized that association of UCH-L1 with this complex may affect its assembly. The UCH-L1-induced repression of 4EBP1 phosphorylation would be expected to impair eIF4F assembly and protein biosynthesis. We therefore examined eIF4F assembly through pulldowns with beads coupled with m7GTP that make up the 5′ cap on mRNA. As eIF4E directly binds to m7GTP, we normalized the recovered complexes to the level of this protein and examined amounts of eIF4G and eIF4A bound. Compared with control, expression of UCH-L1 increased the pulldown of eIF4G and eIF4A bound to eIF4E in 4 different cell lines (Figure 2D; supplemental Figure 3A-C). UCH-L1 was also retrieved with m7GTP beads, with less retrieved from cells expressing the catalytic mutant enzyme (C90A). We found no effect of UCH-L1 on the total level of eIF4F subunits in cell lines and mouse tissues, indicating that it is not affecting the degradation rate of these proteins (supplemental Figure 4A-D). As assembly and activity of eIF4F is also influenced by the activity of MNK1 on eIF4E27,28 and S6 kinase, AKT, and MEK on eIF4B,29 we examined the effect of UCH-L1 on these modifications, but found no such effect (supplemental Figure 4A-C). These data indicate that although UCH-L1 inhibits the phosphorylation of the eIF4F inhibitor 4EBP1, it results in increased levels of the translation initiation complex and increased protein translation.
UCH-L1 catalytic activity is required for its oncogenic activity in vivo
Recent reports have indicated a key link between the oncogenic activity of MYC and the eIF4F complex including enhancing lymphomagenesis5,7,30,31 and affecting chemoresistance.7,32 We therefore hypothesized that UCH-L1 may play a role in MYC-driven lymphomagenesis. We previously found that transgenic UCH-L1 accelerated the development of lymphomas in Eμ-myc mice.10 Whether UCH-L1 catalytic activity is required for this acceleration, and whether endogenous UCH-L1 contributes to Myc-driven lymphomagenesis is not known.
To address the role of its catalytic activity in vivo, we generated novel transgenic mice carrying catalytically inactive UCH-L1 (Figure 3A; Uchl1TgC90A) using an identical approach to that used to generate previously reported single-integration Uchl1TgWT mice.10 After activation of the Uchl1TgC90A transgene, relative expression of the WT and C90A transgenes was similar in various tissues analyzed, notably the skin, spleen, and purified splenic B cells (Figure 3B-C). As we previously showed that UCH-L1 regulates mTOR complex assembly,12 we examined the phosphorylation of mTOR substrates in splenocytes and purified B-cells from Uchl1TgWT and Uchl1TgC90A mice. As expected, we found that expression of the WT but not the C90A transgene increased the phosphorylation of AKT (mTORC2 substrate) and suppressed the phosphorylation of 4EBP1 and S6K (mTORC1 substrates) in cell lines and primary tissues (Figure 3D-E; supplemental Figure 5A-C). Surprisingly, the phosphorylation of 2 other mTORC2 substrates (PKC and SGK1) was not similarly affected (Figure 3E; supplemental Figure 5). This suggests that although UCH-L1 increases the overall level of mTORC2, the effect of this kinase is selectively directed to AKT over other substrates. The mechanisms that underlie this are unknown. These data support the use of these mice to dissect the role of UCH-L1 catalytic activity in vivo.
To assess the general oncogenic potential of wild-type and catalytic mutant UCH-L1, we assessed the tendency of wild-type and Uchl1 transgenic mice to develop tumors in response to the carcinogen 7,12-dimethylbenz[a]anthracene (DMBA). Newborn pups (day of life, 1-3) were exposed to a single topical dose of DMBA, and the tumor incidence was scored at 5 months of life. Compared with nontransgenic littermates, there was a significant increase in the incidence of skin tumors in Uchl1TgWT mice, but not in Uchl1TgC90A mice (Figure 4A-B). In mice that developed tumors, there was no difference in tumor size or the number of tumors per mouse across genotypes (data not shown). There was no difference in the incidence of lung tumors across the 3 cohorts (data not shown). We conclude that UCH-L1 catalytic activity is required for its ability to enhance DMBA induced skin tumors. To determine the role of its catalytic activity in lymphomagenesis, we crossed Uchl1TgWT and Uchl1TgC90A mice with the Eμ-myc model of lymphoma. As we observed previously, transgenic expression of wild-type UCH-L1 significantly accelerated the development of lymphoma in the Eμ-myc strain (Figure 4C). There was no change, however, in the lymphoma-free survival of double-mutant Eμ-myc/Uchl1TgC90A mice. These data, together with the results of the DMBA carcinogenesis assay, indicate that catalytic activity is essential for the oncogenic effects of UCH-L1 in mice.
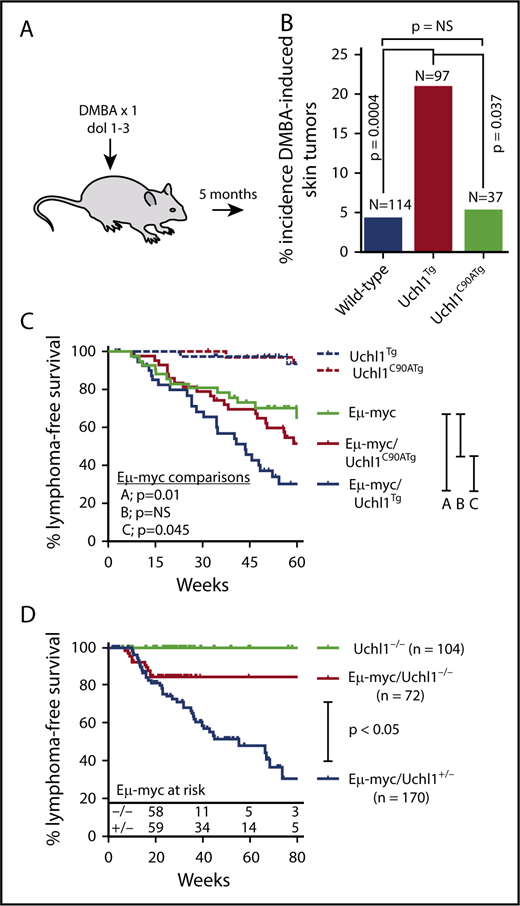
Catalytic activity is required for UCH-L1 induced tumorigenesis. (A) Schematic of the DMBA carcinogen bioassay. A single dose of DMBA was applied to the skin of mice between 1 and 3 days of life, and mice were analyzed at age 5 months for tumors. (B) The incidence of skin tumors for mice from panel A is shown. (C-D) Lymphoma-free survival is shown for mice with the indicated genotypes. P values were calculated with log-rank test. NS, not significant (P < .05).
Catalytic activity is required for UCH-L1 induced tumorigenesis. (A) Schematic of the DMBA carcinogen bioassay. A single dose of DMBA was applied to the skin of mice between 1 and 3 days of life, and mice were analyzed at age 5 months for tumors. (B) The incidence of skin tumors for mice from panel A is shown. (C-D) Lymphoma-free survival is shown for mice with the indicated genotypes. P values were calculated with log-rank test. NS, not significant (P < .05).
UCH-L1 is required for efficient Myc-driven lymphoma development
Although we have shown that UCH-L1 accelerates the development of B-cell lymphoma driven by Myc, we do not know whether its catalytic activity is required for the development of lymphomas. To address this, mice carrying a deletion in the Uchl1 gene (Uchl1Dgen) were crossed with the Eμ-myc strain. As with the 2-other independent Uchl1 null strains,33,34 Uchl1Dgen mice develop a neurodegenerative state that ultimately is lethal.15 We therefore used relatively large cohorts to ensure adequate survival estimation, using the Kaplan-Meier method. Compared with heterozygous null mice on the Eμ-myc background, those with homozygous loss of Uchl1 had a significantly reduced incidence of lymphoma (Figure 4D). Notably, the rate of lymphoma onset was similar between the cohorts in animals less than approximately 20 weeks, after which no lymphomas were observed in Eμ-myc/Uchl1Dgen/Dgen mice, with 52 mice surviving from between 20 and 106 weeks. These data lead us to conclude that UCH-L1 not only accelerates Myc induced lymphomas but is required for the full oncogenic potential of Myc in this model.
UCHL1 levels are strongly correlated with MYC target genes
The accelerated development of Myc-driven lymphoma led us to hypothesize that UCH-L1 may affect the stability or function of MYC. However, we were unable to detect a direct interaction between UCH-L1 and MYC by co-immunoprecipitation in lymphoma cells (supplemental Figure 6A). Further, depletion or overexpression of UCH-L1 did not affect MYC (supplemental Figure 6B). To better understand their relationship, we performed a meta-analysis of UCHL1 and MYC mRNA levels across 324 gene expression studies involving more than 35 000 individual samples, using the R2 genomics analysis and visualization platform (http://r2.amc.nl). Although we had hypothesized a positive relationship, we instead found higher MYC values associated with lower UCHL1 (Figure 5A). We next looked at 5 primary mature B-cell lymphomas data sets containing at least 100 samples each. In 3 of the 5, there was no correlation, and a significant though weak positive correlation was observed in the other 2 (Table 4). To identify gene expression patterns within the cohorts of lymphomas with high UCHL1, we examined the expression of Hallmark gene sets, using parametric analysis of gene set enrichment. Surprisingly, this revealed a highly significant skewing of MYC target genes in all 5 data sets, with higher levels of “MYC target v1” consistently seen in UCHL1 high samples (Table 4; Figure 5B-C). This pattern was seen regardless of the presence or absence of a correlation between UCHL1 and MYC. Further, when cases with MYC rearrangements or those with high MYC were excluded, MYC target v1 genes continued to be enriched in the UCHL1 HI cases. These data led us to wonder whether UCH-L1 may, in fact, be a downstream effector of MYC, but not itself a MYC target.
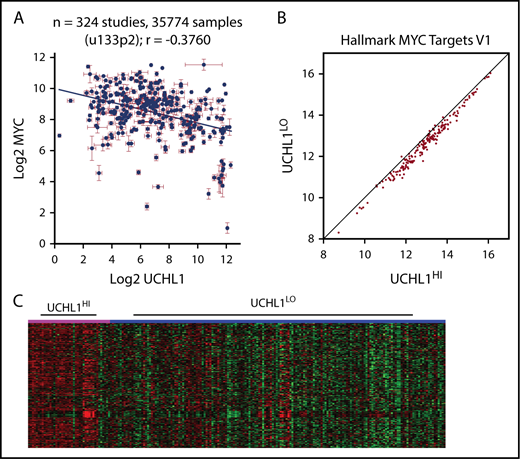
UCHL1 levels strongly correlate with increased MYC target expression. (A). Levels of UCHL1 and MYC as measured in 324 independent RNA expression profiles. Note the lack of a positive association with MYC levels. Each point represents the mean ± standard error of the mean expression of MYC and UCHL1 from 1 data set. (B-C) Gene set enrichment analysis was performed using the parametric analysis of gene set enrichment in 5 data sets, including at least 100 primary samples of mature B-cell lymphoma (Burkitt or Diffuse large B-cell). Shown are the Z scores for MYC target genes comparing UCHL1HI (>80%) versus UCHL1LO (0%-79%; B) and the systematic skewing favoring higher MYC target levels in UCHL1HI cases (note how most genes fall on the right side of the line; C) and the heat map demonstrating higher expression of MYC targets in the UCHL1HI cases (pink) compared with UCHL1LO (blue).
UCHL1 levels strongly correlate with increased MYC target expression. (A). Levels of UCHL1 and MYC as measured in 324 independent RNA expression profiles. Note the lack of a positive association with MYC levels. Each point represents the mean ± standard error of the mean expression of MYC and UCHL1 from 1 data set. (B-C) Gene set enrichment analysis was performed using the parametric analysis of gene set enrichment in 5 data sets, including at least 100 primary samples of mature B-cell lymphoma (Burkitt or Diffuse large B-cell). Shown are the Z scores for MYC target genes comparing UCHL1HI (>80%) versus UCHL1LO (0%-79%; B) and the systematic skewing favoring higher MYC target levels in UCHL1HI cases (note how most genes fall on the right side of the line; C) and the heat map demonstrating higher expression of MYC targets in the UCHL1HI cases (pink) compared with UCHL1LO (blue).
Correlation between UCHL1, MYC, and MYC-target genes in B-cell lymphoma
| Data set | Correlation (r) MYC:UCHL1 | Z score MYC-targets V1 (UCHL1HI/LO) | Z score MYC-targets V1 (UCHL1HI/LO; MYC NL) |
|---|---|---|---|
| GSE4475 | 0.338* | 16.13 | 11.471† |
| GSE87371 | 0.003 | 12.32 | 11.03 |
| GSE10846 | 0.273* | 10.34 | 10.91 |
| GSE31312 | 0.067 | 9.06 | 4.13 |
| GSE57611 | −0.043 | 12.85 | 13.53 |
Analyzed with the R2: Genomics Analysis and Visualization Platform (http://r2.amc.nl). Z scores calculated for MSigDB Hallmark Geneset using PAGE. UCHL1 HI defined as 80th-100th percentile UCHL1 expression. MYC normal (NL) defined as 0-80th percentile.
Significance for correlation P < .05.
MYC rearrangements were excluded.
Uchl1Tg lymphomas share gene expression profiles with MYC-driven lymphomas
To better understand the nature of the lymphomas arising in this model, we performed RNA microarray gene expression profiling on 5 unique spontaneous lymphomas from Uchl1TgWT mice. We compared the profiles from these tumors with those obtained from purified normal mouse B-cell populations and lymphomas developing in other lymphoma models, including MYC-P110*,35 Iμ-HABCL6,36 and Lig4/p53 double-knockout mice.37 Using a set of 3000 probes that efficiently discriminate normal B-cell subsets and lymphomas, we found that the lymphomas from genetically engineered models clustered together in a distinct pattern compared with normal B-cell populations (Figure 6A-B). Normal germinal center (GC) B cells did not cluster with any of the lymphoma samples from any model. We observed a striking similarity between the gene expression profiles of Uchl1TgWT tumors and those from MYC-P110* mice that have concurrent enforced expression of C-Myc and a constitutively active form of the PI3K subunit P110.35 Clustering reflected the visual similarity as the lymphomas from Uchl1TgWT and MYC-P110* mice grouped separately from those from Iμ-HABCL6 and Lig4−/− mice (Figure 6B-C). We performed mate-pair DNA sequencing of these same samples and found that in all but 1 sample, the Myc locus was intact (supplemental Figure 7, and data not shown). One sample contained a complex rearrangement of the C-Myc locus that juxtaposed the immunoglobulin heavy-chain with Myc. We used quantitative reverse transcription polymerase chain reaction to examine the level of Myc, and found that the samples had between 3- and 37-fold increased Myc compared with GC B cells purified from immunized wild-type mice (Figure 6D). The highest expression was seen in the sample carrying the Myc rearrangement (supplemental Figure 7). These data suggest that deregulated expression of UCH-L1 produces lymphomas with gene expression similar to those with genetically driven excessive MYC and PI3K signaling independent of Myc genomic alterations.
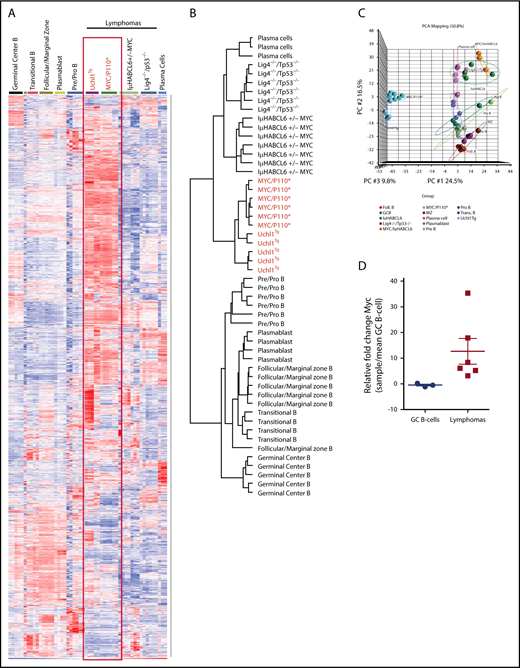
Lymphomas from Uchl1Tgmice resemble those driven by constitutive MYC and PI3KA activation. (A-C) Heat map (A), cluster dendrogram (B), and primary component analysis (PCA; C) of mRNA gene expression profiles of 5 lymphomas from Uchl1Tg mice compared with those from the indicated genetically engineered mouse models and B-cell populations (GSE2350 and GSE26408). (D) Myc mRNA levels were determined in the 5 lymphomas from A to C and compared with purified GC B cells isolated from immunized C57BL/6 mice (n = 3). The sample with the highest Myc expression has a documented Myc rearrangement.
Lymphomas from Uchl1Tgmice resemble those driven by constitutive MYC and PI3KA activation. (A-C) Heat map (A), cluster dendrogram (B), and primary component analysis (PCA; C) of mRNA gene expression profiles of 5 lymphomas from Uchl1Tg mice compared with those from the indicated genetically engineered mouse models and B-cell populations (GSE2350 and GSE26408). (D) Myc mRNA levels were determined in the 5 lymphomas from A to C and compared with purified GC B cells isolated from immunized C57BL/6 mice (n = 3). The sample with the highest Myc expression has a documented Myc rearrangement.
Discussion
Despite being one of the first discovered de-ubiquitination enzymes, the molecular functions of UCH-L1 have been enigmatic. Here we use an unbiased proteomics approach to identify novel pathways in which UCH-L1 may play a role, and have found an unexpected function in directing the assembly of the eIF4F translation initiation complex. These findings address an important question regarding the oncogenic activity of UCH-L1. We previously showed that UCH-L1 disrupts the assembly of mTORC1 in vitro and in vivo,12 the activity of which is strongly associated with malignancy because of its roles in macromolecule biosynthesis. How then can UCH-L1 both inhibit mTORC1 and promote cancer? Our finding that UCH-L1 associates with and promotes the assembly of eIF4F provides a mechanism by which it bypasses mTORC1 and the negative effects of its suppression on protein biosynthesis. Interestingly, although we show here that protein synthesis is increased in response to UCH-L1 expression, we previously found that UCH-L1 expression leads to a reduction in cell size similar to the effect seen with rapamycin.12 This indicates that although UCH-L1 may bypass the role of mTORC1 on protein synthesis, it does not affect the global effect of mTORC1 reductions on metabolism. This is not unexpected, given that the phosphorylation of 4EBP1 and S6K have independent effects on cell size and that the latter has other downstream effects that affect cell growth such as lipid and nucleotide biosynthesis.38,39
The activity through the PI3K-mTOR-AKT pathways plays an important role in the biology of B-cell lymphomagenesis. In MYC/P110* mice, the co-activation of MYC and PI3K signaling in murine germinal center B cells leads to the development of B-cell lymphomas, with a striking resemblance to human Burkitt lymphoma.35 The similar gene expression pattern we observe in the lymphomas from Uchl1TgWT and MYC/P110* mice may partially reflect the enhanced mTOR-AKT signaling seen in both models. We provide further evidence, derived from gene expression profiles in human lymphomas, that high levels of UCH-L1 may also promote a MYC-like signature despite the lack of association with MYC expression. The mechanisms that may underlie this effect are unknown. UCH-L1 was recently shown to associate with chromatin in prostate cancer cells and HEK293T cells.40 Chromatin immunoprecipitation and sequencing found that most of the regions occupied by UCH-L1 relate to either telomeric or intergenic regions, although it was also found to reside in the proximity of a small number of genes that clustered in the ρ signaling pathway. The UCH-L1 proximity proteome identified several proteins with roles in transcription that may also play a role in these events.
There is a growing body of evidence linking the oncogenic activity of MYC with the regulation of protein biosynthesis. Overexpression of the eIF4E cap binding protein is sufficient to strongly accelerate lymphomagenesis in the Eμ-myc model.7 A feed-forward loop also exists in which MYC increases the expression of eIF4F subunits, and the translation of MYC itself is further enhanced by increasing levels of the translation initiation complex.6 Reinforcing the importance of protein synthesis in MYC’s oncogenic activity, depletion of eIF4E using shRNA, or pharmacological suppression of eIF4F activity using the drug silvestrol, suppresses Eμ-myc lymphomagenesis.5,6 Our data linking UCH-L1 with enhanced assembly of eIF4F and its requirement for MYC-driven lymphoma in this model are further consistent with this important connection.
Presented in abstract form at the 6th International Symposium on Childhood, Adolescent, and Young Adult Non-Hodgkin Lymphoma Rotterdam, The Netherlands, 27 September 2018.
The online version of this article contains a data supplement.
The publication costs of this article were defrayed in part by page charge payment. Therefore, and solely to indicate this fact, this article is hereby marked “advertisement” in accordance with 18 USC section 1734.
Acknowledgments
The authors thank Jan van Deursen and the members of the Mayo Clinic Transgenic and Knockout Core Facility for their help with generating mice. P.J.G. is a former ASH Basic Research Scholar, a past recipient of the Howard Hughes Medical Institute Physician Scientist Early Career Award, and a former Harriet H. Samuelsson Foundation Pediatric Cancer Research Scientist.
The work was funded by the National Institutes of Health, National Cancer Institute (CA151351) (P.J.G.), the Multiple Myeloma Research Foundation (P.J.G.), Gabrielle's Angel Foundation for Cancer Research (P.J.G.), the Hyundai Hope on Wheels Foundation (P.J.G.), the T. Denny Sanford Pediatric Collaborative Research Fund Award (P.J.G. and K.J.R.), and the National Institutes of Health, National Institute for General Medical Sciences (P20GM103620, Protein Biochemistry Core) (K.J.R.).
Authorship
Contribution: S.H., T.B., Q.L., D.G.M., and H.J. performed experiments; W.H., S.H.J., G.V., K.J.R., and P.J.G. designed the experiments, supervised their completion, and analyzed the data; and P.J.G. designed the study and wrote the manuscript.
Conflict-of-interest disclosure: The authors declare no competing financial interests.
Correspondence: Paul J. Galardy, Mayo Clinic, 200 First Street SW, Guggenheim 15, Rochester, MN 55905; e-mail: galardy.paul@mayo.edu.

This feature is available to Subscribers Only
Sign In or Create an Account Close Modal