

Key Points
The integrity of the MM transcriptome is compromised by ADAR1 overexpression, conferring oncogenic events in an editing-dependent manner.
NEIL1 is an important ADAR1 editing target, and its recoded protein has a defective functional capacity and gain-of-function properties.

Abstract
DNA alterations have been extensively reported in multiple myeloma (MM); however, they cannot yet fully explain all the biological and molecular abnormalities in MM, which remains to this day an incurable disease with eventual emergence of refractory disease. Recent years have seen abnormalities at the RNA levels being reported to possess potential biological relevance in cancers. ADAR1-mediated A-to-I editing is an important posttranscriptional mechanism in human physiology, and the biological implication of its abnormality, especially at the global level, is underexplored in MM. In this study, we define the biological implications of A-to-I editing and how it contributes to MM pathogenesis. Here, we identified that the MM transcriptome is aberrantly hyperedited because of the overexpression of ADAR1. These events were associated with patients’ survival independent of 1q21 amplifications and could affect patients’ responsiveness to different treatment regimes. Our functional assays established ADAR1 to be oncogenic, driving cellular growth and proliferation in an editing-dependent manner. In addition, we identified NEIL1 (base-excision repair gene) as an essential and a ubiquitously edited ADAR1 target in MM. The recoded NEIL1 protein showed defective oxidative damage repair capacity and loss-of-function properties. Collectively, our data demonstrated that ADAR1-mediated A-to-I editing is both clinically and biologically relevant in MM. These data unraveled novel insights into MM molecular pathogenesis at the global RNA level.
Introduction
Multiple myeloma (MM) is the second most common hematologic malignancy, characterized by an abnormal proliferation of plasma cells.1,2 New drug developments in MM have led to significant improvement in the outcome of the patients.3,4 Nevertheless, the inevitability of eventual relapse and drug resistance urgently calls for a more in-depth understanding of the disease biology. Over the years, much focus has been channeled into elucidating abnormalities at the DNA level (mutations, indels, translocations). However, although these efforts have led to a greatly improved understanding of MM biology, they do not fully explain the disease phenotype.1,5,6
RNA-based abnormalities have been associated with cancer pathogenesis7,8 ; therefore, it is highly relevant that we also elucidate its potential contribution to MM pathogenesis. In this instance, RNA editing, a process that renders an alteration to the mRNA sequence without affecting its genomic blueprints, is a pervasive epigenetic mechanism that occurs in up to 85% of the human transcriptome, underscoring its physiological importance.9-11 In humans, the most prevalent form of RNA editing is the site-selective hydrolytic deamination of adenosines (A) into inosines (I), an event catalyzed by adenosine deaminases acting on RNA (ADAR) family enzymes, consisting of ADAR1 (double isoforms of N-truncated-p110 and full-length-p150), ADAR2, and ADAR3 (catalytically inactive).11 Because of structural similarities, I is recognized as guanosine (G) by the translational machinery, and this process can contribute to transcriptome and proteome diversity.8,11
Emerging evidence has revealed a close association between an aberrant ADAR1-mediated A-to-I editing and tumorigenesis in various cancer types.8,12 -14 Critically, the contribution of deregulated RNA editing of an individual gene to the pathogenesis of MM was reported recently, whereby Alu-dependent editing of GLI1, a gene involved in the prosurvival Hedgehog signaling pathway, was found to be of prognostic significance in the patients.15 Although this is a novel finding, the significance of an abnormal editing at the whole-transcriptomic level was not interrogated in this study.
Notably, ADAR1 resides at chromosome 1q21. 1q21 amplification (1q21[amp]) is 1 of the most common cytogenetic abnormalities in MM and is a poor prognostic factor.6,16,17 In addition to the previously reported putative candidate genes (CKS1B and PMSD4) being critically amplified,18,19 it is plausible that ADAR1 also experiences increased gene-dosage from 1q21(amp). Nevertheless, whether or not the prognostic effect of ADAR1-mediated overediting is dependent on 1q21(amp) remains unanswered.
Here, we characterized the A-to-I editing landscape of MM and found that the transcriptome was aberrantly hyperedited in the malignant plasma cells, and that this hypereditome was independently associated with disease progression and prognosis. At the gene-specific level, we identified NEIL1 to be another crucial RNA-editing target in MM, the misediting of which led to loss-of-function cellular phenotypes.
Methods
Patient samples and human myeloma cell lines
Primary samples (whole blood or bone marrow) from the healthy volunteers and patients with MM were collected after obtaining informed consent, according to conditions stated by the Institutional Review Board, National University Hospital. Plasma cells were isolated through Ficoll-Hypaque centrifugation system and were purified with CD138 immunomagnetic beads (Stemcell Technologies). All human myeloma cell lines (HMCLs) used have been previously characterized.2
RNA sequencing and RNA editing analysis
Total RNA was isolated using the RNeasy kit (Qiagen), according to manufacturer’s protocol. Whole-transcriptome sequencing was performed on an Illumina Hi-Seq-4000 platform. We also analyzed the publicly available RNA-sequencing (RNA-seq) data set from MMRF (CoMMpass; n = 730). Detailed information about variant calling and RNA editing analysis are explained in the supplemental Information, available on the Blood Web site. Our RNA-seq data are available on National Center for Biotechnology Information (Gene Expression Omnibus accession number GSE110486).
cDNA synthesis, conventional polymerase chain reaction, and quantitative real-time PCR
cDNA synthesis was performed before conventional polymerase chain reaction (PCR) and quantitative real-time PCR (qPCR) assays. For validation of RNA editing by Sanger sequencing, conventional PCR was performed with high-fidelity DNA polymerase (Invitrogen). The editing frequency was quantified with Image J with this formula: (area under the curve for G/area under the curve for A+G)×100.20,21 For mRNA expression studies, qPCR with SYBR green was performed according to the manufacturer’s protocol.
Western blot analysis
Western blot assay was done according to standard procedure stated in supplemental Information.
Immunofluorescence
The set of tissue microarrays (n = 200) used has been previously described.22 The staining protocol is explained in supplemental Information.
Lentivirus-mediated ADAR1 and NEIL1 knockdown and overexpression
A detailed explanation for the generation of stable cell lines is described in supplemental Information. The lentiviral constructs expressing nontargeting (shCtr) and ADAR1 shRNA, ADAR1-WT, and catalytically inactive ADAR1-Mutant proteins were used. For NEIL1 overexpression, NEIL1 ORF-expression plasmid (pLenti-C-NEIL1 [WT]-mGFP-P2A-Puro) was purchased from Origene. Site-specific A-to-G conversion of NEIL1 on exon 6 (A726G) was done with a site-directed mutagenesis kit (Agilent Technologies).
In vitro functional assays and in vivo xenograft study
The details of functional assays (cell viability, colony formation, cell cycle analyses, and Annexin-V apoptosis assay) is available in supplemental Information. Nonobese diabetic-severe combined immunodeficiency-γ mice were used for xenograft study. It was performed in accordance with the Institutional Animal Care and Use Committees, National University of Singapore. Detailed protocol is in supplemental Information.
Quantification of intracellular oxidative damage
The 8-hydroxy-2-deoxyguanosine (AbCam) assay is an enzyme-linked immunosorbent assay-based assay to quantify intracellular oxidative damage. CM-H2DCFDA (Thermo Fisher Scientific) is a reactive oxygen species (ROS) marker detected with flow cytometer. Assays were performed as per manufacturer’s protocol. Comet Assay was performed in alkaline condition according to standard protocol.
Gene expression profiling and aCGH
Details of the multiple gene expression profiling (GEP) and array comparative genomic hybridization (aCGH) data sets analyzed are provided in the supplemental Table 1. Probes’ numerical values of both GEP and aCGH data downloaded from a public repository, Gene Expression Omnibus were used without any modification. ADAR1 expression values were then produced as described in supplemental Information. For aCGH data, we first performed segmentation of log-ratio values ordered according to their corresponding probes’ chromosomal positions and determined each segment’s copy number aberration status. ADAR1 gene’s copy number status was finally identified as the copy number status of the segment harboring ADAR1 gene.
Results
ADAR1 overexpression is associated with disease development, progression, and aggressiveness
We first established the clinical significance of ADAR1 in the development and progression of MM by performing in silico analyses on public GEP data sets (Italy and Mayo Clinic) containing samples from the healthy control patients and patients with MM in different disease stages (Figure 1A), and on RNA sequencing data of samples obtained from our local institution (n = 17; Figure 1B). There was a clear overexpression of ADAR1 in MM cells relative to the nonmalignant plasma cells in the different independent data sets. Correspondingly, at the protein level, ADAR1 expression was significantly higher in newly diagnosed and relapsed cases compared with monoclonal gammopathy of undetermined significance (MGUS) and smoldering multiple myeloma (Figure 1C). Its gradual increase of expression along the disease progression route from the benign and low-stage conditions to the extramedullary and high-stage disease (Figure 1A-C; supplemental Figure 1A) indicates its close association with myelomagenesis. qPCR and western blot analyses consistently showed higher ADAR1 expression in the malignant CD138+ cells (from patients with MM and cell lines) compared the nonmalignant samples (from healthy volunteers; Figure 1D; supplemental Figure 1B). Furthermore, the high-risk patient subtypes (4p16 and MAF-translocation groups) were also found to possess increased ADAR1 expression, suggesting its role in conferring disease aggressiveness (Figure 1E). Most important, ADAR1 demonstrated prognostic significance, evidenced by the close association of its high expression level with poor overall survival (Figure 1F; supplemental Figure 1C), altogether underlining ADAR1’s role in conferring disease progression and aggressiveness.
![Figure 1. ADAR1 overexpression is an independent prognostic marker. (A) Analysis of ADAR1 expression in publicly available MM patient data sets from Italian GSE13591 (n = 158) and Mayo Clinic (n = 162). Average (avg) intensity of the GEP probe of each patient group is stated on the graphs, with their standard deviation (sd). (B) ADAR1 mRNA expression from the whole-transcriptome sequencing of our in-house primary patient samples (n = 17) on the Illumina Hi-Seq 4000 platform. The mean expression (Ave) ± sd for each cohort is stated in the table below the graph. (C) Immunofluorescence analysis of ADAR1 expression in bone marrow tissue microarray (left, L), with corresponding segmented image masks (right, R). CD138 marks plasma cells. Percentage of double positivity (CD138+/ADAR1+) is indicated below the images. Color coding is stated on the figure. Dot plot on the right is the quantification of the immunofluorescence analysis of ADAR1 protein expression on the TMA. ADAR1 positivity refers to the double-positive staining for both anti-CD138 and anti-ADAR1. (D) qPCR analysis of ADAR1 mRNA expression of primary samples (from healthy donors and patients with MM) and MM cell lines. Relative expression was calculated with ddCt method normalizing to GAPDH expression. (E) GEP analysis of ADAR1 expression in patients enrolled into Mayo Clinic and University of Arkansas for Medical Sciences (UAMS) clinical trial based on different translocation/cyclin D (TC) classification. (F) Kaplan-Meier curve demonstrating the overall survival of patients (from different MM data sets; namely, Assessment of Proteasome Inhibition for Extending Remissions [APEX] and UAMS) with differential ADAR1 expression. CI, confidence interval; HR, hazard ratio; HV, healthy volunteer; MGUS, monoclonal gammopathy of undetermined significance; MM, multiple myeloma; ND, newly diagnosed; PCL, plasma cell leukemia; R, relapsed; SMM, smoldering multiple myeloma.](https://ash.silverchair-cdn.com/ash/content_public/journal/blood/132/12/10.1182_blood-2018-02-832576/4/m_blood832576f1.png?Expires=1767711388&Signature=wIPB3tPnzMZb7IHGNKAx7LgGrPS5yiK~qfLnFDtLKfkfuFq~S6PZEHi-Vsl0r4hTYrInu42U7zl-gTTzdux1w7bPDqmGeRzyU9HYDKkVT7ws0uM8kNh0VOcUQbUes-xeTZNYKNpxd~gZeVPJYfnMRzI1Iu0-dpoHlVNwbriqYslT28JWib-mL5AcKo5SQCejOl-K13g9GgHdoq08KCTD81Ly9xUP~LHtDvRoucM0wFQ82UqlbraKFWB7wMlCSOZuoiv5zQIYOI2p3DB52xyWHFwu3-1c6IFJ-mcGUL2LoKsyS3dVjKktZv1qCxrGwG1MXSm12G5lkZ9OSYRvQcNwUg__&Key-Pair-Id=APKAIE5G5CRDK6RD3PGA)
ADAR1 overexpression is an independent prognostic marker. (A) Analysis of ADAR1 expression in publicly available MM patient data sets from Italian GSE13591 (n = 158) and Mayo Clinic (n = 162). Average (avg) intensity of the GEP probe of each patient group is stated on the graphs, with their standard deviation (sd). (B) ADAR1 mRNA expression from the whole-transcriptome sequencing of our in-house primary patient samples (n = 17) on the Illumina Hi-Seq 4000 platform. The mean expression (Ave) ± sd for each cohort is stated in the table below the graph. (C) Immunofluorescence analysis of ADAR1 expression in bone marrow tissue microarray (left, L), with corresponding segmented image masks (right, R). CD138 marks plasma cells. Percentage of double positivity (CD138+/ADAR1+) is indicated below the images. Color coding is stated on the figure. Dot plot on the right is the quantification of the immunofluorescence analysis of ADAR1 protein expression on the TMA. ADAR1 positivity refers to the double-positive staining for both anti-CD138 and anti-ADAR1. (D) qPCR analysis of ADAR1 mRNA expression of primary samples (from healthy donors and patients with MM) and MM cell lines. Relative expression was calculated with ddCt method normalizing to GAPDH expression. (E) GEP analysis of ADAR1 expression in patients enrolled into Mayo Clinic and University of Arkansas for Medical Sciences (UAMS) clinical trial based on different translocation/cyclin D (TC) classification. (F) Kaplan-Meier curve demonstrating the overall survival of patients (from different MM data sets; namely, Assessment of Proteasome Inhibition for Extending Remissions [APEX] and UAMS) with differential ADAR1 expression. CI, confidence interval; HR, hazard ratio; HV, healthy volunteer; MGUS, monoclonal gammopathy of undetermined significance; MM, multiple myeloma; ND, newly diagnosed; PCL, plasma cell leukemia; R, relapsed; SMM, smoldering multiple myeloma.
ADAR1 overexpression is an independent prognostic marker. (A) Analysis of ADAR1 expression in publicly available MM patient data sets from Italian GSE13591 (n = 158) and Mayo Clinic (n = 162). Average (avg) intensity of the GEP probe of each patient group is stated on the graphs, with their standard deviation (sd). (B) ADAR1 mRNA expression from the whole-transcriptome sequencing of our in-house primary patient samples (n = 17) on the Illumina Hi-Seq 4000 platform. The mean expression (Ave) ± sd for each cohort is stated in the table below the graph. (C) Immunofluorescence analysis of ADAR1 expression in bone marrow tissue microarray (left, L), with corresponding segmented image masks (right, R). CD138 marks plasma cells. Percentage of double positivity (CD138+/ADAR1+) is indicated below the images. Color coding is stated on the figure. Dot plot on the right is the quantification of the immunofluorescence analysis of ADAR1 protein expression on the TMA. ADAR1 positivity refers to the double-positive staining for both anti-CD138 and anti-ADAR1. (D) qPCR analysis of ADAR1 mRNA expression of primary samples (from healthy donors and patients with MM) and MM cell lines. Relative expression was calculated with ddCt method normalizing to GAPDH expression. (E) GEP analysis of ADAR1 expression in patients enrolled into Mayo Clinic and University of Arkansas for Medical Sciences (UAMS) clinical trial based on different translocation/cyclin D (TC) classification. (F) Kaplan-Meier curve demonstrating the overall survival of patients (from different MM data sets; namely, Assessment of Proteasome Inhibition for Extending Remissions [APEX] and UAMS) with differential ADAR1 expression. CI, confidence interval; HR, hazard ratio; HV, healthy volunteer; MGUS, monoclonal gammopathy of undetermined significance; MM, multiple myeloma; ND, newly diagnosed; PCL, plasma cell leukemia; R, relapsed; SMM, smoldering multiple myeloma.
Consistent with the literature,15,23 our analyses (supplemental Figure 1D-E) revealed a correlation between ADAR1 and 1q21(amp) with worsened survival in the patients. However, a closer look at the survival trend in the CoMMpass patients showed that only around 50% of them in the high ADAR1 group survived beyond 90 months, whereas more than 65% of 1q21(amp) patients did so (supplemental Figure 1C vs supplemental Figure 1E). In view of this, we conducted a multivariate Cox-model regression analysis to determine whether ADAR1 expression has independent prognostic value relative to 1q21 status. After the statistical adjustment, we indeed observed a significant difference of survival only in the high- and low-ADAR1 patients but not in 1q21(amp) vs 1q21(WT) patients (supplemental Figure 1F), indicating that ADAR1 overexpression drives poor outcome independent of 1q21(amp). This finding was confirmed by another set of statistical analyses, using the Flexible Parametric Survival and Multi-State Test Models (which uses 13 different types of distribution; supplemental Table 2).
MM transcriptome is hyperedited and is directly regulated by ADAR1
We next characterized how ADAR1 overexpression might disrupt the integrity of the RNA editome in MM. We analyzed the RNA-seq data of our in-house samples consisting of normal CD138+ plasma cells, MGUS, and newly diagnosed and relapsed MM. Consistent with the literature,11,24 A-to-G conversion (T-to-C on the reverse strands) was the most common type of editing seen across all groups (supplemental Figure 2A). Importantly, we observed a significant increase in A-to-G editing events in the newly diagnosed and relapsed samples as compared with the normal plasma cells, suggesting that the MM editome was aberrantly hyperedited (Figure 2A). There was a good correlation between these editing events and ADAR1 expression, seen not only in our in-house data but also in the CoMMpass data set (Figure 2B). Conversely, the correlation between global editing events and another editing member, ADAR2, was poor (supplemental Figure 2B). ADAR1 was also evidently more abundant than ADAR2 (supplemental Figure 2C), indicating that ADAR1 is primarily responsible for the perturbed editome in MM. More important, a high number of editing was greatly associated with worse overall survival in the patients (Figure 2C). Multivariate analysis revealed that its prognostic effect was consistently independent of 1q21(amp) (Figure 2Cii).
![Figure 2. MM transcriptome is hyperedited and directly regulated by ADAR1. (A) Total number of editing sites detected across the whole transcriptome (also referred to as global events) in patients from different disease stages. The sequencing platform used was Illumina Hi-Seq 4000. (B) Correlation of global A-to-G editing events with ADAR1 expression in in-house samples (top) and in CoMMpass patients (bottom). (Ci-ii) Overall survival of CoMMpass patients based on differential editing levels (Cii). Multivariate analysis of overall survival in patients according to different prognostic factors. P value in red indicates statistical significance. Amp, amplification; ISS, International Staging System; PI, proliferation index; wt, wild type. (D, top) Validation of ADAR1 knockdown and overexpression in U266 and MM1s, respectively. (Bottom) Fold change in the global A-to-G editing frequency in OCIMY5-ADAR1-WT and OCIMY5-ADAR1-Mut (deaminase mutant) and U266-shADAR1 #1 and #3 relative to EV and shCtrl, respectively. Percentage fold change of A>G events in U266 was calculated with the formula of [(% of events in shADAR #1 or #3−% of events in shCtr)/% of events in shCtr]×100. Percentage-fold change of A>G events in MM1s was calculated with the formula of [(% of events in ADAR1-WT or ADAR1-Mut−% of events in EV)/% of events in EV]×100. (E) A-to-G editing frequency of known ADAR1 targets (MAGT1, SRP9, and PODXL) on ADAR1 knockdown (U266) and overexpression (MM1s), detected by Sanger sequencing. Arrow indicates the site of editing. Green peak represents A nucleotide, and black peak represents G nucleotide.](https://ash.silverchair-cdn.com/ash/content_public/journal/blood/132/12/10.1182_blood-2018-02-832576/4/m_blood832576f2.png?Expires=1767711388&Signature=BlHodk2fpZ2aOP~YUZ-leCvexTAmbg0HpP13B8OgrFfECZfveq1zQagMCNpeI5ccALzzzmeFe0hkqL-4ddRAGTJHOKPuDiEY1OeCcRT1ed4gmtWxmz4fgjomsxOFcdAosYAo021VlLjk0PrFxH7TYMc1MctM5FRSY4tM5T7ftvIaSeW2SiTgYCI718uurPQnHGE5aIZ5syFXFsQQYcoZmO2RUxzy8SQaDq3G0teLlv4tpFgNrTRrVjq2pRK8RIME4uem-Te-TgIILEEY~U-wqSuJn6qFJw9cGkYS5shHkQ~G-s2X0qNqOcecGQvRn~RftVM9~6HHPzLoeb5OsHGSHw__&Key-Pair-Id=APKAIE5G5CRDK6RD3PGA)
MM transcriptome is hyperedited and directly regulated by ADAR1. (A) Total number of editing sites detected across the whole transcriptome (also referred to as global events) in patients from different disease stages. The sequencing platform used was Illumina Hi-Seq 4000. (B) Correlation of global A-to-G editing events with ADAR1 expression in in-house samples (top) and in CoMMpass patients (bottom). (Ci-ii) Overall survival of CoMMpass patients based on differential editing levels (Cii). Multivariate analysis of overall survival in patients according to different prognostic factors. P value in red indicates statistical significance. Amp, amplification; ISS, International Staging System; PI, proliferation index; wt, wild type. (D, top) Validation of ADAR1 knockdown and overexpression in U266 and MM1s, respectively. (Bottom) Fold change in the global A-to-G editing frequency in OCIMY5-ADAR1-WT and OCIMY5-ADAR1-Mut (deaminase mutant) and U266-shADAR1 #1 and #3 relative to EV and shCtrl, respectively. Percentage fold change of A>G events in U266 was calculated with the formula of [(% of events in shADAR #1 or #3−% of events in shCtr)/% of events in shCtr]×100. Percentage-fold change of A>G events in MM1s was calculated with the formula of [(% of events in ADAR1-WT or ADAR1-Mut−% of events in EV)/% of events in EV]×100. (E) A-to-G editing frequency of known ADAR1 targets (MAGT1, SRP9, and PODXL) on ADAR1 knockdown (U266) and overexpression (MM1s), detected by Sanger sequencing. Arrow indicates the site of editing. Green peak represents A nucleotide, and black peak represents G nucleotide.
MM transcriptome is hyperedited and directly regulated by ADAR1. (A) Total number of editing sites detected across the whole transcriptome (also referred to as global events) in patients from different disease stages. The sequencing platform used was Illumina Hi-Seq 4000. (B) Correlation of global A-to-G editing events with ADAR1 expression in in-house samples (top) and in CoMMpass patients (bottom). (Ci-ii) Overall survival of CoMMpass patients based on differential editing levels (Cii). Multivariate analysis of overall survival in patients according to different prognostic factors. P value in red indicates statistical significance. Amp, amplification; ISS, International Staging System; PI, proliferation index; wt, wild type. (D, top) Validation of ADAR1 knockdown and overexpression in U266 and MM1s, respectively. (Bottom) Fold change in the global A-to-G editing frequency in OCIMY5-ADAR1-WT and OCIMY5-ADAR1-Mut (deaminase mutant) and U266-shADAR1 #1 and #3 relative to EV and shCtrl, respectively. Percentage fold change of A>G events in U266 was calculated with the formula of [(% of events in shADAR #1 or #3−% of events in shCtr)/% of events in shCtr]×100. Percentage-fold change of A>G events in MM1s was calculated with the formula of [(% of events in ADAR1-WT or ADAR1-Mut−% of events in EV)/% of events in EV]×100. (E) A-to-G editing frequency of known ADAR1 targets (MAGT1, SRP9, and PODXL) on ADAR1 knockdown (U266) and overexpression (MM1s), detected by Sanger sequencing. Arrow indicates the site of editing. Green peak represents A nucleotide, and black peak represents G nucleotide.
Experimental manipulation of ADAR1 level influenced the total editing events across the transcriptome, in a deaminase domain-dependent manner. Depleting ADAR1 level led to a global reduction of A-to-G conversion by more than 20%, whereas overexpression of ADAR1-WT and ADAR1-Mut (deaminase mutant) protein, respectively, resulted in a 33% and only a 9% increase in editing (Figure 2D). Consistently, the same trend was observed at the gene-specific level when we performed site-specific-PCR-direct sequencing on known ADAR1 targets (Figure 2E). These data confirm the functional importance of ADAR1 in maintaining the integrity of A-to-I editome in MM, wherein its equilibrium could have been disrupted in view of its overexpression in MM.
ADAR1 exhibits oncogenic effects in an RNA-editing-dependent manner
Lazzari et al demonstrated how recoding of GLI1 protein contributed to the enhancement of stem cell features of MM.15 Although this is interesting, we sought to determine the effects of global hyperediting on the general growth and proliferation capacity of MM.
When we silenced ADAR1 in U266 (supplemental Figure 3A), there was a significant growth inhibition, manifested by lower growth rate (Figure 3A), increased sub-G1 cell populations (Figure 3B), and formation of lesser and much smaller (needle-like) colonies on soft agar (Figure 3C). Conversely, ectopic introduction of ADAR1-WT protein into the MM cells (supplemental Figure 3B) conferred growth advantage and a more proliferative cellular profile. KMS12BM-ADAR1-WT exhibited significantly higher cell growth (Figure 3A), was enriched in the S-phase cell cycle (Figure 3B), and possessed increased colony formation ability as compared with the empty vector control cells (Figure 3C). To identify whether these oncogenic phenotypes were truly RNA-editing-dependent, we constructed an ADAR1 plasmid that encodes for a deaminase-defective protein and subsequently introduced it into the MM cells. As shown in Figure 3A-C, phenotypes seen in OCIMY5-ADAR1-WT were reversed in the OCIMY5-ADAR1-Mutant. To rule out cell line-specific effects, we repeated the same experiments on H929 (ADAR1 knockdown) and OCIMY5 (ADAR1 overexpression) and observed similar trends (supplemental Figure 3C-D). It is noteworthy that the cell growth assay was performed over a 5-day time course, and although we observed significant difference between cells with differential ADAR1 expression, we cannot conclude how long this effect would be sustained.

ADAR1 exhibits oncogenic effects in an RNA-editing-dependent manner. (A) Cell growth curve of U266 (top) and KMS12BM (bottom) after ADAR1 knockdown and overexpression during a 5-day course. (B) Percentage cell population in different cell cycle phases of U266 and KMS12BM after ADAR1 knockdown and overexpression. (C) Representative images and the quantification of colonies formed in U266 (top) and KMS12BM (bottom) grown in methylcellulose-based media during a 7-14-day period. Each experiment was performed in triplicate, and data were expressed as the mean ± sd of triplicate wells. (D) Quantification of tumor volume and image of tumors formed in mice engrafted with U266-shCtrl and U266-shADAR1 at both the left and the right flanks, respectively (n = 5), and in mouse groups engrafted with OCIMY5-EV, OCIMY5-ADAR1-WT, or OCIMY5-ADAR1-Mutant (n = 15). (E) Western blot showing ADAR1 protein expression deriving from the harvested and lysed mouse tumors. **P < .05; ***P < .001.
ADAR1 exhibits oncogenic effects in an RNA-editing-dependent manner. (A) Cell growth curve of U266 (top) and KMS12BM (bottom) after ADAR1 knockdown and overexpression during a 5-day course. (B) Percentage cell population in different cell cycle phases of U266 and KMS12BM after ADAR1 knockdown and overexpression. (C) Representative images and the quantification of colonies formed in U266 (top) and KMS12BM (bottom) grown in methylcellulose-based media during a 7-14-day period. Each experiment was performed in triplicate, and data were expressed as the mean ± sd of triplicate wells. (D) Quantification of tumor volume and image of tumors formed in mice engrafted with U266-shCtrl and U266-shADAR1 at both the left and the right flanks, respectively (n = 5), and in mouse groups engrafted with OCIMY5-EV, OCIMY5-ADAR1-WT, or OCIMY5-ADAR1-Mutant (n = 15). (E) Western blot showing ADAR1 protein expression deriving from the harvested and lysed mouse tumors. **P < .05; ***P < .001.
Nevertheless, the mouse xenograft studies were consistent with our in vitro data. The tumors induced by U266-shADAR1 was significantly smaller than those induced by U266-shCtrl (Figure 3D). In contrast, the tumors deriving from OCIMY5-ADAR1-WT were visibly bigger compared with OCIMY5-EV and OCIMY5-ADAR1-Mut groups. Total protein isolated from these tumors showed reduced ADAR1 expression in U266-shADAR1 tumor and high ADAR1 expression in OCIMY5-ADAR1-WT and OCIMY5-ADAR1-Mut tumors (Figure 3E), strongly suggesting that the tumor growth was directly mediated by ADAR1. As the rescue with mutant ADAR1 is incomplete, we do not discount potential nonediting effects in ADAR1-induced oncogenesis in vivo. Nevertheless, taking into consideration the collective results from both the in vitro and in vivo studies, the RNA editing function of ADAR1 is important for its oncogenic effects in myeloma.
High ADAR1 mediates resistance of MM cells toward MM therapies
ADAR1-mediated-RNA editing has been shown to be able to affect drug sensitivity.13 To investigate whether this was true in MM, we correlated ADAR1 expression with patients’ responsiveness to different treatment regimes in CoMMpass data set. Indeed, patients with poor therapeutic response (stable and progressive disease) toward bortezomib-based and immunomodulatory-based therapies possessed high ADAR1 mRNA as compared with patients with good response (Figure 4A). There was no correlation between ADAR1 and patients’ responsiveness to carfilzomib-based treatments (supplemental Figure 4A), possibly because of the relatively lower number of patients treated this way. In relation to bortezomib, we observed that it was more effective in inhibiting growth of the cells with low ADAR1 (Figure 4B; supplemental Figure 4B). The bortezomib-treated fraction manifested a downregulated ADAR1 expression, in a dose- and time-dependent trend (Figure 4C; supplemental Figure 4C). In addition, the bortezomib-resistant HMCL (P100V) displayed higher ADAR1 expression than its WT-parental cells (RPMI-8226) (Figure 4D). Collectively, these imply that ADAR1 expression was closely correlated with cellular response to bortezomib treatments.

High ADAR1 mediates resistance of MM cells toward MM therapies. (A) Correlation of ADAR1 expression with patients’ response toward bortezomib-based and immunomodulatory drugs (IMIDs)-based treatments on the CoMMpass clinical trial. Poor response is represented by patients in stable disease and progressive disease stages. Good response is represented by patients who demonstrated complete response, very good partial response, and partial response. (B) Cell viability of U266-shCtrl and U266-shADAR1 cells on treatment with bortezomib of increasing concentration at 48 hours. (C) Western blot analysis of U266 on bortezomib treatment at different times (upper) and doses (lower). (D) Western blot analysis of the wild type (WT) and bortezomib-resistant (P100V) RPMI-8226 cell line. WT cell line was cultured in standard medium, whereas P100V was persistently cultured in medium containing 100 nM bortezomib. **P < .05; ***P < .001.
High ADAR1 mediates resistance of MM cells toward MM therapies. (A) Correlation of ADAR1 expression with patients’ response toward bortezomib-based and immunomodulatory drugs (IMIDs)-based treatments on the CoMMpass clinical trial. Poor response is represented by patients in stable disease and progressive disease stages. Good response is represented by patients who demonstrated complete response, very good partial response, and partial response. (B) Cell viability of U266-shCtrl and U266-shADAR1 cells on treatment with bortezomib of increasing concentration at 48 hours. (C) Western blot analysis of U266 on bortezomib treatment at different times (upper) and doses (lower). (D) Western blot analysis of the wild type (WT) and bortezomib-resistant (P100V) RPMI-8226 cell line. WT cell line was cultured in standard medium, whereas P100V was persistently cultured in medium containing 100 nM bortezomib. **P < .05; ***P < .001.
NEIL1 is an important editing target of ADAR1 in MM
Although many ADAR1-editing targets have been identified during the last decade, only a handful of them, including GLI1 in MM, showed a direct functional association.15,20,25 In view of the widespread occurrence of editing in human transcriptome, we reckon that an aberrant editing is very likely to happen to other genes and intend to identify other gene-specific-editing biomarkers relevant to MM. Consistent with previous reports,8,11 our whole-transcriptome sequencing analysis revealed an enrichment of editing at intronic and intergenic regions, in which the Alu-repeats are known to be predominantly located (Figure 5A; supplemental Figure 5). Nevertheless, our main focus was on the exons because it is the non-synonymous conversions that could finally lead to functional modifications of their proteins. Although the number of exonic editing was lower compared with other regions, it gradually increased along the disease progression route, thus underscoring its biological importance.

NEIL1 is an important editing target of ADAR1 in MM. (A, top) Distribution of the number of editing sites across different regions on the transcript. (Bottom) The average number of editing sites only on the exon region of mRNA in patients from different disease stages. (B) Venn diagram illustrating the number of nonsynonymous editing (identified from RNA-seq) in ADAR1-overexpressed (MM1s) and knockdown (U266) HMCLs. KD, knockdown; OE, overexpression. (C) Sequence chromatogram of NEIL1 demonstrating the A726G editing frequencies in MM1s and U266 on ADAR1 overexpression and knockdown, respectively. (D) RNA-immunoprecipitation assay documenting the fold enrichment of NEIL1 transcripts on ADAR1 protein in MM1s and U266 at the basal state and when ADAR1 was OE or KD. RIP2 and RIP3 are results from 2 different sets of primers encompassing nucleotide 726 of NEIL1 mRNA. (E) Venn diagram presenting the statistics of NEIL1 editing across the whole mRNA and at the specific site of interest (A726G). (F) The frequency of NEIL1 editing (A726G) in the transcripts of patients (in-house) from different disease stages. **P < .05; ***P < .001.
NEIL1 is an important editing target of ADAR1 in MM. (A, top) Distribution of the number of editing sites across different regions on the transcript. (Bottom) The average number of editing sites only on the exon region of mRNA in patients from different disease stages. (B) Venn diagram illustrating the number of nonsynonymous editing (identified from RNA-seq) in ADAR1-overexpressed (MM1s) and knockdown (U266) HMCLs. KD, knockdown; OE, overexpression. (C) Sequence chromatogram of NEIL1 demonstrating the A726G editing frequencies in MM1s and U266 on ADAR1 overexpression and knockdown, respectively. (D) RNA-immunoprecipitation assay documenting the fold enrichment of NEIL1 transcripts on ADAR1 protein in MM1s and U266 at the basal state and when ADAR1 was OE or KD. RIP2 and RIP3 are results from 2 different sets of primers encompassing nucleotide 726 of NEIL1 mRNA. (E) Venn diagram presenting the statistics of NEIL1 editing across the whole mRNA and at the specific site of interest (A726G). (F) The frequency of NEIL1 editing (A726G) in the transcripts of patients (in-house) from different disease stages. **P < .05; ***P < .001.
To identify an ADAR1 target that harbors potential biomarker value for further study, we overlapped the list of nonsynonymously edited genes derived from the RNA-seq of stable ADAR1-knockdown and ADAR1-overexpressed HMCLs. Of a total of 560 and 517 nucleotide sites affected by high and low ADAR1, respectively, 11 common sites displayed an inverse effect (Figure 5B). A thorough literature search and filtering of the list for biologically and disease-relevant genes then led us to the identification of NEIL1 (supplemental Table 3). The nucleotide of interest was located within exon 6 (A726G), alteration of which led to the recoding of lysine 242 to arginine (Lys242Arg). Direct sequencing confirmed the RNA-seq data, whereby a substantial reduction of NEIL1 editing was observed upon ADAR1 downregulation and a significant increase of editing was conferred by the overexpression of ADAR1-WT, but not the ADAR1-mutant protein (Figure 5C). As binding of ADAR1 to the double-stranded mRNA is needed to potentiate editing activities, we performed RNA immunoprecipitation to confirm that NEIL1 editing was indeed a direct effect of ADAR1 function. Pulling down the total protein with ADAR1-specific antibody gave an enrichment of NEIL1 transcripts encompassing position 726. This level of enrichment was effectively reduced with ADAR1 knockdown and was substantially increased with its overexpression (Figure 5D).
To establish the clinical effect of NEIL1 editing, we again analyzed the CoMMpass data set and identified that NEIL1 editing was ubiquitous, whereby, 85% of the patients were found to have at least 1 nucleotide modification across the whole mRNA. With reference to our position of interest (A726G), 80.6% of the total editing (68.9% of total number of patients) was found to take place at this nucleotide, indicating that NEIL1 was predominantly edited at this position in MM (Figure 5E). In keeping with increased ADAR1 activation, the newly diagnosed and relapsed patients were found to have increased level of this NEIL1 edited transcript (Figure 5F) compared with the healthy volunteers and patients with MGUS, clearly suggesting that this site-specific NEIL1 editing may be physiologically and biologically important for the pathogenesis of MM.
Edited NEIL1 possesses loss-of-function properties with compromised DNA-damage repair capabilities
To study the biological relevance of NEIL1-A726 editing, we stably introduced NEIL1-WT and the edited protein into a low ADAR1-expressing HMCL, OCIMY5 (supplemental Figure 6). In general, the NEIL1-edited cells exhibited loss-of- TSG function phenotypes (Figure 6A), such as increased colony-forming ability, higher growth rate, and enhanced cell cycle progression.
![Figure 6. Edited-NEIL1 possesses loss-of-function properties and a compromised DNA-damage repair capability. (A, left) Quantification of colonies formed in OCIMY5 with different NEIL1 status. Each experiment was performed in triplicate, and data were expressed as the mean ± SD of triplicate wells. (Right) Representative images of colonies formed in each cell line on the methylcellulose-based media. Arrows are pointing to the colonies formed. (Bottom left) Cell growth curve of OCIMY5 with different NEIL1 status over the course of 4 days. (Bottom right) Bar chart showing the proportion of OCIMY5 with different NEIL1 status in different cell cycle phases. The percentage of cells are stated on the diagram. (B, left) ROS assay measuring for the positivity of CM-H2DCFDA (ROS marker) in the untreated and melphalan-treated NEIL1-WT and NEIL1-edited OCIMY5. (Right) Enzyme-linked immunosorbent assay quantifying the level of oxidative damage (8-hydroxy-2-deoxyguanosine as the marker) in the untreated and melphalan-treated NEIL1-WT and NEIL1-edited OCIMY5. Relative percentage was calculated by dividing the values of melphalan-treatment over the nontreatment. Both cell lines were treated with 10 μM melphalan for 8 hours before being harvested for the assays. (C) Comet assay of untreated and melphalan-treated (10 μM, 8 hours) cells. Assay was performed in an alkaline condition for specific detection of single-stranded DNA breaks. Tail length was quantified with image J. (Left) Quantification of tail length. (Right) Representative images of each indicated conditions. (D) Relative changes of different cell cycle phases in NEIL1-WT and NEIL1-edited cells on melphalan treatment (10 μM, 8 hours). Relative changes were calculated with this formula: [(% melphalan treated cells−% untreated cells)/% untreated cells]×100. (E) Melphalan (10 μM) was withdrawn from NEIL1-WT and NEIL1-edited cells after 8 hours of treatment and were allowed to recover in complete medium, and their cell viability over the course of 5 days was observed with CTG assay. **P < .05; ***P < .001.](https://ash.silverchair-cdn.com/ash/content_public/journal/blood/132/12/10.1182_blood-2018-02-832576/4/m_blood832576f6.png?Expires=1767711388&Signature=BMBnrlk8aLim3VHKwEodu9GE8HvJ8hwm6tAD~OpLfm6DUkdFt0~dIn4JqbS7-VyI8vQ7AJJLDMfqioaspH-SScUrG8Vsek7muNNftd7xQT0qvqFGo5M8xrwbfVUqpFL3USOZD4aCe-HKVnqbAD72jqSxJNXyL2JgumJklxIwPd9U9-LpHWR~fnIcOcddOCgwQShqwLUtjSCe35RBVZVkMXjNkOFChqL-aUAJthNKm93YpoI37XFJwb1TuyssZuuQ5k2XyuctCLCjiftmMwA3VNTLCOSUVmt0SrXnXCUrHZhlI3cS3~Mt2F4V1q1yqwLw8MLepOwffAhlIdtqTWVSZQ__&Key-Pair-Id=APKAIE5G5CRDK6RD3PGA)
Edited-NEIL1 possesses loss-of-function properties and a compromised DNA-damage repair capability. (A, left) Quantification of colonies formed in OCIMY5 with different NEIL1 status. Each experiment was performed in triplicate, and data were expressed as the mean ± SD of triplicate wells. (Right) Representative images of colonies formed in each cell line on the methylcellulose-based media. Arrows are pointing to the colonies formed. (Bottom left) Cell growth curve of OCIMY5 with different NEIL1 status over the course of 4 days. (Bottom right) Bar chart showing the proportion of OCIMY5 with different NEIL1 status in different cell cycle phases. The percentage of cells are stated on the diagram. (B, left) ROS assay measuring for the positivity of CM-H2DCFDA (ROS marker) in the untreated and melphalan-treated NEIL1-WT and NEIL1-edited OCIMY5. (Right) Enzyme-linked immunosorbent assay quantifying the level of oxidative damage (8-hydroxy-2-deoxyguanosine as the marker) in the untreated and melphalan-treated NEIL1-WT and NEIL1-edited OCIMY5. Relative percentage was calculated by dividing the values of melphalan-treatment over the nontreatment. Both cell lines were treated with 10 μM melphalan for 8 hours before being harvested for the assays. (C) Comet assay of untreated and melphalan-treated (10 μM, 8 hours) cells. Assay was performed in an alkaline condition for specific detection of single-stranded DNA breaks. Tail length was quantified with image J. (Left) Quantification of tail length. (Right) Representative images of each indicated conditions. (D) Relative changes of different cell cycle phases in NEIL1-WT and NEIL1-edited cells on melphalan treatment (10 μM, 8 hours). Relative changes were calculated with this formula: [(% melphalan treated cells−% untreated cells)/% untreated cells]×100. (E) Melphalan (10 μM) was withdrawn from NEIL1-WT and NEIL1-edited cells after 8 hours of treatment and were allowed to recover in complete medium, and their cell viability over the course of 5 days was observed with CTG assay. **P < .05; ***P < .001.
Edited-NEIL1 possesses loss-of-function properties and a compromised DNA-damage repair capability. (A, left) Quantification of colonies formed in OCIMY5 with different NEIL1 status. Each experiment was performed in triplicate, and data were expressed as the mean ± SD of triplicate wells. (Right) Representative images of colonies formed in each cell line on the methylcellulose-based media. Arrows are pointing to the colonies formed. (Bottom left) Cell growth curve of OCIMY5 with different NEIL1 status over the course of 4 days. (Bottom right) Bar chart showing the proportion of OCIMY5 with different NEIL1 status in different cell cycle phases. The percentage of cells are stated on the diagram. (B, left) ROS assay measuring for the positivity of CM-H2DCFDA (ROS marker) in the untreated and melphalan-treated NEIL1-WT and NEIL1-edited OCIMY5. (Right) Enzyme-linked immunosorbent assay quantifying the level of oxidative damage (8-hydroxy-2-deoxyguanosine as the marker) in the untreated and melphalan-treated NEIL1-WT and NEIL1-edited OCIMY5. Relative percentage was calculated by dividing the values of melphalan-treatment over the nontreatment. Both cell lines were treated with 10 μM melphalan for 8 hours before being harvested for the assays. (C) Comet assay of untreated and melphalan-treated (10 μM, 8 hours) cells. Assay was performed in an alkaline condition for specific detection of single-stranded DNA breaks. Tail length was quantified with image J. (Left) Quantification of tail length. (Right) Representative images of each indicated conditions. (D) Relative changes of different cell cycle phases in NEIL1-WT and NEIL1-edited cells on melphalan treatment (10 μM, 8 hours). Relative changes were calculated with this formula: [(% melphalan treated cells−% untreated cells)/% untreated cells]×100. (E) Melphalan (10 μM) was withdrawn from NEIL1-WT and NEIL1-edited cells after 8 hours of treatment and were allowed to recover in complete medium, and their cell viability over the course of 5 days was observed with CTG assay. **P < .05; ***P < .001.
As NEIL1 is a base excision repair protein, we investigated the effect of recoding on its base excision repair function. From this point onward, experiments were performed using only the cells expressing high NEIL1-WT and NEIL1-edited, as OCIMY5 has a very low basal NEIL1 expression, and therefore is irrelevant to study NEIL1’s functions in the empty vector-transfected cells.
We treated these cells with a conventional antimyeloma drug, melphalan, which causes single-nucleotide alkylation and mono-adducts formation (single-strand breaks).26,27 ROS, 8-hydroxy-2-deoxyguanosine, and alkaline Comet (for specific detection of single-stranded DNA breaks) assays demonstrated a higher level of melphalan-induced oxidative damage in the NEIL1-edited cells compared with the NEIL1-WT cells (Figure 6B and 6C). This observation is commensurate with lesser enrichment of cells in the G1/S-phase of the cell cycle in the melphalan-treated-NEIL1-edited cells than its WT counterpart, indicating that the former were not as competent in stalling their cell cycle progression for the commencement of DNA repair (Figure 6D). Furthermore, drug treatment withdrawal assay demonstrated that NEIL1-edited cells had an enhanced growth rate, consistent with its inadequate cell cycle stalling (Figure 6E). Collectively, these data suggest that the recoded NEIL1 had a less efficient oxidative damage repair capability, potentially contributing to its gain-of-function properties.
NEIL1 editing enhances double-stranded DNA damage repair responses
With a compromised DNA damage repair function and a heightened intracellular oxidative damage, one would expect NEIL1-edited cells to be more sensitive to DNA-damaging drugs. Ironically, we repeatedly saw them to be more resistant to melphalan than the NEIL1-WT cells (Figure 7A; supplemental Figure 7A). This then led us to hypothesize that the suboptimal single-stranded DNA breaks repair in the NEIL1-edited cells predisposed them to double-stranded DNA breaks (DSB) that then activates the DSB repair pathway, ultimately promoting cell growth and survival.27 If this were true, then the NEIL1-edited cells should contain higher levels of DSB repair proteins. Indeed, established markers for DSB such as phospho-H2AX, phospho-CHK1, p-BRCA1, and Ku80 were clearly upregulated in the NEIL1-edited cells (Figure 7B; supplemental Figure 7B).
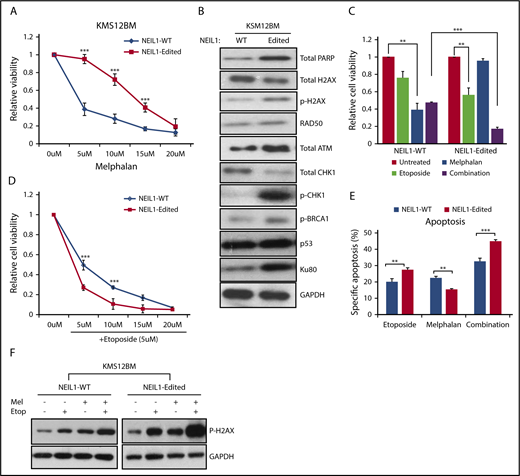
NEIL1-editing enhances double-stranded DNA damage repair responses. (A) Cell viability of NEIL1-WT and NEIL1-edited KMS12BM when treated with increased doses of melphalan for 48 hours. (B) Western blot analysis of protein expression profile of various DNA-damage-repair factors in NEIL1-WT and NEIL1-edited cells. (C) Cell viability of NEIL1-WT and NEIL1-edited cells when exposed to treatment of either etoposide (5 μM), melphalan (5 μM), or a combination of both for 48 hours. Untreated cells were vehicle (phosphate-buffered saline) control. (D) Cell viability of NEIL1-WT and NEIL1-edited cells when exposed to a combination of etoposide (5 μM) and increased melphalan concentration (5, 10, 15, 20 μM) for 48 hours. (E) Cells were incubated with etoposide (5 μM), melphalan (5 μM), or a combination of both for 48 hours, and apoptosis was measured with Annexin-V assay. Percentage specific apoptosis was calculated with the formula of % specific apoptosis = (treated−untreated)×100/(100−untreated), as previously reported.2 (F) Western blot analysis of phospho-H2AX expression after the cells were subjected to either etoposide (5 μM), melphalan (5 μM), or a combination of both for 48 hours. **P < .05; ***P < .001.
NEIL1-editing enhances double-stranded DNA damage repair responses. (A) Cell viability of NEIL1-WT and NEIL1-edited KMS12BM when treated with increased doses of melphalan for 48 hours. (B) Western blot analysis of protein expression profile of various DNA-damage-repair factors in NEIL1-WT and NEIL1-edited cells. (C) Cell viability of NEIL1-WT and NEIL1-edited cells when exposed to treatment of either etoposide (5 μM), melphalan (5 μM), or a combination of both for 48 hours. Untreated cells were vehicle (phosphate-buffered saline) control. (D) Cell viability of NEIL1-WT and NEIL1-edited cells when exposed to a combination of etoposide (5 μM) and increased melphalan concentration (5, 10, 15, 20 μM) for 48 hours. (E) Cells were incubated with etoposide (5 μM), melphalan (5 μM), or a combination of both for 48 hours, and apoptosis was measured with Annexin-V assay. Percentage specific apoptosis was calculated with the formula of % specific apoptosis = (treated−untreated)×100/(100−untreated), as previously reported.2 (F) Western blot analysis of phospho-H2AX expression after the cells were subjected to either etoposide (5 μM), melphalan (5 μM), or a combination of both for 48 hours. **P < .05; ***P < .001.
This higher expression level of DSB repair proteins would imply that the intracellular stress level is already heightened; thus, it is plausible that further perturbation to the cells could easily tip the cellular condition to the pro-apoptotic state. In other words, these cells would be more sensitive to DSB-inducing agents. Etoposide, a known DSB inducer, was subsequently used to treat the cells as a single agent or in combination with melphalan. Confirming our hypothesis, NEIL1-edited cells demonstrated a significantly higher cellular inhibition in response to single and combination etoposide treatment than its WT partner (Figure 7C-D; supplemental Figure 7C-D). Consistently, the annexin-V assay showed increased apoptosis in the etoposide and combination-treated NEIL1-edited cells than the NEIL1-WT cells (Figure 7E), in good correlation with phospho-H2AX expression (Figure 7F).
Discussion
The treatment landscape of MM has changed dramatically in the last decade, with the introduction of new therapeutic strategies both in frontline and relapse settings.3 Although the patients’ prognosis has definitely improved, most patients will eventually relapse and develop therapeutic resistance.3,28 Genetic studies have uncovered a significant amount of information, and although some genetic abnormalities are associated with poor outcomes, they are unable to explain many cases that have inferior outcome.5,13 The tremendous heterogeneity that underlies MM has led us to speculate that there is a wide diversity of mechanisms governing the disease pathogenesis.
RNA editing has been actively studied during the recent years, and its aberration has been associated with different kinds of cancer.17,29 As compared with solid tumors, this topic has not been comprehensively studied in hematological malignancies, and it was only recently that deregulated RNA editing was reported in MM.15 That study emphasized how ADAR1 overexpression promoted stem cell features of MM through increased Alu-dependent editing of GLI1. However, until now, nothing has been known about the integrity of MM transcriptome and the global changes in A-to-I-editing events. The human editome is complex, and different cancers exhibit different editing architecture.12,13,21 The changes to the universal landscape of editing were reported to carry functional and clinical significance13 ; therefore, the global evaluation of editing events is important for the understanding of the prognostic effects of ADAR1 overexpression and its transcriptomic regulation and function in MM.
Our analyses revealed that the MM transcriptome was in an abnormally hyperedited state, commensurate with high ADAR1 expression, and the extent of editing is associated with disease progression and poor outcome. Although ADAR1 is located on chromosome 1q21, which is commonly gained in MM,15,23 we showed that both ADAR1 and the global editing events apparently have a prognostic effect independent of 1q21 status. This shows that 1q21(amp) may not universally drive high levels of ADAR1 expression, but the gene is indeed important and the ADAR1-mediated hyperediting events are biologically and functionally relevant. Our collective data from the in vitro and in vivo functional studies support that ADAR1 could enhance the growth and proliferation of MM cells in an editing-dependent manner.
Further demonstrating its vital contribution to disease aggressiveness, patients with high ADAR1 expression showed less responsiveness toward standard and novel therapies. Therefore, our findings implied that a disturbed editome mediated by ADAR1 overexpression is both clinically and functionally crucial in our disease setting, and that ADAR1 confers oncogenic properties in myeloma in an editing-dependent manner.
RNA editing is a promiscuous process that can take place within any region of a double-stranded mRNA, giving rise to transcriptomic diversity.8,9,11 Although editing occurs more commonly at the untranslated region and intronic regions, it is the modifications on the exons that can cause protein recoding and directly affect its functions. Many genes have been reported to be ADAR1 targets; however, only a handful have been studied biologically and have shown functional relevance.8,14,15,20,21,30 In this study, we focused on identifying critical nonsynonymous editing sites. Our detailed analysis of RNA-seq data led to the identification of NEIL1 as an important and relevant editing target in MM. Nonsynonymous conversion of A726G NEIL1 was a ubiquitous event, accounting for 68.9% of the incidence, suggesting that this site-specific editing is of physiological importance. Among other malignancies, lung carcinoma and colorectal cancer have also been briefly reported with a recurrent NEIL editing, albeit at 1 nucleotide position ahead (A725G).23,31 These studies did not show a direct functional consequence of NEIL1 editing.
Imperatively, our functional analyses provided strong biological relevance of this editing event in MM, whereby NEIL1-edited MM cells demonstrated a more proliferative nature, had a loss of DNA damage repair ability, and showed an increased resistance to a standard antimyeloma agent, melphalan. The nonsynonymous NEIL1 modifications (A725G and A726G) have been previously reported to be able to reduce its glycosylase capacity,32 thus supporting our finding of the recoded NEIL1 being inefficient in DNA damage repair. Notably, we also observed that NEIL1 expression actually decreases as disease progresses, and its expression level was significantly associated with overall survival (supplemental Figure 8; supplemental Table 4). Furthermore, melphalan resistance has also been associated with NEIL1 underexpression in MM cells,27 therefore confirming that a compromised NEIL1 function, be it a result of downregulation or of misediting, is clinically important in MM.
As an unrepaired DNA damage can predispose the genome to increased random mutagenesis,33 it is conceivable that defective NEIL1 functions could induce accumulation of sporadic mutations. This is potentially hazardous to the pro-oncogenome, where their activation could increase cancer susceptibility. Indeed, cancer genomes with an abnormal NEIL1 expression have been associated with a reduced oxidative repair capacity and an increased somatic mutational load.34 Therefore, it is plausible that an aberrant NEIL1 mRNA and its protein product may be 1 of the mechanisms by which RNA editing affects the genome integrity and how it wires the MM cells into acquiring undesirable mutations to further trigger disease pathogenesis.
With NEIL1-edited cells being more sensitive to combination treatment of single-stranded DNA breaks and DSB-inducing agents (melphalan and etoposide in our case), NEIL1-Lys242Arg could potentially be used as a predictive biomarker. In addition, a previous proof-of-concept work has reported an effective blocking of site-specific NEIL1 editing with antisense-oligonucleotides, suggesting the targetability of this epigenetic deregulation, and thus, should be further explored as a potential therapeutic candidate.35
To the best of our knowledge, this is the first report of ADAR1-mediated-hypereditome being an independent prognostic factor. The compromised integrity of MM transcriptome drives oncogenic phenotypes, likely contributing to the disease pathogenesis. Our current work, therefore, recognizes the clear biological and clinical importance of A-to-I editing at both the whole-transcriptome and gene-specific level (NEIL1) in MM. This sets the stage for future studies on RNA defects in MM, which may unravel hidden aspects and unknown mechanisms in the disease that are biologically and clinically important.
The online version of this article contains a data supplement.
The publication costs of this article were defrayed in part by page charge payment. Therefore, and solely to indicate this fact, this article is hereby marked “advertisement” in accordance with 18 USC section 1734.
Acknowledgments
The authors thank Yufen Goh for helping with the processing of primary samples from the healthy volunteers and Pamela Chng for helping with some experiments for the revision.
W.J.C. is supported by National Medical Research Council (NMRC) Singapore Translational Research Investigatorship. This research is partly supported by the National Research Foundation Singapore and the Singapore Ministry of Education under the Research Centers of Excellence initiative, as well as the RNA Biology Center at the Cancer Science Institute of Singapore, National University of Singapore (NUS), as part of funding under the Singapore Ministry of Education’s Tier 3 grants, grant number MOE2014-T3-1-006. The computational work for this article was partially performed on resources of National Supercomputing Centre, Singapore (https://www.nscc.sg).
Authorship
Contribution: P.J.T. designed the study and performed all the wet experiments, analyzed and interpreted data, and was entirely involved in the manuscript preparation, from drafting and editing to final submission; O.A., T.-H.C., and H.Y. were involved in bioinformatics analyses of MM data sets; O.A. also contributed to the preparation of the main figures; J.Y.C. and S.H.M.T. performed the mouse xenograft work; S.F. and S.B.N. performed immunofluorescence on patient tissue microarrays, imaging, and data analysis; W.W., B.T.H.K., and M.J.F. collected primary samples from the healthy volunteers; M.G.O., S.d.M., and C.Y.S. were involved in the collection of primary patient samples in the clinic; L.C. provided experimental advice, contributed vital reagents, and proofread the manuscript; and W.J.C. initialized the study, provided study direction, and proofread and finalized the manuscript.
Conflict-of-interest disclosure: The authors declare no competing financial interests.
Correspondence: Wee Joo Chng, National University of Singapore, NUHS Tower Block #7, 1E Kent Ridge Rd, Singapore 119228, Singapore; e-mail: csicwj@nus.edu.sg.
