Key Points
AML cells have increased cytoplasmic nucleoside kinase expression, which functionally contribute to mtDNA biosynthesis.
AML cells preferentially activated the nucleoside analog ddC, which inhibited mtDNA replication, oxphos, and induced anti-AML effects.
Abstract
Mitochondrial DNA (mtDNA) biosynthesis requires replication factors and adequate nucleotide pools from the mitochondria and cytoplasm. We performed gene expression profiling analysis of 542 human acute myeloid leukemia (AML) samples and identified 55% with upregulated mtDNA biosynthesis pathway expression compared with normal hematopoietic cells. Genes that support mitochondrial nucleotide pools, including mitochondrial nucleotide transporters and a subset of cytoplasmic nucleoside kinases, were also increased in AML compared with normal hematopoietic samples. Knockdown of cytoplasmic nucleoside kinases reduced mtDNA levels in AML cells, demonstrating their contribution in maintaining mtDNA. To assess cytoplasmic nucleoside kinase pathway activity, we used a nucleoside analog 2′3′-dideoxycytidine (ddC), which is phosphorylated to the activated antimetabolite, 2′3′-dideoxycytidine triphosphate by cytoplasmic nucleoside kinases. ddC is a selective inhibitor of the mitochondrial DNA polymerase γ. ddC was preferentially activated in AML cells compared with normal hematopoietic progenitor cells. ddC treatment inhibited mtDNA replication, oxidative phosphorylation, and induced cytotoxicity in a panel of AML cell lines. Furthermore, ddC preferentially inhibited mtDNA replication in a subset of primary human leukemia cells and selectively targeted leukemia cells while sparing normal progenitor cells. In animal models of human AML, treatment with ddC decreased mtDNA, electron transport chain proteins, and induced tumor regression without toxicity. ddC also targeted leukemic stem cells in secondary AML xenotransplantation assays. Thus, AML cells have increased cytidine nucleoside kinase activity that regulates mtDNA biogenesis and can be leveraged to selectively target oxidative phosphorylation in AML.
Introduction
Acute myeloid leukemia (AML) cells have unique mitochondrial characteristics such as increased mitochondrial biogenesis, decreased spare reserve capacity, and increased reliance on oxidative phosphorylation compared with normal hematopoietic progenitors1-3 that make a subset of AML cells susceptible to agents that target mitochondrial function. Mitochondria contain multiple copies of their own 16.6-kb genome which encodes 13 subunits of electron transport chain complexes necessary for oxidative phosphorylation. These genes are replicated, transcribed, and translated within the mitochondria using specialized machinery. Mitochondrial DNA (mtDNA) is synthesized independent of cell cycle status and copied solely by mitochondrial DNA polymerase γ (POLG), accompanied by replication factors such as mitochondrial transcription factor A (TFAM), mitochondrial RNA polymerase (POLRMT), and the mitochondrial helicase Twinkle.4,5
mtDNA biosynthesis is also dependent on an adequate supply of nucleotide pools, which are derived from mitochondrial and cytoplasmic pathways. Within the mitochondria, the mitochondrial nucleotide salvage pathway converts nucleoside precursors to nucleotides by a cascade of kinases.6 Nucleotides are also imported into the mitochondria from the cytoplasm by specialized nucleotide transporters.7-9 In the cytoplasm, nucleoside diphosphates synthesized from the de novo biosynthesis pathway funnel into the cytoplasmic nucleotide salvage pathway. Kinases in this pathway catalyze the phosphorylation of nucleosides to nucleotides, similar to the mitochondria.10,11 In this study, we assessed the activity of the cytoplasmic nucleotide salvage pathway in AML and its contribution to mtDNA biosynthesis.
Materials and methods
Bioinformatic analysis
Affymetrix gene expression data of AML (542 samples) and healthy bone marrow samples (73 samples) from the Haferlach data set were downloaded from The Leukemia Gene Atlas (LGA) portal in March 2016.12 The platform used is Affymetrix Human Genome U133 Plus 2.0 Array and the data values correspond to robust multichip average expression measure. Official gene symbols from the Hugo Gene Nomenclature Committee were retrieved from the Affymetrix probe identifiers using the R package “biomaRt” (biomaRt_2.26.1 and R version 3.2.3) and searched against Ensembl Genes version 84. Data were reduced at the gene level by selecting the probe with the highest median absolute deviation across samples per gene. In 1 case (POLG), 2 of 3 probes (203366_at, 217635_at) displayed a similar POLG expression pattern, whereas the highest median absolute deviation score probe (217636_at) did not and was excluded from the analysis. Instead, 203366_at was used for analysis. In order to study the gene expression pattern within the AML samples, and between AML and normal patients, data were centered, scaled (z-score) and clustered using the heatmap.2 function available from the gplots R package (gplots_2.17.0). Using the default parameters, each row (gene) in the result has mean 0 and sample standard deviation 1. The z score is a normalized value, indicating how many standard deviations away the gene expression is compared with the mean expression of all samples for the same gene: z = (x − μ)/σ, where x is gene expression, μ is mean gene expression across samples, and σ is standard deviation of the population (for additional methods, see supplemental Methods available on the Blood Web site).
Primary AML and normal hematopoietic cells
Primary mononuclear cells were isolated from peripheral blood of consenting patients diagnosed with AML, who had at least 80% malignant cells among low-density cells isolated by Ficoll density gradient centrifugation. Normal peripheral blood stem cells (PBSCs) were obtained from healthy consenting volunteers donating peripheral blood for allogeneic stem cell transplantation after granulocyte colony-stimulating factor (G-CSF) mobilization. Normal CD34+ cells were isolated from PBSCs by immunomagnetic-positive isolation (EasySep Human CD34 Positive Selection kit; Stemcell Technologies, Vancouver, BC, Canada). Primary cells were cultured at 37°C in Iscove modified Dulbecco medium (IMDM) and supplemented with 20% fetal bovine serum (FBS), 2 mM l-glutamine, 2 ng/mL interleukin-3 (IL-3) cytokines, and 20 ng/mL stem cell factor. The collection and use of human tissue was approved by the University Health Network institutional review.
Cell lines
All cell lines were maintained at 37°C and 5% CO2. OCI-AML2, K562 cells, and HL-60 were cultured in IMDM supplemented with 10% FBS and appropriate antibiotics. TEX cells13 were cultured in IMDM supplemented with 20% FBS, 2 mM l-glutamine (Life Technologies, Carlsbad, CA), 2 ng/mL IL-3 (R&D Systems, Minneapolis, MN), 20 ng/mL stem cell factor (Miltenyi Biotec, San Diego, CA), and appropriate antibiotics. HEK 293 Flp-In TRex cell lines were cultured in Dulbecco H21 modified Eagle medium supplemented with 10% FBS and appropriate antibiotics.
Xenograft models of human AML
For in vivo studies, ddC was purchased from Sequoia Research Products (Pangbourne, United Kingdom). OCI-AML2 human leukemia cells (1 × 10⁶) were injected subcutaneously into the flanks of SCID mice (Ontario Cancer Institute, Toronto, ON, Canada). After the appearance of a palpable tumor (9-11 days), the mice were treated with 2′3′-dideoxycytidine (ddC) intraperitoneally (i.p.) once daily or by vehicle control (n = 7 per group) at a treatment schedule of 5 of 7 days for a total of 11 days at 35 and 75 mg/kg or for 9 days at 150 and 300 mg/kg ddC. Tumor volumes were measured 3 times per week based on caliper measurements of tumor length and width (volume = tumor length × width2 × 0.5236). At the end of treatment, mice were sacrificed and tumor volumes and mass were measured from excised tumors. To evaluate ddC efficacy in a primary AML engraftment mouse model, a frozen aliquot of primary AML cells was thawed, counted, and resuspended in phosphate-buffered saline. Viable trypan blue–negative cells (2 × 10⁶ to 3 × 10⁶) were injected into the right femur of 10-week-old female NOD-SCID mice that were previously irradiated, and injected with 200 µg of anti-mouse CD122. Mice were treated once daily with ddC at 75 mg/kg or vehicle control (n = 7 per group) for 3 weeks at a treatment schedule of 5 of 7 days. Following treatment, mice were euthanized and primary AML engraftment (CD45+CD33+CD19− cells) in the left femur was quantified by flow cytometry. To assess secondary engraftment, primary human AML cells were isolated from the bone marrow of control and ddC-treated mice. Cells were pooled and equal numbers of viable cells were transplanted into the right femur of secondary untreated mice. After 5 weeks, mice were sacrificed and human CD45+CD33+CD19− cells were assessed by flow cytometry. All in vivo studies were carried out according to the regulations of the Canadian Council on Animal Care and with the approval of the Ontario Cancer Institute Animal Ethics Review Board.
Statistical analysis
All statistical analyses were performed on Graph Pad Prism 6.03 (La Jolla, CA).
See supplemental Methods for additional materials and methods.
Results
A subset of primary AML cells display upregulated mtDNA biosynthesis and cytoplasmic nucleoside kinase pathways compared with normal hematopoietic samples
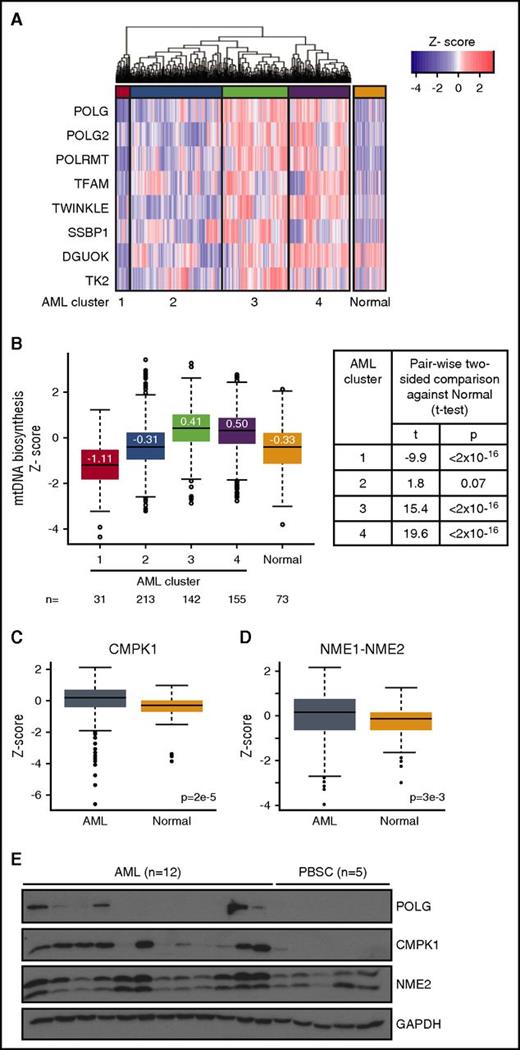
Our previous studies demonstrated that a subset of AML cells display increased mitochondrial biogenesis and mtDNA content compared with normal hematopoietic progenitors.2,3 Here, we examined the expression of the 8 core mtDNA biosynthesis genes in AML: POLG, POLG2, POLRMT, TFAM, mitochondrial single-stranded binding protein (MTSSB), and Twinkle (which collectively initiate and perform mtDNA replication14,15 ) and mitochondrial nucleoside kinases deoxyguanosine kinase (DGUOK) and thymidine kinase 2 (TK2) (involved in biosynthesis of mitochondrial nucleotide pools6 ). We compared the messenger RNA (mRNA) expression of the mtDNA biosynthesis gene signature between 542 human primary AML samples at diagnosis and 73 normal nonleukemia samples (mononuclear cells isolated from healthy bone marrow and peripheral blood) (GSE13159, the microarray data set from which gene expression profile data was extracted).12 Unsupervised hierarchical clustering analysis of AML samples identified 4 subsets of AML with significantly different mtDNA biosynthesis expression patterns, designated as AML clusters 1 to 4 (Figure 1A-B) (P < 2 × 10⁻¹⁶, pairwise 2-sided t tests adjusted for multiple hypothesis testing using the Benjamini-Hochberg method). Next, we compared the mtDNA biosynthesis pattern between all 4 AML clusters and normal samples. AML clusters 3 and 4, which comprise 55% of the total population, have higher mtDNA biosynthesis expression compared with median expression of normal samples; AML cluster 2 is not different than normal (P > .05) and AML cluster 1 has lower mtDNA biosynthesis expression compared with normal samples (Figure 1B) (P < 2 × 10⁻¹⁶ for all pairwise 2-sided t tests). Lastly, POLG, POLG2, Twinkle, and TFAM mRNA expression was upregulated preferentially in leukemia cell lines compared with other cancer cell lines in the Cancer Cell Line Encyclopedia (supplemental Figure 1). These results suggest an increased mtDNA biogenesis in a subset of AML samples and cell lines.
Subsets of AML display upregulated mtDNA biosynthesis and cytoplasmic nucleoside kinase expression. (A) Expression pattern and hierarchical clustering of microarray data from 542 primary human AML and 73 normal nonleukemic and healthy bone marrow samples12 for 8 mtDNA biosynthesis genes. The 4 main AML mtDNA biosynthesis clusters (purple, green, red, cyan) were designated as 1, 2, 3, and 4. A red color indicates a higher expression compared with the mean of all AML and normal samples; a blue color indicates a lower expression. (B) Boxplot of scaled data distribution (z-score) of the 4 AML clusters and normal samples for each of the 8 mtDNA biosynthesis genes from panel A. Values displayed on boxplot indicate median z-score values. Two-sided t tests were applied to estimate significance of differences between AML and normal clusters. (C-D) Boxplot of scaled data distribution (z-score) of cytoplasmic nucleoside kinases CMPK1 (C) and NME1-2 (D) between the 542 primary human AML and the 73 normal samples. Two-sided t test was applied to estimate significance of differences between these 2 groups. (E) Total proteins were extracted and immunoblotted for POLG, cytoplasmic nucleoside kinases CMPK1 and NME2, and loading control glyceraldehyde-3-phosphate dehydrogenase (GAPDH) in 12 human primary AML cells (A1-A12) and 5 normal G-CSF–mobilized PBSCs.
Subsets of AML display upregulated mtDNA biosynthesis and cytoplasmic nucleoside kinase expression. (A) Expression pattern and hierarchical clustering of microarray data from 542 primary human AML and 73 normal nonleukemic and healthy bone marrow samples12 for 8 mtDNA biosynthesis genes. The 4 main AML mtDNA biosynthesis clusters (purple, green, red, cyan) were designated as 1, 2, 3, and 4. A red color indicates a higher expression compared with the mean of all AML and normal samples; a blue color indicates a lower expression. (B) Boxplot of scaled data distribution (z-score) of the 4 AML clusters and normal samples for each of the 8 mtDNA biosynthesis genes from panel A. Values displayed on boxplot indicate median z-score values. Two-sided t tests were applied to estimate significance of differences between AML and normal clusters. (C-D) Boxplot of scaled data distribution (z-score) of cytoplasmic nucleoside kinases CMPK1 (C) and NME1-2 (D) between the 542 primary human AML and the 73 normal samples. Two-sided t test was applied to estimate significance of differences between these 2 groups. (E) Total proteins were extracted and immunoblotted for POLG, cytoplasmic nucleoside kinases CMPK1 and NME2, and loading control glyceraldehyde-3-phosphate dehydrogenase (GAPDH) in 12 human primary AML cells (A1-A12) and 5 normal G-CSF–mobilized PBSCs.
As increased mtDNA biosynthesis is associated with a larger requirement of available nucleotide pools, this need can be compensated by importing cytoplasmic pools through mitochondrial nucleotide transporters. Therefore, we investigated pathways which support mitochondrial nucleotide pools and observed higher overall gene expression levels of 3 of 4 known mitochondrial nucleotide transporters16,17 (SLC25A33, SLC25A36, and SLC29A3 but not SLC29A1) in AML compared with normal cells (supplemental Figure 2A, P < 1 × 10⁻⁸, t test), suggesting increased nucleotide import from the cytoplasm. We also observed a positive correlation (P < .05, paired t test of r values) between mtDNA nucleotide transporters SLC29A3 (r = 0.42) and SLC26A36 (r = 0.2), but not SLC29A1, SLC25A33, and mtDNA expression in AML (supplemental Figure 2B).
Next, we characterized the expression of kinases involved in biosynthesis of cytoplasmic nucleotide pools.11 Collectively, this kinase cascade catalyzes 3 sequential phosphorylation steps to convert deoxynucleosides to deoxynucleotides. Nucleoside monophosphate kinase CMPK1 and nucleoside diphosphate kinases NME1-NME2, which perform the second and third step of nucleoside phosphorylation, respectively, were upregulated in AML samples compared with normal hematopoietic cells by gene expression analysis (Figure 1C-D). In contrast, nucleoside kinases deoxycytidine kinase (DCK) and TK1, which perform the first phosphorylation step, were not upregulated in AML compared with normal (supplemental Figure 2A). Among AML samples, there was a positive correlation between NME1-NME2 (r = 0.57, P < .05) and DCK (r = 0.27, P < .05), but not TK1 and CMPK1 and mtDNA expression in AML (supplemental Figure 2B). We also assessed protein levels in an independent set of AML patient samples. Higher levels of POLG, CMPK1, and NME2 protein were seen in subset of primary AML samples (see supplemental Table 1 for patient characteristics) compared with normal hematopoietic progenitors (G-CSF–mobilized PBSCs from healthy donors) by immunoblotting (Figure 1E).
Cytoplasmic nucleoside kinases regulate mtDNA biosynthesis
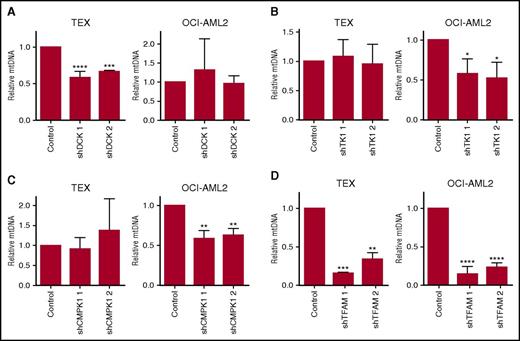
To determine whether cytoplasmic nucleoside kinases are functionally important for mtDNA biosynthesis, we performed lentiviral-mediated short hairpin (sh) RNA knockdown of DCK, TK1, and CMPK1 cytoplasmic nucleoside kinases in TEX and OCI-AML2 AML cell lines. Target knockdown was confirmed by immunoblotting (supplemental Figure 3). In TEX leukemia cells, knockdown of DCK reduced levels of mtDNA to 63% compared with control cells, whereas knockdown of TK1 and CMPK1 did not affect mtDNA levels. In contrast, knockdown of CMPK1 and TK1 in OCI-AML2 cells reduced mtDNA levels to 60% and 55%, respectively, compared with controls, but DCK knockdown did not reduce mtDNA levels (Figure 2A-C). Knockdown of the mtDNA replication factor TFAM decreased mtDNA content in both TEX and OCI-AML2 cells (Figure 2D). Thus, cytoplasmic nucleoside kinases contribute to mtDNA biogenesis, but contribution of individual kinases is cell-dependent.
Cytoplasmic nucleoside kinases regulate mtDNA levels. DCK (A), TK1 (B), CMPK1 (C), and TFAM (D) were knocked down with shRNA in TEX and OCI-AML2 cells as described in “Materials and methods.” After target knockdown, mtDNA content was assessed by quantitative reverse transcription polymerase chain reaction (qRT-PCR) using primers for mt-ND1 relative to nuclear-encoded HGB. Immunoblots are displayed in supplemental Figure 3. Data are shown as mean ± standard deviation (SD) of 3 independent experiments. *P < .05, **P < .01, ***P < .001, and ****P < .0001 using the Bonferroni posttest after 1-way ANOVA. NS, not significant.
Cytoplasmic nucleoside kinases regulate mtDNA levels. DCK (A), TK1 (B), CMPK1 (C), and TFAM (D) were knocked down with shRNA in TEX and OCI-AML2 cells as described in “Materials and methods.” After target knockdown, mtDNA content was assessed by quantitative reverse transcription polymerase chain reaction (qRT-PCR) using primers for mt-ND1 relative to nuclear-encoded HGB. Immunoblots are displayed in supplemental Figure 3. Data are shown as mean ± standard deviation (SD) of 3 independent experiments. *P < .05, **P < .01, ***P < .001, and ****P < .0001 using the Bonferroni posttest after 1-way ANOVA. NS, not significant.
Cytoplasmic nucleoside kinase activity is elevated in AML
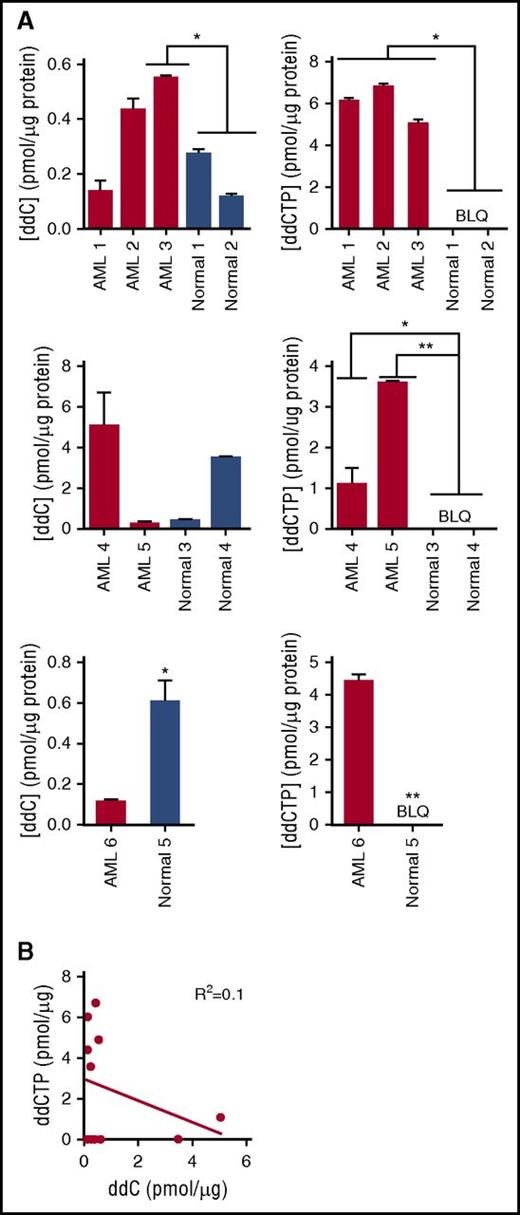
ddC mimics native nucleosides and undergoes activation to its triphosphorylated state 2′3′-dideoxycytidine triphosphate (ddCTP) in the cytoplasm. It is activated by nucleoside kinases DCK, CMPK1, and nucleoside diphosphate kinases (NME), which perform the first, second, and third phosphorylation steps, respectively.18,19 The activated form is imported into the mitochondria where it inhibits the catalytic activity of POLG through chain termination or competition with native nucleotides.20,21 To assess cytoplasmic nucleoside kinase activity, primary AML and normal hematopoietic progenitor cells (G-CSF–mobilized PBSCs) were treated with ddC and total levels of ddC and ddCTP were measured by liquid chromatography mass spectrometry (LC-MS/MS). Levels of ddC were increased in 1 of 6 AML cells compared with the mean levels in normal hematopoietic cells. ddCTP content was higher in 6 of 6 AML samples compared with mean levels in normal hematopoietic cells (P < .05, 1-way analysis of variance [ANOVA]), and ddCTP levels were below the limit of quantification in the normal hematopoietic cells (Figure 3A). Of note, in all samples, increased ddCTP levels were not solely related to higher levels of ddC as increased ddCTP was seen in samples with lower levels of ddC (Figure 3B); these results indicate that cytoplasmic nucleoside kinase pathway activity is upregulated in AML compared with normal PBSCs.
Cytoplasmic nucleoside kinase activity is elevated in AML. (A) Relative quantification of total intracellular ddC and ddCTP by LC-MS/MS in primary human AML (samples B1-B6) and normal hematopoietic progenitor samples following treatment with 2 µM ddC for 6 days. ddC and ddCTP content were normalized to total protein input and represented as mean ± SD (n = 2) of technical replicates within each independent experiment. Levels of ddC and ddCTP in each panel represent semiquantitative values. Each panel represents a separate experiment. Differences between ddC or ddCTP levels in each AML sample compared with mean of normal samples within an experiment was assessed using the Bonferroni posttest after 1-way ANOVA or the Student t test. *P < .05, ***P < .001. (B) Correlation between levels of ddC and ddCTP from samples in panel A was determined using the Pearson correlation method. BLQ, below the limit of quantification.
Cytoplasmic nucleoside kinase activity is elevated in AML. (A) Relative quantification of total intracellular ddC and ddCTP by LC-MS/MS in primary human AML (samples B1-B6) and normal hematopoietic progenitor samples following treatment with 2 µM ddC for 6 days. ddC and ddCTP content were normalized to total protein input and represented as mean ± SD (n = 2) of technical replicates within each independent experiment. Levels of ddC and ddCTP in each panel represent semiquantitative values. Each panel represents a separate experiment. Differences between ddC or ddCTP levels in each AML sample compared with mean of normal samples within an experiment was assessed using the Bonferroni posttest after 1-way ANOVA or the Student t test. *P < .05, ***P < .001. (B) Correlation between levels of ddC and ddCTP from samples in panel A was determined using the Pearson correlation method. BLQ, below the limit of quantification.
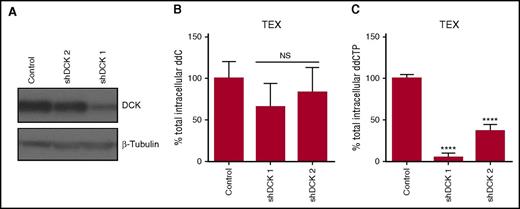
Confirming that ddC activation is regulated by cytoplasmic nucleoside kinases, knockdown of the nucleoside kinase DCK decreased levels of ddCTP, independent of changes in levels of ddC in TEX cells (Figure 4A-C). In contrast, knockdown of DCK in OCI-AML2 cells decreased levels of both ddC and ddCTP (supplemental Figure 4). Overall, these results demonstrate that the cytidine nucleoside kinase pathway activity is elevated in AML compared with normal hematopoietic cells.
DCK knockdown reduces levels of ddCTP. (A) DCK was knocked down in TEX cells using shRNA. Levels of DCK were measured in whole-cell lysates by immunoblotting 7 days posttransduction. A representative immunoblot is displayed. (B-C) Quantification of total intracellular ddC and ddCTP by LC-MS/MS in DCK knockdown or control shRNA TEX cells following treatment with 1 µM ddC for 4 days. ddC and ddCTP levels were normalized to 106 cells input. Data are shown as mean ± SD of 2 biological replicates performed at least in triplicate. NS, not significant.
DCK knockdown reduces levels of ddCTP. (A) DCK was knocked down in TEX cells using shRNA. Levels of DCK were measured in whole-cell lysates by immunoblotting 7 days posttransduction. A representative immunoblot is displayed. (B-C) Quantification of total intracellular ddC and ddCTP by LC-MS/MS in DCK knockdown or control shRNA TEX cells following treatment with 1 µM ddC for 4 days. ddC and ddCTP levels were normalized to 106 cells input. Data are shown as mean ± SD of 2 biological replicates performed at least in triplicate. NS, not significant.
ddC depletes mtDNA, inhibits oxidative phosphorylation, and induces preferential antileukemic effects
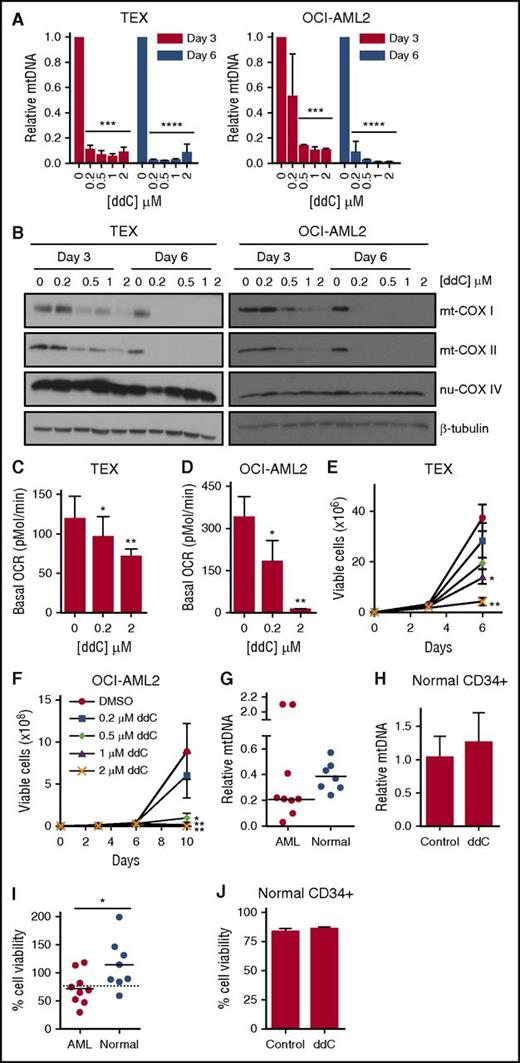
Previously, we and others demonstrated that AML cells and stem cells have increased reliance on oxidative phosphorylation due to decreased spare reserve capacity and an inability to upregulate glycolysis.1-3 ddCTP inhibits the sole mtDNA polymerase POLG, but not nuclear DNA polymerases. Given the increased activity of nucleoside kinases in AML cells over normal, we examined the effects of ddC treatment on mtDNA content and cellular bioenergetics. AML cell lines were treated with increasing concentrations of ddC that depleted mtDNA content in a panel of leukemia cell lines (n = 4) (Figure 5A; supplemental Figure 5A-B). In OCI-AML2 and TEX cell lines, we observed ∼90% mtDNA depletion following 3 days of treatment with 500 nM ddC. Subsequently, we evaluated the effect of ddC on mtDNA-encoded transcripts and proteins involved in mitochondrial bioenergetics. ddC treatment decreased mRNA expression of all 13 mtDNA-encoded genes which form subunits of electron transport chain (ETC) complexes. In contrast, no significant changes in mRNA expression of nuclear-encoded ETC complexes were observed in OCI-AML2 cells (supplemental Figure 5C; supplemental Table 2). Similarly, ddC treatment selectively depleted mtDNA-encoded COX I and COX II protein subunits, which form the catalytic core of ETC complex IV/cytochrome c oxidase in a dose- and time-dependent manner, with minor changes in the nuclear-encoded subunit COX IV (Figure 5B).22
ddC depletes mtDNA and its encoded proteins, inhibits oxidative phosphorylation, and induces preferential antileukemic effects. (A) TEX and OCI-AML2 cells were treated with ddC for 3 and 6 days. Relative mtDNA content was assessed by qRT-PCR as described in “Materials and methods.” Mean ± SD; n = 3. (B) Effect of ddC treatment on protein levels of mitochondrial COX I (mt-COX I), mt-COXII, nuclear COX IV (nu-COX IV), and β-tubulin in whole-cell extracts of TEX and OCI-AML2 cells. The immunoblot from a representative experiment is shown. (C-D) Basal OCR was assessed in TEX and OCI-AML2 cells following ddC treatment of 3 and 6 days, respectively, using the Seahorse XF96 Metabolic Flux Assay. Mean ± SD; n = 3. (E-F) Effect of ddC on cell viability and proliferation in TEX and OCI-AML2 cells. Cell viability was assessed by trypan blue exclusion staining. Mean ± SEM; n = 3. (G) Primary leukemia and normal hematopoietic progenitor cells (G-CSF–mobilized PBSCs) were treated with 2 µM ddC for 6 days. mtDNA content was assessed by qRT-PCR. Leukemia samples C1-C9 were used for analysis. (H) Normal PBSCs were treated with 2 µM ddC for 6 days and sorted for the CD34+ subpopulation using immunomagnetic selection. mtDNA content was assessed in CD34+ population by qRT-PCR. (I) Cell viability was assessed by trypan blue exclusion staining in primary AML cells and Cyquant DNA staining for PBSCs from panel G. Dotted line indicates the cutoff to stratify samples as ddC-sensitive or ddC-resistant. (J) Normal PBSCs were treated with 2 µM ddC for 6 days and cell viability was assessed by propidium iodide (PI) staining in CD34+ subpopulation by flow cytometry. For all experiments, *P < .05, **P < .01, ***P < .001, and ****P < .0001 using the Bonferroni posttest after 1-way ANOVA. The Student t test was applied to panels G-J. DMSO, dimethyl sulfoxide.
ddC depletes mtDNA and its encoded proteins, inhibits oxidative phosphorylation, and induces preferential antileukemic effects. (A) TEX and OCI-AML2 cells were treated with ddC for 3 and 6 days. Relative mtDNA content was assessed by qRT-PCR as described in “Materials and methods.” Mean ± SD; n = 3. (B) Effect of ddC treatment on protein levels of mitochondrial COX I (mt-COX I), mt-COXII, nuclear COX IV (nu-COX IV), and β-tubulin in whole-cell extracts of TEX and OCI-AML2 cells. The immunoblot from a representative experiment is shown. (C-D) Basal OCR was assessed in TEX and OCI-AML2 cells following ddC treatment of 3 and 6 days, respectively, using the Seahorse XF96 Metabolic Flux Assay. Mean ± SD; n = 3. (E-F) Effect of ddC on cell viability and proliferation in TEX and OCI-AML2 cells. Cell viability was assessed by trypan blue exclusion staining. Mean ± SEM; n = 3. (G) Primary leukemia and normal hematopoietic progenitor cells (G-CSF–mobilized PBSCs) were treated with 2 µM ddC for 6 days. mtDNA content was assessed by qRT-PCR. Leukemia samples C1-C9 were used for analysis. (H) Normal PBSCs were treated with 2 µM ddC for 6 days and sorted for the CD34+ subpopulation using immunomagnetic selection. mtDNA content was assessed in CD34+ population by qRT-PCR. (I) Cell viability was assessed by trypan blue exclusion staining in primary AML cells and Cyquant DNA staining for PBSCs from panel G. Dotted line indicates the cutoff to stratify samples as ddC-sensitive or ddC-resistant. (J) Normal PBSCs were treated with 2 µM ddC for 6 days and cell viability was assessed by propidium iodide (PI) staining in CD34+ subpopulation by flow cytometry. For all experiments, *P < .05, **P < .01, ***P < .001, and ****P < .0001 using the Bonferroni posttest after 1-way ANOVA. The Student t test was applied to panels G-J. DMSO, dimethyl sulfoxide.
We next assessed the effect on mitochondrial respiration by measuring the basal oxygen consumption rate (OCR). ddC treatment decreased basal OCR in a dose-dependent manner in OCI-AML2 cells and TEX cells (Figure 5C-D). Inhibition of oxidative phosphorylation paralleled decreases in mtDNA, but was not associated with decreased mitochondrial mass (supplemental Figure 6A). ddC treatment altered mitochondrial morphology in AML cells, such as decreased cristae density, abnormal concentric cristae formation, and enlarged mitochondria, consistent with previous reports of mitochondrial disorders associated with POLG mutations (supplemental Figure 6B).23,24 Reductions in mitochondrial function and oxidative phosphorylation were associated with decreased cell proliferation (Figure 5E-F) and cell death as observed by Annexin V+ staining in AML cells (supplemental Figure 7).
In contrast to leukemic cells, HEK 293 cells displayed decreased sensitivity to ddC; a 10-fold greater dose (5 µM) was required to observe significant reductions in cell proliferation and mtDNA (supplemental Figure 8A-B). We characterized the mechanism of resistance in HEK 293 by quantifying total intracellular levels of ddC and ddCTP. Despite 2 µM ddC treatment of 6 days, ddC and ddCTP were below the limit of quantification in HEK 293 cells compared with OCI-AML2 cells (supplemental Figure 8C-D). Thus, increased resistance to ddC in HEK 293 cells is likely due to decreased ddC import.
We next tested whether the effects of ddC on mitochondrial bioenergetics was functionally important for the observed cell death in leukemia. We observed that mtDNA-deficient P16669 Rho(0) cells, which display an oxidative-phosphorylation defective phenotype, were resistant to ddC treatment while the parental wild type P143B cells were sensitive to ddC (supplemental Figure 8E). Taken together, these data show that ddC preferentially inhibits AML cell viability and proliferation by targeting the mtDNA replication activity of POLG.
Given the effects in AML cell lines, we investigated the effect of ddC on primary leukemia cells and normal hematopoietic progenitors (see supplemental Table 1 for patient characteristics). ddC depleted mtDNA content in 7 of 9 primary leukemia samples, whereas a smaller reduction in mtDNA content was observed in all tested hematopoietic progenitors (n = 7) (Figure 5G; supplemental Table 3) including the CD34+ fraction (Figure 5H). We also assessed the effect of ddC on the viability of primary AML and normal hematopoietic cells. Six of 9 primary leukemia samples were sensitive to ddC treatment in vitro as empirically defined as a cell viability <75% following 6 days of treatment with 2 µM ddC compared with controls. In contrast, 7 of 8 samples of normal hematopoietic cells were resistant to ddC treatment in vitro (Figure 5I). Normal CD34+ hematopoietic cells were also resistant to ddC (Figure 5J). Preferential antileukemic activity was associated with greater reductions in mtDNA content as sensitive leukemia samples displayed on average, a twofold lower mtDNA content after ddC treatment compared with normal hematopoietic cells (supplemental Table 3). Thus, ddC preferentially inhibits mtDNA biosynthesis in AML cells and selectively targets a subset of AML cells in vitro.
ddC displays efficacy in mouse models of human AML
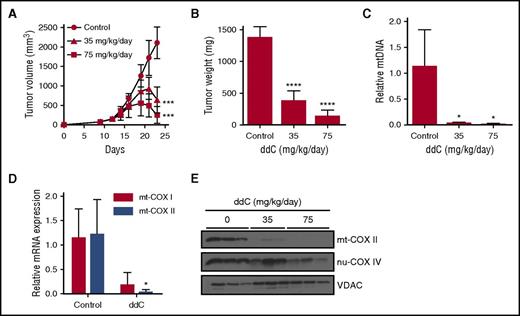
We next investigated whether inhibiting mtDNA biosynthesis with ddC can target AML cells in vivo. In the xenograft tumor model, OCI-AML2 cells were injected subcutaneously into the flank of severe combined immune-deficient (SCID) mice. After tumors were palpable, mice were treated with ddC once daily i.p. injection for 11 days. Treatment with low doses of ddC (35 and 75 mg/kg) induced tumor regression and decreased tumor mass by >75% relative to vehicle controls (Figure 6A-B, P < .0001, Bonferroni posttest after 1-way ANOVA). Higher doses of ddC (150 and 300 mg/kg) produced tumor regression and reductions in tumor mass by >90% compared with vehicle controls (supplemental Figure 9A, P < .0001, Bonferroni posttest after 1-way ANOVA). Similar to the in vitro results, we observed >90% mtDNA depletion in OCI-AML2 tumors excised at the end of treatment at all doses of ddC (Figure 6C; supplemental Figure 9B). Consequently, we observed reductions in mitochondrial COX I and COX II mRNA (Figure 6D) and in COX II protein levels in OCI-AML2 xenografts (Figure 6E). We evaluated the toxicity of ddC in the SCID-mouse model at doses which produced antileukemic effects in vivo. Treatment with ddC did not affect mouse body weight or behavior, activities of liver and enzymes in serum and histology of organs known to have high mitochondrial mass (supplemental Figure 9C-E).25 Importantly, ddC did not affect normal mouse hematopoiesis as no significant decrease in mouse leukocyte counts was observed (supplemental Figure 9F). Thus, ddC may be clinically effective in a subset of AML as a novel therapeutic agent.
ddC displays efficacy in mouse models of human AML. (A-B) OCI-AML2 cells were injected subcutaneously into the flank of SCID mice. Mice were treated with ddC (35 or 75 mg/kg per day by i.p. injection) or vehicle control for 11 days (n = 8 per group). Tumor volume (A) and weight (B) were assessed from excised tumors. Mean ± SD. (C) Relative mtDNA was assessed from xenograft tumors excised from ddC or vehicle-treated mice in panel A by qRT-PCR. Mean ± SD; n = 3 per group. (D) Relative mRNA expression for mt-COX I and mt-COX II was assessed by qRT-PCR in tumors excised from mice treated with 300 mg/kg per day of ddC or vehicle control for 11 days. Mean ± SD; n = 3 per group. (E) Protein levels of mt-COX II, nu-COX IV, and VDAC from whole-cell extracts of tumors from panel A were assessed by immunoblotting. For all experiments, *P < .05, ***P < .001, ****P < .0001 using the Bonferroni posttest after 1-way ANOVA in panels A-C, and the Student t test in panel D.
ddC displays efficacy in mouse models of human AML. (A-B) OCI-AML2 cells were injected subcutaneously into the flank of SCID mice. Mice were treated with ddC (35 or 75 mg/kg per day by i.p. injection) or vehicle control for 11 days (n = 8 per group). Tumor volume (A) and weight (B) were assessed from excised tumors. Mean ± SD. (C) Relative mtDNA was assessed from xenograft tumors excised from ddC or vehicle-treated mice in panel A by qRT-PCR. Mean ± SD; n = 3 per group. (D) Relative mRNA expression for mt-COX I and mt-COX II was assessed by qRT-PCR in tumors excised from mice treated with 300 mg/kg per day of ddC or vehicle control for 11 days. Mean ± SD; n = 3 per group. (E) Protein levels of mt-COX II, nu-COX IV, and VDAC from whole-cell extracts of tumors from panel A were assessed by immunoblotting. For all experiments, *P < .05, ***P < .001, ****P < .0001 using the Bonferroni posttest after 1-way ANOVA in panels A-C, and the Student t test in panel D.
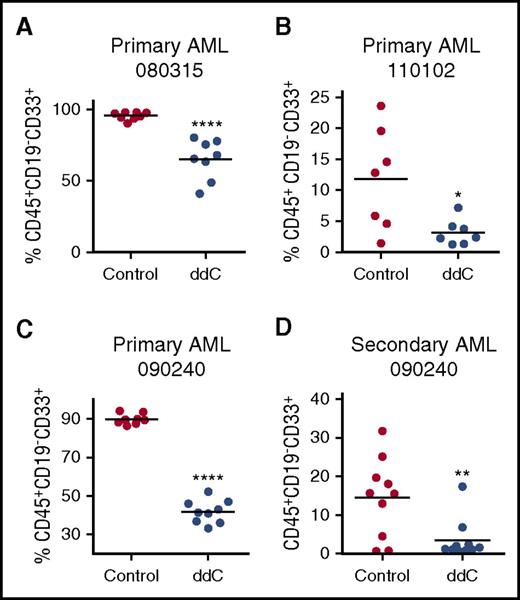
We also assessed whether ddC can target primary AML cells in vivo.26 Primary cells from 3 patients diagnosed with AML were injected intrafemorally into NOD-SCID mice (see supplemental Table 1 for patient characteristics). Eleven days after injection, mice were treated for 5 of 7 days for 3 weeks at 75 mg/kg ddC by i.p. injection once daily. ddC treatment decreased levels of primary engraftment in the bone marrow, as assessed by quantification of human CD45+CD19−CD33+ cells (n = 3, ****P < .0001 and *P < .05, Student t test) (Figure 7A-C). Next, we determined whether ddC targets the leukemic stem cell (LSC) fraction by evaluating secondary engraftment. Primary AML cells harvested from the bone marrow of ddC-treatment mice were engrafted in untreated secondary recipient mice, and human leukemic cell engraftment was assessed after 5 weeks. ddC significantly reduced AML secondary engraftment (P < .01, Student t test) (Figure 7D). Overall, ddC targets bulk AML and LSCs and inhibits mtDNA replication and ETC function in vivo.
ddC targets bulk and LSCs in vivo. (A-C) Three primary human AML cell samples were injected intrafemorally into irradiated female NOD/SCID mice. Mice were treated with 75 mg/kg per day of ddC by i.p. injection or vehicle control on day 11 for 3 weeks (n = 7 per group). Following treatment, human leukemia cell engraftment in the left femur was assessed by flow cytometry of human CD45+CD33+CD19− cells. (D) Secondary engraftment was assessed by injecting viable leukemia cells from the bone marrow of ddC-treated and vehicle mice and injected into the right femur of irradiated female NOD/SCID mice, which remained untreated. Five weeks later, human leukemia cell engraftment in the left femur was measured by flow cytometry of human CD45+CD33+CD19− cells. Line represents mean engraftment of human cells. For all experiments, *P < .05, **P < .01, ****P < .0001 using the Student t test.
ddC targets bulk and LSCs in vivo. (A-C) Three primary human AML cell samples were injected intrafemorally into irradiated female NOD/SCID mice. Mice were treated with 75 mg/kg per day of ddC by i.p. injection or vehicle control on day 11 for 3 weeks (n = 7 per group). Following treatment, human leukemia cell engraftment in the left femur was assessed by flow cytometry of human CD45+CD33+CD19− cells. (D) Secondary engraftment was assessed by injecting viable leukemia cells from the bone marrow of ddC-treated and vehicle mice and injected into the right femur of irradiated female NOD/SCID mice, which remained untreated. Five weeks later, human leukemia cell engraftment in the left femur was measured by flow cytometry of human CD45+CD33+CD19− cells. Line represents mean engraftment of human cells. For all experiments, *P < .05, **P < .01, ****P < .0001 using the Student t test.
Discussion
In our current study, gene expression analysis demonstrated an increase in mtDNA biogenesis genes in a subset of primary human AML samples compared with normal hematopoietic samples. These results are consistent with previous reports of upregulated mtDNA levels in a subset of primary AML cells.2,27 Given that increased mitochondrial nucleotide metabolism is associated with larger nucleotide pools, we hypothesized that this need is supported by import of cytoplasmic nucleotide pools in AML. Confirming this, we detected significant mRNA upregulation of mitochondrial nucleotide transporters, which transport nucleotides and macromolecules from the cytoplasm into the mitochondria. Additionally, upregulation of a subset of cytoplasmic nucleoside kinases, involved in the biosynthesis of cytoplasmic nucleotide pools, was observed in AML at both the mRNA and protein level. Demonstrating a functional link between cytoplasmic and mitochondrial nucleotide pools, we also showed that knockdown of nucleoside kinases depleted mitochondrial DNA content. Our study is the first to report the contribution of cytoplasmic nucleoside kinases to mtDNA levels in human cells. These findings are in line with a recent study in Drosophila, which demonstrated that overexpression of cytoplasmic deoxynucleoside kinase increased mtDNA content and oxidative metabolism proteins.28 Through these experiments, we highlighted the contribution of cytoplasmic nucleotide metabolism, in particular, the nucleotide salvage pathway to support mitochondrial nucleotide metabolism.
During nucleotide biosynthesis, nucleoside precursors undergo sequential phosphorylation to form deoxynucleotide triphosphates through catalysis by nucleoside kinases. To assess the activity of nucleoside kinases in AML, we tested the conversion of ddC to its activated triphosphorylated form, ddCTP. We demonstrated increased cytoplasmic nucleoside kinase activity in AML by detecting increased levels of conversion of ddC to ddCTP in AML cells. Because ddC acts as an antimetabolite that is minimally incorporated into nuclear DNA once triphosphorylated, levels of ddCTP are readily quantifiable by mass spectrometric approaches.7 In contrast, using an endogenous nucleoside to assess levels of nucleoside kinase activity is challenging due to constant turnover of nucleotide pools during genomic replication and degradation to nucleoside precursors such as nucleosides and nucleoside monophosphates and diphosphates.29 However, the binding affinities of nucleotide salvage enzymes differ between substrates, such as native nucleosides and nucleoside analogs, hence rates of nucleotide biosynthesis cannot be extrapolated from this study.19
Having demonstrated increased cytoplasmic nucleoside kinase activity in AML, we then leveraged this vulnerability to preferentially activate the POLG inhibitor, ddC, in AML cells. mtDNA depletion with ddC inhibits ETC function and targets both bulk AML and LSC populations in mouse models of human leukemia without overt toxicity to normal cells. Our findings reflect a dependence on oxidative phosphorylation to support LSC survival and tumor growth. In addition, these results support our previous findings that AML cells have decreased spare reserve capacity and increased sensitivity to strategies that target oxidative phosphorylation.3 Moreover, ATP depletion may further impair mtDNA replication through inadequate ATP-dependent topoisomerase II activity and resultant formation of mtDNA catenanes.30 Contrary to nuclear DNA, mtDNA replication occurs independent of cell cycle status,25 hence it is active in quiescent cells and can be therapeutically targeted by the nucleoside analog ddC.
Selectively targeting mtDNA polymerase activity is a characteristic feature of antiviral nucleoside analogs. The most potent inhibitor of this class reported is ddC,31 with increased sensitivity of ∼100-fold to 1000-fold greater for POLG over nuclear DNA polymerases, as determined by in vitro enzymatic primer extension assays.32 In contrast, chemotherapeutic nucleoside analogs used in AML such as cytarabine (AraC), clofarabine, and cladribine target nuclear DNA polymerases and are less active against POLG. For example, AraC has 50-fold less affinity for POLG compared with nuclear POLA, whereas, clofarabine and cladribine are 54-fold and ninefold less potent, respectively.33,34
Six percent to 34% of patients treated with ddC as an anti-HIV treatment regimen experienced grade 3 or higher mitochondrial toxicities similar to those observed in patients with POLG-associated mitochondrial disorders, such as reversible peripheral neuropathy and lactic acidosis, although lactic acidosis was very rare, occurring in 1 in 10 000 patients.21,35-39 In contrast, treatment with current nonnucleoside antiviral agents such as indinavir and nevirapine, which do not inhibit POLG, do not display POLG-related mitochondrial toxicities.40,41 The mitochondrial toxicities seen with ddC suggest that antileukemic effects could be observed at clinically achievable concentrations.
In summary, our study demonstrates that a subset of AML cells has elevated cytidine nucleoside kinase pathway activity and supports mitochondrial nucleotide metabolism. We leveraged this unique biological vulnerability to preferentially target mitochondrial bioenergetics in AML using ddC. ddC was preferentially converted from its pro to active form where it depleted mtDNA, inhibited oxidative phosphorylation, and selectively targeted AML cells and stem cells in vitro and in vivo.
The online version of this article contains a data supplement.
The publication costs of this article were defrayed in part by page charge payment. Therefore, and solely to indicate this fact, this article is hereby marked “advertisement” in accordance with 18 USC section 1734.
Acknowledgments
The authors thank Jill Flewelling (Princess Margaret Cancer Center) for administrative assistance.
This work was supported by the Leukemia & Lymphoma Society, the Canadian Institutes of Health Research, the Princess Margaret Cancer Centre Foundation, and the Ministry of Long Term Health and Planning in the Province of Ontario. A.D.S. holds the Barbara Baker Chair in Leukemia and Related Diseases. ddC and ddCTP measurements were carried out at the Goodman Cancer Research Center metabolomics facility supported by Terry Fox Research Institute (#1048 in partnership with Fondation du Cancer du Sein du Quebec), the Fraser Fund, and McGill University.
Authorship
Contribution: S.U.L., R.H., X.W., G.B., N.M., T.P.S., S.S., M.G., and D.Y. conducted the experiments; M.D.M. provided patient’s samples and clinical information; A.S.-D. assisted in manuscript preparation; V.V. and C.X. performed gene expression profiling analysis under the guidance of G.D.B.; D.A. and R.L. provided support with experimental design and data analysis; S.U.L. and A.D.S. conceived the project, designed the experiments, and wrote the manuscript; and all authors reviewed and edited the paper.
Conflict-of-interest disclosure: The authors declare no competing financial interests.
Correspondence: Aaron D. Schimmer, Princess Margaret Cancer Centre, Room 7-417, 610 University Ave, Toronto, ON M5G 2M9, Canada; e-mail: aaron.schimmer@utoronto.ca.

This feature is available to Subscribers Only
Sign In or Create an Account Close Modal