

Key Points
Higher dose of invariant NKT cells within PBSC allograft is associated with an improved GPFS.
Abstract
We studied the impact of a set of immune cells contained within granulocyte colony-stimulating factor–mobilized peripheral blood stem cell grafts (naïve and memory T-cell subsets, B cells, regulatory T cells, invariant natural killer T cells [iNKTs], NK cells, and dendritic cell subsets) in patients (n = 80) undergoing allogeneic stem cell transplantation (SCT), using the composite end point of graft-versus-host disease (GVHD)-free and progression-free survival (GPFS) as the primary end point. We observed that GPFS incidences in patients receiving iNKT doses above and below the median were 49% vs 22%, respectively (P = .007). In multivariate analysis, the iNKT dose was the only parameter with a significant impact on GPFS (hazard ratio = 0.48; 95% confidence interval, 0.27-0.85; P = .01). The incidences of severe grade III to IV acute GVHD and National Institutes of Health grade 2 to 3 chronic GVHD (12% and 16%, respectively) were low and associated with the use of antithymocyte globulin in 91% of patients. No difference in GVHD incidence was reported according to the iNKT dose. In conclusion, a higher dose of iNKTs within the graft is associated with an improved GPFS. These data may pave the way for prospective and active interventions aiming to manipulate the graft content to improve allo-SCT outcome.
Introduction
Allogeneic stem cell transplantation (allo-SCT) is a well-established therapy for a wide range of life-threatening hematologic malignancies. The therapeutic efficacy of allo-SCT relies mostly on the immune-mediated graft-versus-tumor (GVT) activity of the graft. However, the beneficial effect of GVT is counterbalanced by the destruction of the recipient tissues by the donor immune effectors, termed graft-versus-host disease (GVHD). Despite significant improvements in the outcome of allo-SCT,1,2 relapse and GVHD remain major sources of morbidity and mortality after the procedure.1,3 Therefore, deciphering the immune mechanisms underlying GVT and GVHD seems indispensable to improve patients’ outcome. Although granulocyte colony-stimulating factor (G-CSF)–mobilized peripheral blood mononuclear cells (PBSCs) have largely replaced bone marrow as a stem cell source, thus far the only validated parameters to evaluate G-CSF–mobilized PBSC graft quality are CD34+ stem cell and CD3+ T-cell doses.4 Little is known on the effects of the graft immune cell subpopulation on the graft alloreactivity and on GVT and GVHD. Recently, Reshef et al analyzed CD4+ and CD8+ T cells in PBSC grafts and reported that use of PBSC graft with higher numbers of CD8+ T cells was associated with an improved outcome.5 Chaidos et al focused on invariant natural killer T cells (iNKTs),6 a regulatory cell population implicated in immune tolerance and tumor surveillance.7,8 They reported that the use of PBSC graft with fewer CD4− iNKTs was associated with an increased risk of acute GVHD (aGVHD).6 Similarly, Rezvani et al evaluated regulatory T cells (Tregs) within the PBSC graft9 and reported that patients who received allo-SCT with a PBSC graft that contained lower absolute number of Tregs were associated with a greater risk of developing aGVHD. Overall, these studies were restricted to a specific immune cell population, CD4+ and CD8+ T cells,5 iNKTs,6 or Tregs.9 The only report on a large collection of immune subsets failed to demonstrate an association between donor immune cells in the PBSC graft and the SCT outcome,10 whereas bone marrow grafts with more naïve T cells and plasmacytoid dendritic cells were associated with an improved survival.10
Furthermore, in these studies, improved outcome associated with graft cell subsets was linked to either a decreased incidence of relapse5 or a decreased incidence of GVHD.6 However, although 1 graft cell subset can contribute to reduce GVHD, it may also reduce GVT and therefore increase the relapse risk. Similarly, a graft cell subset associated with an increased GVT effect and a decreased risk of relapse may also lead to a higher risk of GVHD, increasing morbidity after allo-SCT. Therefore, use of an end point taking into account both relapse and GVHD in addition to death seems to be more appropriate to identify graft cell subsets associated with a global improved outcome of the transplant. The novel composite end point of GVHD-free progression-free survival (GPFS), defined as a combination of survival with no evidence of relapse/progression, grade III to IV aGVHD, and systemic therapy–requiring chronic GVHD (cGVHD),11 appears to be a very suitable for this purpose.
Thus, the aim of our study was to examine the impact of a comprehensive set of immune cells (naïve and memory T cells, B cells, regulatory T cells, iNKTs, NK cells and dendritic cell [DC] subsets) contained within the PBSC grafts on the outcome of allo-SCT, using overall survival (OS) and the composite end point of GPFS as the primary end point.
Patients and methods
Patient and donor characteristics
We retrospectively included 80 consecutive patients who underwent allo-SCT using G-CSF–mobilized PBSCs at the University Hospital of Nantes (Nantes, France) between 2010 and 2013, and for whom frozen aliquots of the PBSC grafts were available. Written informed consent was obtained from each patient and donor. The study was approved by the local institutional review board. All donor/recipient pairs were matched at HLA-A, -B, -C, -DRB1, and -DQB1 at the allele level, although a single antigenic or allelic mismatch was allowed. Supportive care and antimicrobial prophylaxis were the same during the whole study period.12
Mobilization and collection of donor PBSCs
Donors received a 5-day course of 10 μg/kg per day subcutaneous G-CSF, and mobilized PBSCs were collected from day 5 until a CD34+ cell dose of ≥4 × 10⁶/kg recipient body weight was collected.
Graft analysis
CD34+ cell and CD3+ T-cell enumeration was prospectively determined on freshly harvested PBSC products by flow cytometry on FC500 (Beckman Coulter) and analyzed by CXP Cytometer software. CD34+ cell enumeration was performed according to the International Society of Hematotherapy and Graft Engineering guidelines.13 Total nucleated cell counting was performed using an ABX Pentra 80 Horiba.
The phenotype of T, B, and NK cells and DCs, was determined on frozen aliquots of the PBSC grafts. PBSCs were first stained with eFluor506 Fixable Viability Dye (eBioscience, Paris, France) according to the manufacturer’s instructions, and subsequently marked with antibody panels described on supplemental Table 1, available on the Blood Web site. For intranuclear staining, cells were fixed and permeabilized after surface staining with the Transcription Factor Staining Buffer Set (eBioscience) and stained with the relevant antibodies. Analysis was performed on a FACSCanto II (BD Biosciences, Le Pont de Claix, France) and Kaluza 1.3 software (Beckman Coulter). Infused cell doses of lymphocytes were calculated on the basis of the CD3+ T-cells doses infused to the patient. Subsets of DCs and lymphocytes are listed on supplemental Table 1.
Clinical outcomes
The primary end points were OS and GPFS. Secondary end points were PFS, relapse incidence, nonrelapse mortality (NRM), aGVHD, and cGVHD.
Recorded clinical outcomes after transplantation included time to neutrophil and platelet engraftment, time of onset and severity of aGVHD and cGVHD, disease relapse or progression, PFS, and OS. OS was defined as the time from allo-SCT to death, regardless of the cause. GPFS was defined as survival with no evidence of relapse/progression, grade III to IV aGVHD, and systemic therapy–requiring cGVHD.11 PFS was defined as survival with no evidence of relapse or progression. Patients were censored at the time of last contact or second transplant or of donor lymphocyte infusion for all outcomes. Time to neutrophil recovery was defined as the first of 3 consecutive days in which the absolute neutrophil count exceeded 0.5 × 10⁹/L, and to platelet recovery as the first of 3 days with 50 × 109/L or higher without a need for platelet transfusion during a 5-day period. aGVHD and cGVHD were diagnosed according to the National Institutes of Health (NIH) classification,14 and the modified Glucksberg classification was used for aGVHD grading.15
Statistical analysis
Correlations between graft cell subsets were evaluated using Pearson and Spearman correlation, and 31 cell subsets were selected for analysis based on prior interest and on the absence of a strong correlation with one another (Pearson or Spearman correlation >0.8). For graft cell subsets of interest, subgroups were defined based on the values above or below the median. OS and GPFS were calculated by the Kaplan-Meier method, and subgroups were compared using the log-rank test. P values were not adjusted for multiple comparisons, but we used the false discovery rate criterion (q), and only covariates for which the q value was <0.20 were selected for further investigation. Finally, for selected graft cell subsets, the GPFS was calculated using the Kaplan-Meier method, and subgroups were compared using the log-rank test. Probabilities of relapse, NRM, GVHD, and neutrophil and platelet recovery were calculated using the cumulative incidence procedure, and comparisons were performed using the Gray test.
In addition to the graft cell subsets, variables considered for their prognostic value on outcome were as follows: patient’s age at transplantation (>60 or <60 years), patient and donor sex, cytomegalovirus (CMV) status, diagnosis (myeloid malignancies vs lymphoid malignancies), disease risk index (low-intermediate vs high-very high risk), donor type, regimen intensity (myeloablative conditioning regimen [MAC] vs reduced intensity conditioning regimen [RIC]), GVHD prophylaxis (cyclosporine A [CsA] alone vs CsA in combination with mycophenolate mofetil or methotrexate), and use of antithymocyte globulin (ATG). To study the association between selected graft cell subset types and outcomes, multivariate Cox regressions models were built. All factors found to influence outcomes in univariate analysis with P < .20 (<.30 for grade III-IV aGVHD) were included in a Cox proportional hazard model. Graft cell subsets selected as the main study question were retained in all steps of model building. Statistical analyses were performed with EZR version 1.27 (Saitama Medical Center, Jichi Medical University), which is a graphical user interface for R (The R Foundation for Statistical Computing; version 3.1.1).16
Results
Patients, donors, and transplant characteristics
Patient and transplant characteristics are detailed in Table 1. The median age at transplant was 57 years (range, 8-70 years), and 31 patients (39%) were >60 years of age at the time of transplant. Forty-six patients (57%) received an allo-SCT for a myeloid malignancy and 34 (43%) for a lymphoid malignancy. Sixty-three patients (79%) had a low or intermediate risk disease and 17 patients (21%) had a high or very-high-risk disease.17 allo-SCT was performed from either an HLA-matched related donor (MRD; n = 28; 35%) or an unrelated donor, including 40 fully matched (MUD; 50%) and 12 with 1 mismatch (MisMUD; 15%). Fifteen patients (19%) received a MAC, and 65 patients (81%) a RIC. The choice of the conditioning was dependent on patient age, previous treatment, and comorbidities.1 The majority of patients (n = 73; 91%) received in vivo T-cell depletion using ATG (thymoglobulin; Genzyme, Lyon, France), 5 mg/kg total dose. GVHD prophylaxis depended on the donor type and the conditioning regimen.1 Patients received either CsA alone (n = 27; 34%) or in combination with mycophenolate mofetil (n = 47; 59%) or methotrexate (n = 6; 7%).
Study population and transplant characteristics
| Characteristic | Value |
|---|---|
| Sample size, no. | 80 |
| Patient age, median (range) | 56.9 (7.6-70.5) |
| Donor age, median (range) | 42.8 (19.3-66.4) |
| Patients aged >60 years | 31 (39%) |
| Patient sex (male) | 52 (65%) |
| Donor sex (male) | 43 (54%) |
| Female donor to male patients | 21 (26%) |
| CMV seronegative donor-recipient pair | 37 (46%) |
| Diagnosis | |
| Myeloid malignancies | 46 (57%) |
| Acute myeloid leukemia | 33 (41%) |
| Myelodysplastic syndrome | 8 (10%) |
| Myeloproliferative neoplasm | 4 (5%) |
| BPDCN | 1 (1%) |
| Lymphoid malignancies | 34 (43%) |
| Acute lymphoblastic leukemia | 8 (10%) |
| Non-Hodgkin lymphoma | 17 (21%) |
| Hodgkin disease | 3 (4%) |
| Chronic lymphocytic leukemia | 3 (4%) |
| Multiple myeloma | 3 (4%) |
| Disease risk index | |
| Low | 10 (13%) |
| Intermediate | 53 (66%) |
| High | 13 (16%) |
| Very high | 4 (5%) |
| Previous transplant | |
| ASCT | 15 (19%) |
| allo-SCT | 1 (1%) |
| Donor type | |
| HLA-matched relative | 28 (35%) |
| HLA-matched unrelated donor | 40 (50%) |
| HLA-mismatched unrelated donor | 12 (15%) |
| Conditioning regimen | |
| MAC | 15 (19%) |
| Flu-Bu | 12 (15%) |
| Bu-Cy | 1 (1%) |
| Cy-TBI | 2 (3%) |
| RIC | 65 (81%) |
| Flu-Bu | 48 (60%) |
| Flu-TBI | 1 (1%) |
| Clo-Bu | 12 (15%) |
| Clo-TBI | 1 (1%) |
| Flu–Mel | 3 (4%) |
| TBI based regimen | |
| Yes | 4 (5%) |
| No | 76 (95%) |
| ATG | |
| Yes | 73 (91%) |
| No | 7 (9%) |
| GVHD prophylaxis | |
| CsA + MMF | 47 (59%) |
| CsA + MTX | 6 (7%) |
| CsA | 27 (34%) |
| Median follow-up, months (range) | 36.6 (12.5-60.1) |
ASCT, autologous stem cell transplantation; BPDCN, blastic plasmacytoid dendritic cell neoplasm; Bu, busulfan; Clo, Clofarabine; Cy, cyclophosphamide; Flu, fludarabine; Mel, melphalan; MMF, mycophenolate mofetil; MTX, methotrexate; TBI, total body irradiation.
Graft characteristics
The median number of CD34+ cells, total nucleated cells, and total CD3+ T cells were 7.0 × 10⁶/kg (range, 2.1-10.0 × 10⁷/kg), 10.3 × 10⁸/kg (range, 2.9-23.7 × 10⁷/kg), and 20.7 × 10⁷/kg (range, 5.1-58.0 × 10⁷/kg), respectively. The median number of iNKTs was 0.11 × 10⁶/kg (range, 0-1.55 × 10⁷/kg), and their distribution was log-normal. There was no correlation between the number of iNKTs within the graft and the donor age (Pearson r, −0.01; P = .92). There was no difference in the number of iNKTs within the graft between MRD and unrelated donors (P = .36) or between female and male donors (P = .13). Median number, minimum, maximum, and first and third quartiles of other transplanted cells are listed in supplemental Table 2.
Recipients of higher numbers of iNKTs had an improved GPFS
With a median follow-up of 37 months (range, 12-60 months) among surviving patients, the 2-year OS was 58% (95% confidence interval [CI], 46-68%) and the 2-year GPFS was 35% (95% CI, 25-46%; supplemental Table 3). The 2-year OS was significantly better in patients <60 years (69% vs 40% in patients >60 years, P = .02) and in those with a MRD (70% vs 51% for unrelated donors, P = .03), whereas there was no significant difference between patients with low or intermediate risk disease and patients with high or very-high-risk disease (61% vs 45%, respectively, P = .16; Table 2). Of note, OS and GPFS were not significantly different among unrelated donors between matched and mismatched donors (49% vs 57%; P = .31 and 29% vs 42%; P = .49, respectively).
Transplant-related events univariate analysis
| Outcome | OS | GPFS | NRM | Relapse incidence | Grade III-IV aGVHD | NIH grade 2-3 cGVHD |
|---|---|---|---|---|---|---|
| Patient age | ||||||
| <60 years | 69.2 (54.2-80.2) | 42.3 (28.3-55.6) | 16.5 (7.6-28.2) | 27.1 (15.3-40.3) | 14.3 (6.2-25.6) | 16.3 (7.5-28.1) |
| >60 years | 39.7 (19.0-54.6) | 23.5 (9.4-40.4) | 23.9 (10.0-41.0) | 39.8 (22.1-57.0) | 9.7 (2.4-23.2) | 16.1 (5.7-31.4) |
| P | .02 | .27 | .57 | .26 | .54 | .99 |
| CMV | ||||||
| Donor/recipient negative | 63.0 (44.6-76.7) | 36.6 (21.2-52.1) | 19.5 (8.4-34.0) | 25.2 (12.2-40.5) | 16.2 (6.5-29.9) | 16.2 (6.4-29.9) |
| Others | 52.7 (36.7-56.5) | 23.3 (20.6-48.5) | 18.6 (8.6-31.6) | 37.8 (23.3-52.4) | 9.3 (2.9-20.3) | 16.3 (7.0-28.9) |
| P | .53 | .63 | .75 | .10 | .34 | .99 |
| Sex | ||||||
| Female to male 1 | 52.4 (29.7-70.9) | 33.3 (14.9-53.1) | 23.8 (8.2-43.8) | 38.1 (17.6-58.5) | 4.8 (0.3-20.3) | 14.3 (3.3-33.1) |
| Other 0 | 59.6 (45.6-71.1) | 36.2 (24.0-48.6) | 17.2 (8.8-28.1) | 29.8 (18.4-42.1) | 15.3 (7.4-25.6) | 17.0 (8.7-27.8) |
| P | .51 | .37 | .55 | .57 | .23 | .75 |
| Disease risk index | ||||||
| Low-intermediate | 60.9 (47.4-71.0) | 35.8 (24.1-47.7) | 20.8 (11.7-31.7) | 27.7 (17.1-39.4) | 14.3 (7.0-24.1) | 20.7 (11.6-31.6) |
| High-very high | 45.4 (20.9-67.1) | 35.3 (14.5-57.0) | 11.8 (1.8-32.0) | 47.1 (21.9-68.8) | 5.9 (0.3-24.7) | 0 |
| P | .16 | .54 | .47 | .08 | .34 | .05 |
| Diagnosis | ||||||
| Lymphoid | 57.7 (39.1-72.5) | 34.4 (19.0-50.4) | 24.0 (11.0-39.6) | 27.7 (13.5-44.0) | 14.7 (5.3-28.7) | 20.8 (8.9-36.0) |
| Myeloid | 57.5 (41.6-70.5) | 36.1 (22.4-50.0) | 15.2 (6.6-27.1) | 35.4 (21.7-49.4) | 10.9 (3.9-21.8) | 13.0 (5.2-24.6) |
| P | .66 | .88 | .54 | .35 | .65 | .34 |
| Donor | ||||||
| MRD | 70.2 (48.8-83.9) | 41.3 (22.8-59.0) | 7.3 (1.2-21.2) | 33.4 (16.3-51.5) | 7.1 (12-207) | 17.9 (6.2-34.3) |
| UD | 50.7 (36.2-63.6) | 31.9 (19.7-44.8) | 25.2 (14.3-37.8) | 31.4 (19.1-44.5) | 15.4 (71-265) | 15.4 (7.1-26.6) |
| P | .028 | .18 | .04 | .97 | .28 | .85 |
| Conditioning regimen | ||||||
| MAC | 53.3 (26.3-74.4) | 38.9 (15.3-62.2) | 34.7 (23.1-46.5) | 21.0 (4.5-45.5) | 13.3 (2.0-35.5) | 13.3 (2.0-35.6) |
| RIC | 58.6 (45.2-69.7) | 34.5 (23.1-46.2) | 15.7 (8.0-25.7) | 33.3 (11.3-57.4) | 12.3 (5.7-21.6) | 17.0 (9.0-27.2) |
| P | .61 | .61 | .19 | .39 | .89 | .80 |
| ATG | ||||||
| Yes | 57.5 (44.9-68.1) | 37.6 (26.4-48.7) | 19. (11.2-29.4) | 27.9 (18.0-38.6) | 13.7 (7.0-22.7) | 13.7 (7.0-22.8) |
| No | 57.1 (17.2-83.7) | 14.3 (7.1-46.5) | 14.3 (0.5-49.1) | 71.4 (15.5-94.1) | 0 | 42.9 (6.5-76.9) |
| P | .61 | .19 | .73 | .01 | .30 | .045 |
| GVHD prophylaxis | ||||||
| CSA | 68.5 (46.4-83.0) | 38.8 (20.4-56.9) | 11.3 (2.7-26.7) | 30.8 (14.1-49.2) | 11.1 (2.7-26.3) | 11.1 (2.6-26.5) |
| CSA + MMF or MTX | 52.0 (37.7-64.6) | 33.2 (20.9-46.1) | 22.9 (12.5-35.1) | 33.0 (20.5-46.1) | 13.2 (5.7-23.8) | 18.9 (9.6-30.5) |
| P | .10 | .34 | .16 | .64 | .75 | .37 |
| iNKTs | ||||||
| <0.11 × 10⁶/kg | 54.7 (38.1-68.6) | 21.7 (10.4-35.7) | 20.2 (9.3-34.1) | 40.6 (25.0-55.6) | 15.0 (6.0-27.9) | 20.0 (9.2-33.7) |
| >0.11 × 10⁶/kg | 59.6 (41.7-73.6) | 49.4 (33.1-63.8) | 18.1 (7.8-31.9) | 22.6 (11.1-36.6) | 10.0 (3.1-21.7) | 12.6 (4.5-25.2) |
| P | .51 | .007 | .97 | .12 | .49 | .32 |
Bold denotes statistically significance.
Based on the values above or below the median, there was no significant association between any cell subsets and OS, whereas iNKTs were the only cell subset significantly associated with GPFS. The 2-year GPFS was significantly increased in patients receiving more than the median number of donor iNKTs (0.11 × 10⁶/kg), being 49% vs 22% for those who received less than the median number (P = .007; Figure 1A). In addition, the impact of iNKT dose on GPFS has been assessed by quartile. There was no statistically significant difference between the first and the second quartile (23% [range, 8-44%] vs 21% [range, 7-41%], respectively; P = .72) and between the third and the fourth quartile (51% [range, 28-70%] vs 45% [range, 18-59%], respectively; P = .42). Infusion of a graft with a higher number of iNKTs has no impact on OS (P = .51; Figure 1B).
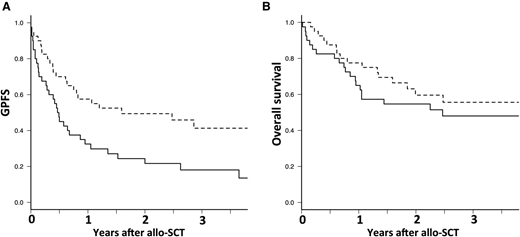
Larger number of donor iNKT in the graft has no impact on overall survival but is associated with improved GPFS. Dashed line is for iNKT >0.011 × 10⁷/kg and continuous line for iNKT <0.011 × 10⁷/kg. (A) Overall survival and (B) GPFS.
Larger number of donor iNKT in the graft has no impact on overall survival but is associated with improved GPFS. Dashed line is for iNKT >0.011 × 10⁷/kg and continuous line for iNKT <0.011 × 10⁷/kg. (A) Overall survival and (B) GPFS.
In multivariate analysis, the patient’s age at transplant was the only factor with a significant impact on OS. This was significantly decreased in patients >60 years compared with those <60 years (hazard ratio [HR] = 2.27; 95% CI, 1.14-4.52; P = .02; Table 3). The number of iNKTs within the graft was the only factor with a significant impact on GPFS in multivariate analysis. GPFS was significantly increased in patients who received a graft with iNKTs >0.11 × 10⁶/kg compared with those whose grafts contained <0.11 × 10⁶ iNKTs/kg (HR = 0.48; 95% CI, 0.27-0.85; P = .01). Of note, the ratio of iNKT/T cells and iNKTs assessed as a continuous variable had no impact on GPFS.
Multivariate analysis of transplant-related events
| Outcome | HR (95% CI) | P value |
|---|---|---|
| OS | ||
| Age >60 vs <60 years | 2.27 (1.14-4.52) | .02 |
| Unrelated donor vs MRD | 1.93 (0.61-6.07) | .26 |
| Low-intermediate vs high-very-high-risk disease | 1.77 (0.81-3.83) | .15 |
| CsA + MMF or MTX vs CsA alone | 1.16 (0.38-3.51) | .79 |
| iNKT >0.11 × 10⁶/kg vs <0.11 × 10⁶/kg | 0.60 (0.30-1.19) | .14 |
| GPFS | ||
| Unrelated donor vs MRD | 1.54 (0.87-2.75) | .14 |
| ATG vs no ATG | 0.92 (0.40-2.13) | .84 |
| iNKT >0.11 × 10⁶/kg vs <0.11 × 10⁶/kg | 0.48 (0.27-0.85) | .01 |
| NRM | ||
| Unrelated donor vs MRD | 5.95 (0.75-47.35) | .09 |
| RIC vs MAC | 1.95 (0.67-5.70) | .22 |
| CsA + MMF or MTX vs CsA alone | 0.72 (0.12-4.21) | .72 |
| iNKT >0.11 × 10⁶/kg vs <0.11 × 10⁶/kg | 0.87 (0.32-2.33) | .78 |
| Relapse progression | ||
| CMV donor/recipient negative vs others | 0.57 (0.25-1.31) | .19 |
| Low-intermediate vs high-very-high-risk disease | 2.59 (1.12-6.00) | .03 |
| ATG vs no ATG | 0.34 (0.12-0.94) | .04 |
| iNKT >0.11 × 10⁶/kg vs <0.11 × 10⁶/kg | 0.75 (0.31-1.78) | .51 |
| Grade III-IV acute GVHD | ||
| Female donor to male recipient vs others | 0.38 (0.05-3.09) | .37 |
| Unrelated donor vs MRD | 2.21 (0.46-10.60) | .32 |
| ATG vs no ATG | 1.2 × 10⁸ (0-∞) | 1.00 |
| iNKT >0.11 × 10⁶/kg vs <0.11 × 10⁶/kg | 0.48 (0.13-1.60) | .22 |
| NIH grade 2-3 chronic GVHD | ||
| Low-intermediate vs high-very-high-risk disease | 8. 9 × 10⁻⁹ (0-∞) | .99 |
| ATG vs no ATG | 0.33 (0.09-1.23) | .10 |
| iNKT >0.11 × 10⁶/kg vs <0.11 × 10⁶/kg | 0.03 (1.9 × 10⁻¹²-5.5 × 10⁸) | .78 |
Bold denotes statistically significant.
Improved GPFS is a consequence of both a decrease in relapse and in severe cGVHD
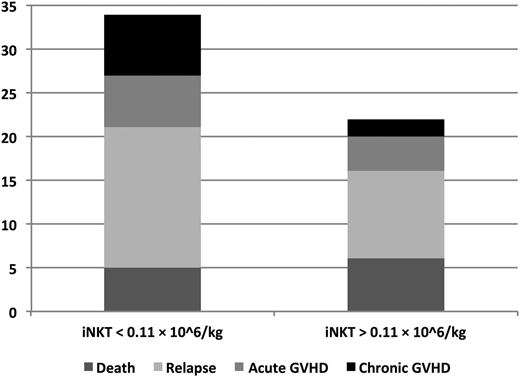
When comparing the GPFS events (defined as the first event) according to the iNKT dose administered, the increased GPFS in patients who received <0.11 × 10⁶ iNKTs/kg was related to an increase in relapse and in severe NIH grade 2 to 3 cGVHD in those patients (Figure 2). Therefore, there was a trend toward a decreased incidence of relapse/progression in patients who received a graft with iNKTs >0.11 × 10⁶/kg compared with those grafted with <0.11 × 10⁶ iNKTs/kg (23% vs 41%; P = .12; Figure 3A). In contrast, there was no significant difference in NRM, grade III to IV aGVHD, and severe NIH grade 2 to 3 cGVHD between patients who received a high or low number of iNKTs (18% vs 20%, P = .97; 10% vs 15%, P = .49; and 13% vs 20%, respectively; P = .32; Figure 3B-D).

Outcome after allogeneic SCT according to the number of donor iNKTs in the graft. Dashed line is for iNKT >0.011 × 10⁷/kg and continuous line for iNKT <0.011 × 10⁷/kg. (A) Cumulative incidence of relapse. (B) Cumulative incidence of nonrelapse mortality. (C) Cumulative incidence of grade III to IV acute GVHD. (D) Cumulative incidence of NIH grade 2 to 3 chronic GVHD.
Outcome after allogeneic SCT according to the number of donor iNKTs in the graft. Dashed line is for iNKT >0.011 × 10⁷/kg and continuous line for iNKT <0.011 × 10⁷/kg. (A) Cumulative incidence of relapse. (B) Cumulative incidence of nonrelapse mortality. (C) Cumulative incidence of grade III to IV acute GVHD. (D) Cumulative incidence of NIH grade 2 to 3 chronic GVHD.
Discussion
This study is the first to evaluate the impact of a large number of immune cell subsets contained within the PBSC allograft on the GPFS composite end point. We report that high iNKT doses in PBSC grafts were correlated with a significantly improved GPFS. Despite no improvement of OS was reported in patients that received a higher dose of iNKTs, we believe our results are of interest. Indeed, nowadays, our efforts must not be limited to improve patient’s survival but also favor an ideal recovery from allo-SCT. Therefore, identification of a cell subset that correlates with GPFS, which predicts cure without ongoing morbidity in patients undergoing allo-SCT, is clinically meaningful. In addition, our data suggest that improved GPFS in patients receiving a high iNKT dose was mainly related to a decreased risk of relapse. The study population is representative of the current transplantation practice, with a majority a patients receiving a fludarabine + busulfan–based conditioning regimen and in vivo T-cell depletion using ATG.
iNKTs are a population of lymphocytes that coexpress T-cell and NK-cell markers with regulatory function. iNKTs express a semi-invariant T-cell receptor α chain (Vα24Jα18 in human) that recognizes lipids presented by the nonpolymorphic class I–like molecule CD1d.18
Thus far, the beneficial immunologic effects of iNKTs in the setting of allo-SCT were associated to a decreased incidence of acute GVHD both in experimental models19,20 and in the clinical setting. Therefore, Chaidos et al reported that PBSC grafts with higher iNKT doses were associated with a significant decrease of aGVHD.6 Rubio et al showed that a high peripheral blood iNKT/T-cell ratio early after allo-SCT was associated with a significant reduction of aGVHD.21 Experimental models suggest that low intensity conditioning using total lymphoid irradiation (TLI) and ATG leads to an expansion of host iNKTs and a reduction of aGVHD.22 Therefore, a clinical trial reported a very low incidence of acute GVHD in patients receiving a TLI/ATG conditioning.23 Interestingly, use of such conditioning for combined kidney transplantation and allo-SCT induced graft tolerance, associated with an increased iNKT/T-cell ratio.24
In contrast, in our study there was no significant difference in aGVHD incidence according to the PBSC graft iNKT dose. However, in the study of Chaidos et al, the cumulative incidence of grade II to IV aGVHD at day 180 for patients receiving total iNKT doses below or above the median was 64.3% vs 31% (P = .014), against 25% vs 20% (P = .53) in our study. The lower incidence of aGVHD observed in our study may be explained by the use of ATG in the majority of patients. Indeed, despite the impact of ATG appearing to be greater on cGVHD than aGVHD, the use of ATG is associated with a significant reduction of aGVHD incidence in most of the randomized and nonrandomized studies.25 Among all immune cells, ATG has the highest affinity for naïve T cells,26 which are enriched for alloreactive T cells.27 As use of ATG is associated with a profound decrease of naïve T cells,28 we hypothesized that ATG killed predominantly donor naïve T cells, leading to an increased iNKT/T-cell ratio. Therefore, ATG administration enhances modulation of GVHD by iNKTs while overcoming, at least in part, the impact of iNKT dose.
The improved GPFS associated with higher iNKTs in the PBSC graft was mainly related to a decreased incidence of relapse. The strong antitumor activity of iNKTs is well established. Experimental models have shown that iNKTs contained within G-CSF–mobilized PBSC graft enhance leukemia eradication after allo-SCT.29 Schneidawind at al. have shown that mice that received CD4+ iNKTs without conventional T cells showed a significant lower tumor growth and a significant survival benefit compared with the control group.19 Therefore, CD4+ iNKTs preserve conventional T cell–mediated GVT reaction and exerted GVT effects by themselves after allo-SCT. Indeed, during immunosurveillance, iNKTs can recognize endogenous lipids presented by CD1d molecules on tumors cells and subsequently eliminate tumor cells directly through iNKT-mediated lysis.8 Thus, iNKTs have been shown to be protective in the antitumor immune response to B-cell lymphoma in a CD1d-dependent manner.30 Of note, CD1d is preferentially expressed in hematopoietic cells,31 and hematologic malignancies retain this expression.32-36 Furthermore, impaired iNKT cell function is associated with disease progression in patients with multiple myeloma.32 In the setting of allo-SCT, de Lalla et al reported that after ex vivo T cell–depleted pediatric haploidentical allo-SCT, iNKT reconstitution was associated with sustained disease remission.37 Finally, in the study of Rubio et al, patients with a higher iNKT/T-cell ratio showed a trend toward a lower risk of relapse.21 Together with the current study, these data suggest an antitumor effect of donor-derived iNKTs after allo-SCT.
Among all the immune cell subsets analyzed, the number of iNKTs contained in the PBSC graft was the only one with a significant impact on outcome after allo-SCT. Reshef et al reported an improved survival in patients who received PBSC grafts with higher CD8+ T-cell dose.5 The absence of impact of CD8+ T cells in our study is probably explained by the use of ATG for in vivo T-cell depletion in the majority of patients, whereas no T-cell depletion was performed in the study of Reshef et al. Of note, Waller et al did not identify a PBSC graft cell subset significantly associated with patient outcome10 ; however, the impact on the GPFS composite end point was not evaluated in that study. Of note, one could speculate that iNKT frequencies might represent a surrogate for some favorable combination of other subset. However, there was no correlation between any cell subset and iNKTs. Furthermore, a regression model was built to evaluate the impact of CD34+, CD8+, and Treg cells on iNKTs. There was no relation between iNKTs and CD34+, CD8+, and Treg cells (P = .28; data not shown).
Due to the retrospective nature of the study, enumeration of immune cells subsets have been only performed, as in the study by Chaidos et al,6 on cryopreserved samples. This could represent a limitation of our study. However, Fulcher et al enumerated iNKTs in both settings (cryopreserved and fresh samples).38 Although iNKTs were slightly but significantly higher than in freshly collected samples, they found with both methods a statistically significant decrease in the proportion of iNKTs in patients with common variable immunodeficiency. Therefore, this finding appears to be reassuring and does not contradict the analysis of iNKTs on cryopreserved samples, especially because our method was consistent throughout the study.
In the clinical setting, the use of PBSC grafts with higher doses of iNKTs appears to be a valuable strategy to improve patients’ outcome after allo-SCT. Unfortunately, the number of iNKTs within the graft was independent of donor characteristics (sex, age, related vs unrelated). Therefore, it is not possible to select a donor who will mobilize more iNKTs. However, in vitro expansion of iNKTs to enrich iNKT-poor grafts may be a promising approach to improve patient outcome. Furthermore, the use of new PBSC mobilization agents may help increase the number of iNKTs in the graft. Fms-like tyrosine kinase-3 ligand (Flt3L) appears to be particularly interesting. In a mouse model, donor mobilization with progenipoietin-1, a chimeric cytokine that stimulates both Flt3L receptors, enhanced iNKT-dependent leukemia eradication.29 Of note, a recombinant human Flt3L has recently shown to be safe and effective for PBSC mobilization in healthy donors.39
In conclusion, our study shows that the dose of iNKTs in a G-CSF–mobilized PBSC graft is associated with improved GPFS, highlighting the beneficial role of iNKTs on the usually antagonistic GVHD and GVT effects. However, confirmatory studies on larger numbers of patients are required to confirm this beneficial role and to decipher the respective GVT effect of iNKTs on both myeloid and lymphoid malignancies.
Presented at the 57th annual meeting of the American Society of Hematology, Orlando, FL, December 5-8, 2015.
The online version of this article contains a data supplement.
The publication costs of this article were defrayed in part by page charge payment. Therefore, and solely to indicate this fact, this article is hereby marked “advertisement” in accordance with 18 USC section 1734.
Acknowledgments
The authors thank the nursing staff for providing excellent care for our patients and the following physicians for their dedicated patient care: N. Blin, A. Clavert, V. Dubruille, T. Gastinne, B. Mahe, and F. Mechinaud. M.M. thanks Prof J. V. Melo (Adelaide, Australia) for critical reading of the manuscript.
F.M. was supported by educational grants from the Association for Training, Education and Research in Hematology, Immunology and Transplantation. This work was performed as part of the Institut Hospitalo-Universitaire–Cesti project, which received French government financial support managed by the National Research Agency, via the investment of the future program ANR-10-IBHU-005. The Institut Hospitalo-Universitaire–Cesti project is also supported by Nantes Metropole and the Pays de la Loire Region. The authors also thank the Fondation de France, the Fondation contre la Leucémie, the Agence de Biomédecine, the Association Cent pour Sang la Vie, the Association Laurette Fuguain, and the International Research Group on Unrelated Hematopoietic Stem Cell Transplantation for their generous and continuous support to our clinical and basic research work. Our group is supported by several grants from the Hospital Clinical Research Program from the French National Cancer Institute (to M.M.).
Authorship
Contribution: F.M. performed the experiment, collected, assembled and analyzed data, performed statistical analysis, and wrote and revised the manuscript; B.G. performed the experiment, supervised research, analyzed data, and wrote and revised the manuscript; M.M. recruited patients, supervised research, analyzed data, and wrote and revised the manuscript; M.L. analyzed data, performed statistical analysis, and commented on the manuscript; A.D., S.D., and A.-G.L. provided study material, collected data, and commented on the manuscript; P.C., T.G., F.R., P.P., E.B., and P.M. recruited patients and helped write the manuscript; M.G. and P.S. provided administrative and logistical support and helped write the manuscript; and all authors approved submission of the manuscript for publication purposes.
Conflict-of-interest disclosure: The authors declare no competing financial interests.
Correspondence: Mohamad Mohty, Service d’Hématologie Clinique et de Thérapie Cellulaire, Hôpital Saint Antoine, APHP, Université Pierre et Marie Curie and INSERM, UMRs 938, 184 rue du Faubourg Saint-Antoine, 75012 Paris, France; e-mail: mohamad.mohty@inserm.fr.

This feature is available to Subscribers Only
Sign In or Create an Account Close Modal