Key Points
Investigation of the distinct roles of hepcidin and interleukin 6 on iron metabolism and inflammation in the onset and resolution of AI.
Abstract
Anemia of inflammation (AI) is commonly observed in chronic inflammatory states and may hinder patient recovery and survival. Induction of hepcidin, mediated by interleukin 6, leads to iron-restricted erythropoiesis and anemia. Several translational studies have been directed at neutralizing hepcidin overexpression as a therapeutic strategy against AI. However, additional hepcidin-independent mechanisms contribute to AI, which are likely mediated by a direct effect of inflammatory cytokines on erythropoiesis. In this study, we used wild-type, hepcidin knockout (Hamp-KO) and interleukin 6 knockout (IL-6-KO) mice as models of AI. AI was induced with heat-killed Brucella abortus (BA). The distinct roles of iron metabolism and inflammation triggered by interleukin 6 and hepcidin were investigated. BA-treated wild-type mice showed increased expression of hepcidin and inflammatory cytokines, as well as transitory suppression of erythropoiesis and shortened red blood cell lifespan, all of which contributed to the severe anemia of these mice. In contrast, BA-treated Hamp-KO or IL-6-KO mice showed milder anemia and faster recovery compared with normal mice. Moreover, they exhibited different patterns in the development and resolution of anemia, supporting the notion that interleukin 6 and hepcidin play distinct roles in modulating erythropoiesis in AI.
Introduction
Anemia of inflammation (AI), also known as anemia of chronic disease, is a very common form of anemia that affects patients with inflammatory conditions, such as chronic infections, autoimmune diseases, and malignancies.1-3 The pathophysiology of AI originates from the host defense system and is characterized by parallel pathways that ultimately interfere with iron metabolism and red blood cell (RBC) production.1,4 The retention of iron within the mononuclear phagocytic system is one of the causes of AI and is responsible for hypoferremia and the consequent limited availability of iron for erythroid progenitor cells (iron-restricted erythropoiesis).4,5 Additionally, several cytokines, including tumor necrosis factor-α (TNF-α), interferon-γ, and interleukin 1 (IL-1), negatively regulate the production and bioactivity of erythropoietin,6,7 as well as the proliferation, survival, and differentiation of erythroid progenitors cells.8,9
The hepatic hormone hepcidin (Hamp),10 the master regulator of iron metabolism, is also a known mediator of AI.3,11 By binding the iron-exporter ferroportin,12 Hamp causes its internalization and degradation in lysosomes,13 thus limiting iron recycling and availability for hemoglobin (Hb) synthesis. In AI, Hamp is expressed at abnormally high levels, resulting in the blockage of iron recycling from macrophages and of the duodenal absorption of dietary iron.5 Reduced serum iron concentration and transferrin (Tf) saturation, together with elevated ferritin levels, are typically observed in AI. These changes in iron homeostasis result in iron-restricted erythropoiesis and anemia, and if sustained, systemic iron deficiency.
The disruption of the murine Hamp gene causes early and severe tissue iron overload in mice, with sparing of the spleen macrophages and increased serum iron and ferritin levels compared with wild-type (WT) mice.14 Numerous studies have linked the overexpression of Hamp during inflammation to increased levels of IL-62,15,16 in a process mediated by signal transducer and activator of transcription 3.17-19 Following lipopolysaccharide administration, the effect on Hamp synthesis is either suppressed15 or reduced in IL-6–deficient mice.20 Based on these observations, the IL-6/Hamp axis is implicated in the pathogenesis of AI. The role of IL-6 in triggering Hamp expression after an inflammatory insult is expected to negatively affect erythropoiesis primarily by inducing iron deficiency. However, due to the important role of IL-6 in inflammation, it is also possible that this cytokine affects erythropoiesis independently from its effect on iron metabolism. The focus of many translational studies has been to neutralize Hamp overexpression as a therapeutic strategy against AI.3 However, it is uncertain how effective it would be to target Hamp to correct AI, prompting us to investigate the distinct roles of Hamp and IL-6 in AI.
Here we characterized the effect of the ablation of Hamp or IL-6 in a murine model of AI induced by heat-killed Brucella abortus (BA).21 BA-treated WT mice displayed complex pathogenesis, which involved upregulation of inflammatory cytokines and Hamp expression. Additional direct effects on erythropoiesis were also observed, such as transitory suppression of erythropoiesis and shortened RBC lifespan, resulting in severe anemia. In contrast, Hamp knockout (Hamp-KO) and IL-6 knockout (IL-6-KO) mice injected with BA showed milder anemia and faster recovery compared with normal mice. Furthermore, mice lacking Hamp or IL-6 exhibited different patterns in the development and resolution of the anemia, underlining distinct roles for these 2 mediators in modulating erythropoiesis in AI.
Methods
BA model of AI and induction of stress erythropoiesis
BA (strain 1119-3; US Department of Agriculture, Animal and Plant Health Inspection Service, National Veterinary Services Laboratories) was prepared as described by Sasu et al.21 One intraperitoneal injection of BA (5 × 10⁸ particles/mouse) was used to induce inflammation in WT (C57BL/6; The Jackson laboratory, Bar Harbor, ME), IL-6-KO,22 and Hamp-KO14 mice at 4 months of age. We analyzed both female and male mice and did not observe differences in the response to BA. Hb was measured 7 days after BA administration. The mice that did not develop anemia were excluded from analysis (n = 10-12/group). All animal studies were conducted under protocols approved by the Institutional Animal Care and Use Committee of Weill Cornell Medical College.
Flow cytometry analyses of erythropoiesis and hemophagocytosis
To study erythropoiesis and discriminate the erythroid precursor populations, bone marrow (BM) and spleen cells were incubated with fluorescein isothiocyanate–conjugated CD71, phycoerythrin (PE)-conjugated CD44, and allophycocyanin-presenting cell–conjugated Ter119 antibodies (BD Pharmingen).23 To measure hemophagocytosis, we used fluorescein isothiocyanate–conjugated Ter119 to discriminate RBCs, and combined PE-conjugated Gr1, allophycocyanin-presenting cell–conjugated CD115, and PE-Cy7–conjugated F4/80 antibodies (BD Pharmingen) to discriminate macrophages as already described.24 Cells were sorted using a FACSCalibur instrument (BD Pharmingen), and the results were analyzed with FlowJo software (TreeStar). Additionally, hemophagocytosis analysis was performed with the same antibodies using an ImageStream X Mark II (Amnis) that combines flow cytometry with imaging to visualize F4/80+ macrophage and Ter119+ RBC interaction and RBC internalization.
Statistics
Data are presented as mean ± standard deviation (SD). An unpaired 2-tailed Student t test was performed using Microsoft Excel for Mac 2011 software. P < .05 was considered statistically significant.
Results
Treatment with BA caused severe inflammatory anemia in WT mice
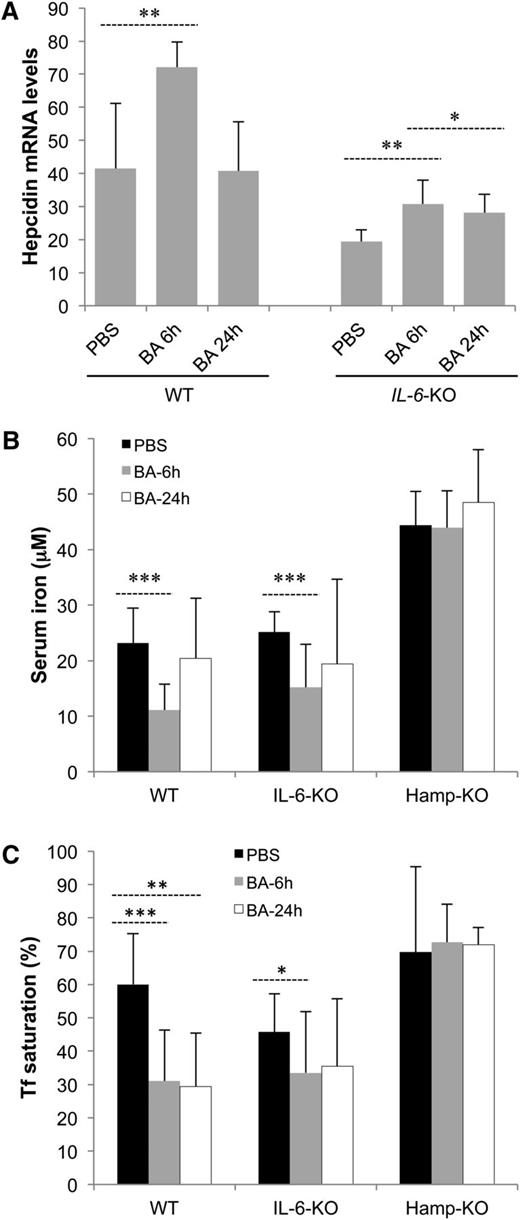
WT mice injected with BA developed a very rapid inflammatory response associated with increased Hamp messenger RNA (mRNA) expression in the liver (Figure 1A) 6 hours after BA.21 Values were normalized after 24 hours. Decreased serum iron concentration and Tf saturation, typical of iron-restricted anemia, appeared 6 hours after BA administration and returned to baseline after 24 hours or later, respectively (Figure 1B-C).
BA-treated mice show signs of iron-restricted erythropoiesis. (A) mRNA level of Hamp in liver. Mouse glyceraldehyde-3-phosphate dehydrogenase and β-actin were used as endogenous controls in the quantitative polymerase chain reaction (n = 4-8). (B) Iron concentration and (C) Tf saturation in serum samples from WT, IL-6-KO, and Hamp-KO mice (n = 5-10). P values were calculated using unpaired, 2-tailed Student t test. *P < .05; **P < .01; ***P < .001.
BA-treated mice show signs of iron-restricted erythropoiesis. (A) mRNA level of Hamp in liver. Mouse glyceraldehyde-3-phosphate dehydrogenase and β-actin were used as endogenous controls in the quantitative polymerase chain reaction (n = 4-8). (B) Iron concentration and (C) Tf saturation in serum samples from WT, IL-6-KO, and Hamp-KO mice (n = 5-10). P values were calculated using unpaired, 2-tailed Student t test. *P < .05; **P < .01; ***P < .001.
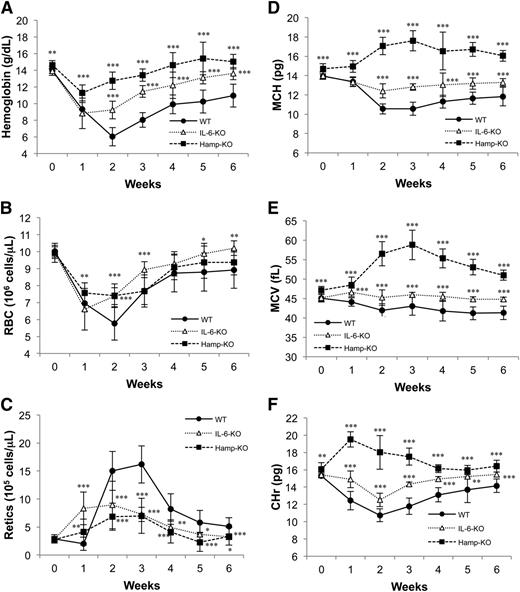
BA-treated WT mice were followed by weekly complete blood counts (CBCs) to observe the development and resolution of anemia. Hb values reached the nadir 2 weeks after BA injection (6.0 ± 1.1 g/dL; Figure 2A), but mice eventually recovered after 6 weeks (data not shown). RBC counts, mean corpuscular Hb (MCH), and mean corpuscular volume (MCV) were all reduced 1 to 2 weeks after treatment and remained low during the 6 weeks of observation (Figure 2B,D-E). Reticulocytosis was observed beginning on the second week and characterized the recovery phase (Figure 2C). Finally, the reticulocyte Hb content (CHr) was reduced similarly to MCH values (Figure 2F).
BA induces inflammatory anemia and changes in erythroid parameters in WT, IL-6-KO, and Hamp-KO mice. Mice were injected with 5 × 10⁸ particles of BA, and their hematological parameters were monitored with CBC over 6 weeks. (A) Hb, (B) RBC number, (C) reticulocytes number, (D) MCH, (E) MCV, and (F) CHr. Twelve mice for each genotype were analyzed per time point. Error bars represent SD. Each time point in IL-6-KO and Hamp-KO mice was compared with the same time point in WT mice. P values were calculated using unpaired, 2-tailed Student t test. *P < .05; **P < .01; ***P < .001.
BA induces inflammatory anemia and changes in erythroid parameters in WT, IL-6-KO, and Hamp-KO mice. Mice were injected with 5 × 10⁸ particles of BA, and their hematological parameters were monitored with CBC over 6 weeks. (A) Hb, (B) RBC number, (C) reticulocytes number, (D) MCH, (E) MCV, and (F) CHr. Twelve mice for each genotype were analyzed per time point. Error bars represent SD. Each time point in IL-6-KO and Hamp-KO mice was compared with the same time point in WT mice. P values were calculated using unpaired, 2-tailed Student t test. *P < .05; **P < .01; ***P < .001.
Lack of IL-6 and Hamp is protective against the anemia triggered by administration of BA
Liver Hamp mRNA expression was increased in IL-6-KO mice 6 and 24 hours after injection of BA, although not as much as in WT mice (Figure 1A). In addition, serum iron concentration and Tf saturation were reduced 6 hours after BA administration but were not significantly different from the baseline at 24 hours (Figure 1B-C). In Hamp-KO mice on the other hand, serum iron concentration and Tf saturation were not affected by BA at any time point analyzed (Figure 1B-C), since the absence of Hamp expression did not limit iron absorption and recycling.
After BA administration, IL-6-KO and Hamp-KO mice developed less severe anemia than WT mice. Compared with WT, IL-6-KO mice exhibited increased Hb levels after 2 weeks (9.2 ± 1.1 g/dL), reaching baseline by week 6. Hamp-KO mice were the least affected by BA, showing the highest Hb levels of all mice at 2 weeks (12.7 ± 1.0 g/dL) and returning to baseline by week 4 (Figure 2A). Following BA administration, both IL-6-KO and Hamp-KO showed a reduction in the number of RBCs compared with baseline, although not as dramatic as in WT mice (Figure 2B). Specifically, Hamp-KO mice showed significantly higher RBCs than WT mice already 1 week after BA injection, whereas IL-6-KO mice showed higher RBCs 2 weeks after BA administration. Both RBC numbers returned to baseline at week 5. After 1 week, the total number of reticulocytes was increased in both IL-6-KO and Hamp-KO mice compared with baseline and to WT mice (Figure 2C). Moreover, Hamp-KO and IL-6-KO mice showed increased MCH, MCV, and CHr values compared with WT mice following BA treatment (Figure 2D-F). In particular, Hamp-KO mice showed the highest MCH, MCV, and CHr values, indicating superior hemoglobinization of reticulocytes and RBCs. This feature likely explained why Hamp-KO mice had the highest Hb values of all the BA-treated animals, despite a similar reduction in the number of RBCs as WT and IL-6-KO mice. In contrast, IL-6-KO mice exhibited a more robust production of reticulocytes than WT and Hamp-KO animals at week 1 (Figure 2C), allowing them to produce the same number of RBCs as Hamp-KO mice starting from week 2.
Overall, these data showed that BA-treated IL-6-KO and Hamp-KO mice still developed anemia, albeit less severe than in WT mice. In addition, these observations pointed to an individual role for Hamp and IL-6 in the etiology of AI.
Lack of Hamp supports recovery from BA-induced anemia
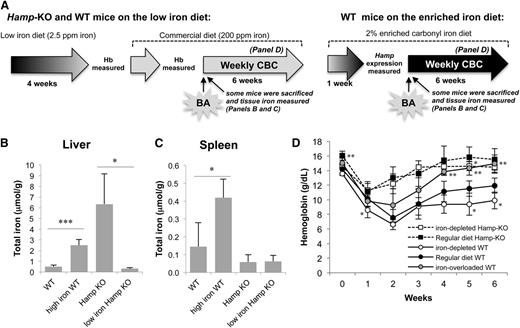
Hamp-KO mice are typically iron overloaded due to unrestricted iron absorption, a feature that could explain the mild anemia they developed after BA administration. To examine the contribution of body iron storage to the severity of anemia observed in BA-treated Hamp-KO and WT mice, we fed them either an iron-deficient diet (2.5 ppm iron) or a 2% iron-enriched diet, as shown in Figure 3A. The low iron diet normalized the liver iron content of Hamp-KO mice, which was not significantly different from that of WT mice on the regular diet (Figure 3B), whereas did not affect the spleen iron content, which is consistent with previous reports14 (Figure 3C). As expected, the iron-enriched diet increased both liver and spleen iron content of WT mice (Figure 3B-C).
Lack of Hamp supports recovery from BA-induced anemia. (A) Hamp-KO mice were fed an iron-deficient diet (2.5 ppm iron) to determine the effect of their tissue iron storage on the recovery from BA-induced anemia. Hamp-KO controls were fed a standard iron content diet (regular). WT mice were either fed the iron-deficient diet or a 2% iron enriched diet to generate iron-depleted or iron-overloaded mice that maintain normal Hamp expression. Iron depletion was monitored by measuring mice Hb levels, whereas iron overload was determined by increased hepatic Hamp expression (data not shown). Total iron content was measured in the (B) liver and (C) spleen of iron-depleted Hamp-KO, iron-overloaded WT, and the respective control mice (n = 3-5). (D) Hamp-KO mice fed the low iron diet, WT mice fed the low or high iron diet, and Hamp-KO and WT controls on the regular diet were injected with 5 × 10⁸ particles of BA, and their hematological parameters were followed with CBC over 6 weeks (n = 4-8). Iron-depleted Hamp-KO mice were compared with control Hamp-KO mice, whereas iron-depleted and iron-overloaded WT mice were compared with control WT mice for the respective time points. Error bars represent SD. P values were calculated using unpaired, 2-tailed Student t test. *P < .05; **P < .01; ***P < .001.
Lack of Hamp supports recovery from BA-induced anemia. (A) Hamp-KO mice were fed an iron-deficient diet (2.5 ppm iron) to determine the effect of their tissue iron storage on the recovery from BA-induced anemia. Hamp-KO controls were fed a standard iron content diet (regular). WT mice were either fed the iron-deficient diet or a 2% iron enriched diet to generate iron-depleted or iron-overloaded mice that maintain normal Hamp expression. Iron depletion was monitored by measuring mice Hb levels, whereas iron overload was determined by increased hepatic Hamp expression (data not shown). Total iron content was measured in the (B) liver and (C) spleen of iron-depleted Hamp-KO, iron-overloaded WT, and the respective control mice (n = 3-5). (D) Hamp-KO mice fed the low iron diet, WT mice fed the low or high iron diet, and Hamp-KO and WT controls on the regular diet were injected with 5 × 10⁸ particles of BA, and their hematological parameters were followed with CBC over 6 weeks (n = 4-8). Iron-depleted Hamp-KO mice were compared with control Hamp-KO mice, whereas iron-depleted and iron-overloaded WT mice were compared with control WT mice for the respective time points. Error bars represent SD. P values were calculated using unpaired, 2-tailed Student t test. *P < .05; **P < .01; ***P < .001.
A diet rich in iron facilitated the recovery of BA-treated WT mice from anemia, whereas a diet poor in iron made the recovery more difficult (Figure 3D). The iron-depleted Hamp-KO mice were partially protected from anemia after BA administration and showed a similar recovery pattern as Hamp-KO mice fed the regular commercial diet (12.2 ± 1.3 g/dL vs 13.0 ± 1.5 g/dL, respectively, after 2 weeks; Figure 3D). Furthermore, the MCH in iron-depleted Hamp-KO mice was not different from that of Hamp-KO on a regular diet (data not shown). This indicated that the lack of Hamp expression, and consequent alteration in iron metabolism, was a contributing factor (more than iron overload per se) in enhancing the hemoglobinization of RBCs in these animals.
Erythropoiesis is severely impaired in the BM of BA-treated mice
Fluorescence-activated cell sorter (FACS) analysis25 performed 3 days after BA injection, when mice were not yet anemic, showed impairment of erythropoiesis in BM and spleen. In the BM of all mice analyzed, early erythroid progenitors such as pro- (I), basophilic- (II), and polychromatic- (III) erythroblasts were almost completely absent, whereas orthochromatic cells and reticulocytes (IV) were significantly reduced (supplemental Figure 1, available on the Blood Web site). However, both phosphate-buffered saline (PBS)- and BA-treated Hamp-KO mice had a higher number of erythroid precursors in the spleen compared with WT and IL-6-KO animals (supplemental Figures 1 and 2A). Erythroid cell death associated with increased reactive oxygen species formation and apoptosis (supplemental Figure 3).
Moreover, we investigated the number of erythroid burst-forming units and colony-forming units in the BM of all BA-treated mice compared with controls at 4, 14, and 24 hours following BA administration. In the BM, the decline in the number of colonies was visible at 14 hours in WT, but only after 24 hours in IL-6-KO and Hamp-KO mice (supplemental Figures 4 and 5). These observations suggested that lack of IL-6 and Hamp was associated with a reduction in the inflammatory insult triggered by BA, although both models showed a significant cell death of the erythroid progenitors over time.
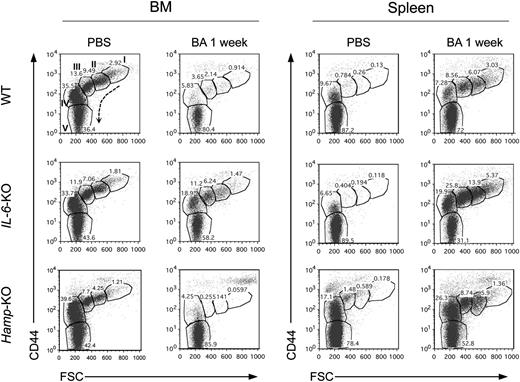
Analysis of erythropoiesis 1 week after BA administration, when anemia was fully developed, still showed a dramatic reduction of erythropoiesis in the BM of WT and Hamp-KO mice compared with the respective PBS-treated controls (Figure 4). IL-6-KO mice were an exception, showing an increased number of erythroid progenitors and suggesting that lack of IL-6 accelerated the recovery of erythropoiesis following BA administration. Nevertheless, all mice were compensating for the lack of erythroid precursor cells in the BM with stress erythropoiesis in the spleen.26
Erythropoiesis is severely impaired in BA-treated mice. FACS analysis of BM and spleen of WT, IL-6-KO, and Hamp-KO mice 1 week after BA injection. CD71 (Tf receptor), Ter119 (erythroid-specific), and CD44 (adhesion molecule that exhibits a progressive decrease from pro-erythroblast to reticulocyte) costaining was used. CD71+/Ter119+ and CD71−/Ter119+, characterizing erythroid precursor and mature RBCs, respectively, were selected and plotted as CD44 vs forward scatter, to show the different stages of erythroid maturation. Maturation stages occur as indicated by the arrow and include (I) pro-erythroblast, (II) basophilic, (III) polychromatic, (IV) orthochromatic reticulocytes, and (V) mature erythrocytes. The percentage of cells constituting each population is shown. Three mice per each group were analyzed; 1 representative mouse per each group is shown.
Erythropoiesis is severely impaired in BA-treated mice. FACS analysis of BM and spleen of WT, IL-6-KO, and Hamp-KO mice 1 week after BA injection. CD71 (Tf receptor), Ter119 (erythroid-specific), and CD44 (adhesion molecule that exhibits a progressive decrease from pro-erythroblast to reticulocyte) costaining was used. CD71+/Ter119+ and CD71−/Ter119+, characterizing erythroid precursor and mature RBCs, respectively, were selected and plotted as CD44 vs forward scatter, to show the different stages of erythroid maturation. Maturation stages occur as indicated by the arrow and include (I) pro-erythroblast, (II) basophilic, (III) polychromatic, (IV) orthochromatic reticulocytes, and (V) mature erythrocytes. The percentage of cells constituting each population is shown. Three mice per each group were analyzed; 1 representative mouse per each group is shown.
Interestingly, BA-treated Hamp-KO mice, despite being significantly less anemic than BA-treated WT mice (Figure 2A), exhibited the same reduction in the number of BM erythroid progenitors as WT mice (supplemental Figure 2D). This apparent paradox could be explained by the increased erythropoiesis observed in the spleen of these animals (Figure 4; supplemental Figures 2B and 6). Because lack of Hamp was associated with augmented erythropoiesis in the spleen at steady state (supplemental Figure 1), we investigated whether this preexisting extra medullary erythropoiesis could facilitate the recovery from the anemia despite a delayed RBC production in the BM. In other words, we hypothesized that erythropoiesis in the spleen might be spared by the inflammatory stimuli triggered by BA. To address this question, we triggered phlebotomy-induced stress-erythropoiesis26 in the spleen of WT mice and injected them with BA (supplemental Figure 7A). Mice were followed for 7 days to evaluate their Hb values, as well as erythropoiesis in the BM and spleen. Both phlebotomized PBS- and BA-treated mice showed a reduction of Hb levels at day 4 due to the withdrawal. This level of anemia was maintained in mice injected with BA after 1 week, whereas PBS-treated mice recovered (supplemental Figure 7B). The percentage and total number of erythroblasts obtained by FACS analysis confirmed that erythroid cells were more protected in the spleen than in the BM (supplemental Figure 7C-D). This proved that erythropoiesis in the spleen is somehow spared from the effects of BA and contributes to the recovery from the anemia.
RBC production and lifespan are decreased in mice injected with BA
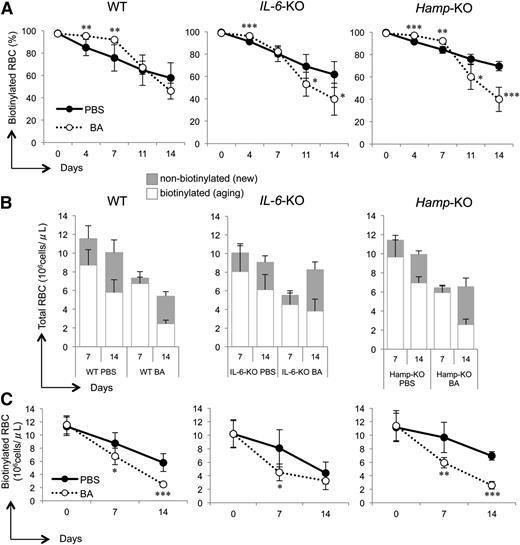
To further investigate the distinct recovery profile of BA-treated mice, we examined the total number of RBCs and their lifespan and correlated these parameters with the profile of the erythroid progenitors in the BM and spleen, as well as reticulocyte synthesis. All PBS-treated mice showed a decrease in the percentage of aging biotinylated RBCs as these were cleared from blood circulation and replaced by nonbiotinylated newly generated erythrocytes. The comparison between control mice showed no significant differences in WT, IL-6-KO, and Hamp-KO mice (Figure 5A). Interestingly, the profile of BA-treated mice was characterized by 2 distinct phases. For WT and Hamp-KO mice, the percentage of biotinylated RBCs remained almost the same during the first phase (91.8 ± 1.6% in WT and 92.0 ± 1.7% in Hamp-KO, up to day 7), indicating no formation of new RBCs. Nevertheless, the percentage of biotinylated RBCs rapidly decreased during the second phase (Figure 5A), indicating production of new RBCs. For IL-6-KO mice, the first phase lasted 4 days, and the percentage of biotinylated RBCs decreased already at day 7 (82.3 ± 4.1%, P < .001).
RBC production and lifespan are decreased in BA-treated mice. (A) Percentage of biotinylated RBCs, (B) total RBC number, and (C) biotinylated RBC number in WT, IL-6-KO, and Hamp-KO mice injected with BA or PBS. We analyzed between 5 and 7 mice for each group. Each time point in BA-treated mice was compared with the same time point in PBS-treated mice in A and C. P values were calculated using unpaired, 2-tailed Student t test. *P < .05; **P < .01; ***P < .001.
RBC production and lifespan are decreased in BA-treated mice. (A) Percentage of biotinylated RBCs, (B) total RBC number, and (C) biotinylated RBC number in WT, IL-6-KO, and Hamp-KO mice injected with BA or PBS. We analyzed between 5 and 7 mice for each group. Each time point in BA-treated mice was compared with the same time point in PBS-treated mice in A and C. P values were calculated using unpaired, 2-tailed Student t test. *P < .05; **P < .01; ***P < .001.
To better characterize the 2 phases in Figure 5A, we also measured the total number of RBCs in circulation in all mice after 1 and 2 weeks, comparing PBS- to BA-treated animals, and discriminated between biotinylated and nonbiotinylated cells. At day 7, the total number of RBCs was reduced in all BA-treated mice compared with PBS controls (WT: 11.53 ± 1.4 PBS vs 7.34 ± 1.3 BA, P < .001. IL-6-KO: 10.06 ± 3.2 PBS vs 5.51 ± 1.7 BA, P < .05. Hamp-KO: 11.41 ± 2.2 PBS vs 6.64 ± 0.8 BA, P < .01; Figure 5B), and characterized by nearly absent production of new nonbiotinylated RBCs (except for IL-6-KO mice). When comparing BA-treated mice vs PBS controls at 14 days, we showed that IL-6-KO and Hamp-KO mice had an increased production of new nonbiotinylated cells (IL-6-KO: 2.63 ± 0.7 PBS vs 4.76 ± 0.8 BA, P < .01. Hamp-KO: 3.0 ± 0.3 PBS vs 3.96 ± 0.9 BA, P < .05), whereas nonbiotinylated RBCs were still reduced in WT mice (WT: 4.26 ± 1.3 PBS vs 2.92 ± 0.5 BA, P < .05). Overall, the profile of erythroid progenitors in the BM and spleen, together with the production of reticulocytes and RBCs, indicated that the knockout mice recovered more efficiently than WT animals. Furthermore, IL-6-KO mice had a more rapid response in increasing the production of RBCs than WT and Hamp-KO mice.
Destruction of mature erythrocytes contribute to the anemia in BA-treated mice
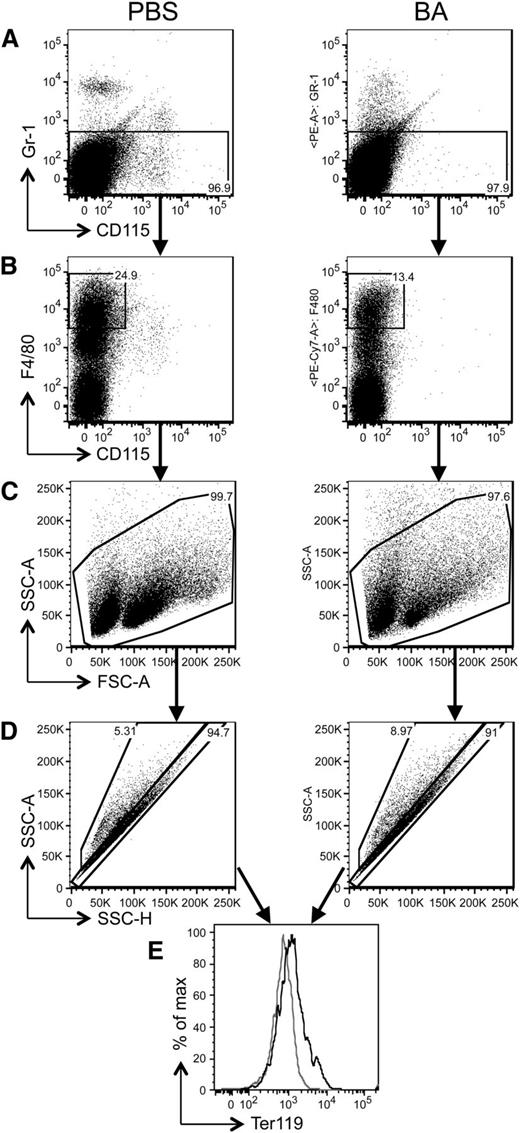
To evaluate whether the reduction in the number of total RBCs was uniquely due to lack of production or was associated with an increased rate of elimination, we compared the absolute number of biotinylated RBCs over time in PBS- and BA-treated mice. Our analysis indicated that in BA-treated mice, the number of RBCs was significantly reduced compared with PBS-treated mice (Figure 5C). These data suggested that in BA-treated animals, the reduction in RBC number was increased compared with the physiological turnover observed in control mice. Therefore, we investigated additional mechanisms that could explain the active elimination of RBCs in these animals and further impair erythropoiesis. Hemophagocytosis due to blood-eating macrophages has been described as a cause of consumptive AI, which contributes to the reduction of circulating RBCs, especially in acute inflammatory settings.27 To investigate whether hemophagocytosis occurs in the BA mouse model, we injected WT mice either with BA or PBS and 2 days later collected the spleen and BM for macrophages analysis. We discriminated macrophages using the three markers Gr1 (Ly6C/G), CD115, and F4/80, as previously described24,26 (Figure 6A-C), and combined them with Ter119 to discriminate RBCs. We measured the percentage of macrophages/RBC multiplets (indicating macrophage binding and internalization of RBCs during the hemophagocytosis process; Figure 6D-E and supplemental Figure 8). Although we did not observe any significant change in the BM of BA-treated WT mice (data not shown), the spleen exhibited an increased percentage of F4/80+/Ter119+ multiplets (P < .05; Figure 6E), corroborating the notion that BA triggered increased hemophagocytosis.
Hemophagocytosis is responsible for the anemia induced by BA treatment. Flow cytometry analysis was performed to identify and measure the interaction between macrophages and RBCs, an indicator of hemophagocytosis. The figure shows the results obtained in the spleen of 2 representative mice, treated with PBS and BA, respectively, and analyzed 2 days after BA injection. Three mice per group were analyzed, obtaining similar results. Gating steps were performed as indicated from A to E. Briefly, (A) we first excluded the Gr1+/CD115− and Gr1+/CD115+ populations (neutrophils and Gr1hi monocytes) and gated both the Gr1−/CD115− and Gr1−/CD115+ cells. (B) These were further divided into an F4/80hi/CD115− population that also included eosinophils. (C) Eosinophils were excluded by their side scatter (SSC)hi distinctive feature. (D) The remaining F4/80hi population, comprised of mature macrophages, was analyzed by plotting SSC-H vs SSC-A, which allows discriminating multiplets vs single cells. Macrophages/RBC multiplets (indicating macrophages binding RBCs during the hemophagocytosis process) were discriminated using F4/80 and Ter119. (E) The increase of Ter119-positive cells (RBCs) among the multiplets indicated that hemophagocytosis was increased in BA-treated mice compared with PBS controls.
Hemophagocytosis is responsible for the anemia induced by BA treatment. Flow cytometry analysis was performed to identify and measure the interaction between macrophages and RBCs, an indicator of hemophagocytosis. The figure shows the results obtained in the spleen of 2 representative mice, treated with PBS and BA, respectively, and analyzed 2 days after BA injection. Three mice per group were analyzed, obtaining similar results. Gating steps were performed as indicated from A to E. Briefly, (A) we first excluded the Gr1+/CD115− and Gr1+/CD115+ populations (neutrophils and Gr1hi monocytes) and gated both the Gr1−/CD115− and Gr1−/CD115+ cells. (B) These were further divided into an F4/80hi/CD115− population that also included eosinophils. (C) Eosinophils were excluded by their side scatter (SSC)hi distinctive feature. (D) The remaining F4/80hi population, comprised of mature macrophages, was analyzed by plotting SSC-H vs SSC-A, which allows discriminating multiplets vs single cells. Macrophages/RBC multiplets (indicating macrophages binding RBCs during the hemophagocytosis process) were discriminated using F4/80 and Ter119. (E) The increase of Ter119-positive cells (RBCs) among the multiplets indicated that hemophagocytosis was increased in BA-treated mice compared with PBS controls.
Discussion
AI is a multifactorial condition common among patients with chronic illnesses and associated with poor health outcomes and low quality of life. Despite its frequency, AI is not sufficiently understood, and effective therapies are lacking. Typical management practices, such as intravenous administration of iron or erythropoiesis stimulating agents, are not consistently effective.3 The lack of suitable mouse models is a limiting factor for the comprehension of the complex pathophysiology of AI. In this study, we characterized the murine model of AI generated with BA and previously introduced by Sasu et al.21
The IL-6/Hamp pathway, a hallmark of AI, is associated with iron-restricted erythropoiesis and anemia caused by increased Hamp expression triggered by IL-6. In our study, we investigated whether IL-6, due to its role in inflammation, could also affect erythropoiesis independently from Hamp and iron metabolism. Different cytokine pathways have already been associated with a severe effect on erythropoiesis. Proinflammatory cytokines, such as interferon-γ, TNF-α, and IL-1, directly affect erythroid cell development,8,28-30 as well as inhibit the production and effectiveness of erythropoietin in vitro6,7 together with IL-6.31 Additionally TNF-α and IL-10 have an effect on cellular iron homeostasis.32,33 Moreover, recent findings by McCranor et al34 support the role of IL-6 in reducing erythropoiesis independently of iron restriction, in vitro. They showed, in fact, that IL-6 has a negative effect on erythropoiesis that occurs during the late stage of erythroid development by impairment of mitochondrial function in maturing RBCs. Altogether these studies support a complex model in which a variety of factors are responsible for the etiology of AI. Our study explored the individual role of Hamp and IL-6.
Many translational studies focused at neutralizing Hamp overexpression as a therapy against AI. However, due to their direct role on erythropoiesis and iron metabolism, cytokines could represent a potential therapeutic target as well. For this reason, we investigated the distinct roles of iron metabolism and inflammation triggered by Hamp and IL-6 in the onset of anemia. We used mice lacking either IL-6 or Hamp and injected them with BA to induce AI.
We showed that injection of BA in WT mice induced anemia characterized by a rapid onset followed by recovery in >6 weeks. BA-treated WT mice also exhibited features of iron-restricted erythropoiesis such as increased Hamp expression, low serum iron concentration and Tf saturation, and reduced reticulocyte count during the first week. Remarkably, IL-6-KO and Hamp-KO mice injected with BA developed a milder anemia and recovered more rapidly than WT mice. Both knockout mice showed a similar decreased number of RBCs as WT mice. Moreover, Hamp-KO mice showed the highest MCH, MCV, and CHr values, which indicated superior hemoglobinization of reticulocytes and RBCs. IL-6-KO mice were also protected by higher MCH, MCV, and CHr values compared with WT mice.
These data clearly showed that the lack of either IL-6 or Hamp is partially protective against BA-induced inflammation but also pointed to distinct roles for Hamp and IL-6 in the etiology of AI. For instance, IL-6-KO showed the best response with respect to the production of reticulocytes during the first week (Figure 2B-C). In agreement with this observation, flow cytometry analysis of the BM and spleen showed significant differences in the erythropoiesis of IL-6-KO and Hamp-KO mice. Although all mice had their marrow erythropoiesis suppressed 3 days after BA injection, only IL-6-KO animals at day 7 exhibited some significant level of recovery in the BM (Figure 4). Such data indicate that IL-6 interferes with erythropoiesis in the setting of AI, supporting the notion that cytokines could be targeted to improve the marrow erythropoiesis. Looking at Hamp-KO mice, administration of BA reduced the number of erythroid progenitor cells in the spleen, although not as dramatically as in the BM (supplemental Figure 1). Interestingly, only Hamp-KO mice exhibited the highest levels of erythropoiesis in the spleen at steady state. Investigation of stress erythropoiesis in phlebotomized WT mice injected with BA showed that spleen erythropoiesis was partially spared from the inflammatory insult. This suggests that Hamp-KO mice are likely protected from the anemia due to their ability to produce RBCs in the spleen shortly after BA administration, unlike WT and IL-6-KO mice. In addition, Hamp-KO mice showed the highest levels of hemoglobinization of RBCs and reticulocytes. Altogether these observations suggested that Hamp-KO mice were partially protected from BA-induced anemia by the combined effect of increased spleen erythropoiesis (supplemental Figure 1) and high Tf levels (Figure 1C), the latter parameter leading to increased MCH and Hb levels despite a relative low number of RBCs (Figure 2A-B,D).
Finally, we analyzed hemophagocytosis as the mechanism responsible for the reduction in the number of RBCs in the BA mouse model. Hemophagocytosis occurs as a result of blood-eating macrophages and has been described in many types of inflammatory conditions (eg, bacterial sepsis, influenza, malaria, leishmaniasis, and active rheumatologic disorders) as being responsible for the associated cytopenia.27 Our data support a role for hemophagocytosis in the reduction of RBCs in AI. In the companion paper, Kim et al35 show remarkably similar results. They discriminate features of both acute and chronic inflammation in their model and analogously observe the development of anemia, hypoferremia, and iron-restricted erythropoiesis, as well as shortened RBC lifespan and depressed erythropoiesis. Interestingly, they describe endothelial injury of small artery and vein and microthrombosis as a possible cause of microangiopathy and reduced RBC lifespan in BA-treated mice.
In conclusion, elucidation of the mechanisms by which Hamp, cytokines, and inflammatory molecules interfere with iron metabolism and erythropoiesis will contribute greatly to a better understanding of AI and support new hypotheses concerning the biology of this disorder. We believe that this will help both in the diagnosis and identification of new targets for therapeutic intervention.
The online version of this article contains a data supplement.
There is an Inside Blood commentary on this article in this issue.
The publication costs of this article were defrayed in part by page charge payment. Therefore, and solely to indicate this fact, this article is hereby marked “advertisement” in accordance with 18 USC section 1734.
Acknowledgments
The Hamp-KO mice were a gift from Sophie Vaulont (Institut National de la Santé et de la Recherche Médicale) and Tom Ganz (University of California, Los Angeles).
This work is supported by the Children’s Cancer and Blood Foundation; National Institutes of Health, National Institute of Diabetes and Digestive and Kidney Diseases grants NIDDK-1R01DK090554 and 5R01DK095112 (to S.R.); the Rubicon fellowship from the Netherlands Organization for Scientific Research (Rubicon 825.12.015) (to B.J.C.); and the National Institutes of Health, National Center for Complementary and Alternative Medicine grant F32AT007112 (to L.M.B.).
Authorship
Contribution: S.G. collected and analyzed the data, designed the experiments, and wrote the manuscript; T.M.R. and A.M. performed research and analyzed the data; C.C. maintained the mouse colony and helped with tissue harvesting; B.J.C. set up flow cytometry protocols and helped with related experiments; L.M.B. and N.G.-K. collaborated with animal work and reviewed the manuscript; B.J.S. and K.S.C. provided protocols and reviewed the manuscript; and S.R. designed the experiments and wrote the manuscript.
Conflict-of-interest disclosure: B.J.S. and K.S.C. are employees of Amgen. S.R. is a consultant for Exigo Management Consultant, Isis, Bayer AG, BioMarin, Merganser Biotech, and Novartis Pharmaceuticals. He also holds an equity/ownership interest in Merganser Biotech and is a co-inventor for patents US8058061 B2 C12N 20111115 and US7541179 B2 C12N 20090602. The remaining authors declare no competing financial interests.
Correspondence: Sara Gardenghi, Department of Pediatrics Hematology-Oncology, Children's and Cancer Blood Foundation Laboratories, Weill Cornell Medical College, 515 East, 71st St, Room S703, New York, NY 10021; e-mail: sag2010@med.cornell.edu.

