Key Points
Connective tissue growth factor regulates adipogenic differentiation of MSCs.
Connective tissue growth factor regulates leukemia engraftment.
Abstract
Mesenchymal stromal cells (MSCs) are a major component of the leukemia bone marrow (BM) microenvironment. Connective tissue growth factor (CTGF) is highly expressed in MSCs, but its role in the BM stroma is unknown. Therefore, we knocked down (KD) CTGF expression in human BM-derived MSCs by CTGF short hairpin RNA. CTGF KD MSCs exhibited fivefold lower proliferation compared with control MSCs and had markedly fewer S-phase cells. CTGF KD MSCs differentiated into adipocytes at a sixfold higher rate than controls in vitro and in vivo. To study the effect of CTGF on engraftment of leukemia cells into BM, an in vivo model of humanized extramedullary BM (EXM-BM) was developed in NOD/SCID/IL-2rgnull mice. Transplanted Nalm-6 or Molm-13 human leukemia cells engrafted at a threefold higher rate in adipocyte-rich CTGF KD MSC-derived EXM-BM than in control EXM-BM. Leptin was found to be highly expressed in CTGF KD EXM-BM and in BM samples of patients with acute myeloid and acute lymphoblastic leukemia, whereas it was not expressed in normal controls. Given the established role of the leptin receptor in leukemia cells, the data suggest an important role of CTGF in MSC differentiation into adipocytes and of leptin in homing and progression of leukemia.
Introduction
The bone marrow (BM) microenvironment consists of a variety of cell types, including osteoblasts, osteoclasts, endothelial cells, perivascular reticular cells, and mesenchymal stem or stromal cells (MSCs), all of which are critical for the regulation of hematopoietic stem cell maintenance and localization.1,2 In hematological malignancies, including leukemias, BM provides supporting niches for leukemia cell survival, proliferation, and differentiation.3,4 Although the mechanisms of leukemia cell homing to BM are not fully understood, recent evidence suggests that various cytokines and chemokines secreted by components of the tumor microenvironment facilitate this process.4-6 MSCs contribute to the leukemia BM microenvironment by attracting leukemia cells to their BM niche by producing factors such as angiopoietin-1 and CXCL12 (stroma-derived factor 1α [SDF-1α]), and attachment to stromal cells has been shown to activate survival signals in leukemia cells.1,3,6
MSCs are multipotent cells with self-renewal capacity.7 They express a panel of key markers, including CD105, CD73, CD44, and CD90, but not CD45.7,8 Although the true nature of MSCs remains enigmatic, CD146+ MSCs were recently reported to be self-renewing progenitors that reside on the sinusoidal surfaces and contribute to the organization of the sinusoidal wall structure.9 They can be isolated from various adult and fetal tissues, including BM, adipose tissue, umbilical cord blood, liver, human term placenta, and endometrium.10,11 MSCs differentiate into 3 major mesodermal lineages: osteoblasts, adipocytes, and chondrocytes.7,12
Connective tissue growth factor (CTGF, CCN2), a member of the CCN (CYR61, CTGF, NOV) family of proteins, regulates extracellular matrix production, chemotaxis, cell proliferation and differentiation, and integrin expression,13,14 but its role in the leukemia microenvironment has not been defined. Ctgf knockout mice die soon after birth as a result of respiratory failure caused by abnormal skeletal growth.15 CTGF expression is tightly regulated by transforming growth factor-β (TGF-β) in fibroblasts,16 and recent evidence suggests that recombinant CTGF induces differentiation of MSCs into fibroblasts and thereby inhibits their differentiation into osteoblasts, adipocytes, and chondrocytes.17 Treatment with recombinant CTGF inhibited adipocyte differentiation of the mouse stromal cell line 3T3-L1.18 Therefore, we studied the role of CTGF in differentiation of BM-derived MSCs and leukemia-stroma interactions.
Recent reports suggest that obesity could function as a negative factor in cancer progression and patient survival.19,20 We previously reported that leptin produced by adipocytes derived from MSCs counteracts leukemia cell death induced by chemotherapeutic agents.21 Coculture of acute myeloid leukemia (AML) cells with MSC-derived adipocytes prevented apoptosis after doxorubicin treatment by activating the signal transducer and activator of transcription 3 and mitogen-activated protein kinase signaling pathways.21 We also demonstrated that AML cells express higher levels of the leptin receptor (OB-R) and its isoforms (long and short) than normal cells and that leptin expression is correlated with body mass index of leukemia patients.22
Here we report on the role of CTGF on MSC function, including gene expression, cell proliferation, and differentiation. We also use a newly developed humanized extramedullary BM (EXM-BM) model23 in mice to investigate differentiation of MSCs in vivo and engraftment of leukemia cells into CTGF-modified EXM-BM. Finally, we investigated the underlying mechanism of leukemia cell engraftment in this model and identified CTGF as a gene that regulates MSC differentiation into adipocytes and enhances leukemia cell engraftment in adipocyte-rich EXM-BM by increased production of leptin.
Methods
Isolation and culture of primary murine and human MSCs and leukemia cells lines
Pups of Ctgf knockout or wild-type (WT) mice were collected immediately after birth. Stroma-rich body tissues, including liver, thymus, spleen, and BM, were surgically dissected and mechanically digested into single cells by vigorous pipetting in α-minimum essential medium containing 20% fetal bovine serum (Gibco BRL, Rockville, MD), l-glutamine, and penicillin–streptomycin (Flow Laboratories, Rockville, MD).
CTGF knockdown by lentiviral transduction
Lentiviral constructs expressing CTGF short hairpin RNA (shRNA) (Cat #RHS3979-962913) or empty vector (Cat #RHS4080) were purchased from Open Biosystems (Lafayette, CO). The green fluorescent protein (GFP) shRNA construct was prepared as described before24 and used as a nonspecific shRNA control. Lentiviral infections were carried out according to the standard procedures for silencing experiments.25
Cell proliferation and cell cycle analysis
Cells were fixed in ice-cold ethanol (70% vol/vol) and stained with propidium iodide (PI) solution (25 μg/mL PI, 180 U/mL RNase, 0.1% Triton X-100, and 30 mg/mL polyethylene glycol in 4 mM citrate buffer, pH 7.8; Sigma Chemical). The DNA content was determined by LSR-II flow cytometry (Becton Dickinson Immunocytometry Systems, San Jose, CA). Cell cycle distribution was analyzed by FlowJo software (Tree Star, Ashland, OR).
Flow cytometry
BM MSCs in which CTGF was stably knocked down (KD) or control cells were stained with fluorochrome-conjugated antibodies as described previously.26
Real-time reverse transcriptase-polymerase chain reaction
Total RNA was extracted using an RNeasy ion-exchange column (Qiagen, Valencia, CA) with on-column DNAse treatment as recommended by the manufacturer. The yield of purified RNA was determined by a spectrophotometer (NanoDrop 2000; Thermo Scientific, Wilmington, DE). cDNA was prepared from 1.0 μg of total RNA as described elsewhere.25
Gene expression profiling
Total RNA was extracted from 1 × 10⁶ control or CTGF KD MSCs using the RNAqueous kit (Ambion). After confirmation of RNA quality using a Bioanalyzer 2100 instrument (Agilent), 300 ng of total RNA was amplified and biotin-labeled through an Eberwine procedure using an Illumina TotalPrep RNA Amplification kit (Ambion) and hybridized to Illumina HT12 version 4 human whole-genome arrays (Illumina, San Diego, CA). Processing of bead-level data was by methods previously described.27
Multilineage differentiation
To identify osteoblast, adipocyte, and chondrocyte differentiation, MSCs expressing the empty vector or CTGF shRNA were cultured in NH OsteoDiff-, NH AdipoDiff-, or NH ChondroDiffmedium (Miltenyi Biotec, Auburn, CA) for 21, 28, and 21 days, respectively, as described previosuly.26
In vivo extramedullary bone formation
Extramedullary bone in mice was generated as described previously.23 Briefly, human BM-derived MSCs (1.5 × 10⁶) were mixed with the same number of human endothelial colony-forming cells in 0.2 mL Matrigel (Millipore) and then immediately injected subcutaneously into the flanks of NOD/SCID/IL-2rγnull mice. Both MSCs and endothelial colony-forming cells were obtained through a large-scale expansion method described by us, with low passages (1-3).28 Eight weeks after transplantation, bone formation was visualized by injecting the mice with OsteoSense 750. OsteoSense binding to bone was visualized using the Xenogen IVIS bioluminescence/fluorescence optical imaging system (Caliper Life Sciences, Hopkinton, MA).
Generation of the acute myeloid/lymphoid leukemia model
MOLM13 and Nalm6 cells were each infected with lentivirus expressing firefly luciferase and yellow fluorescent protein and maintained in RPMI-1640 medium containing 10% fetal bovine serum. Mice with extramedullary bones were injected intravenously with 2 × 10⁶ labeled Molm13 or Nalm6 cells suspended in100 µL of phosphate-buffered saline. Bioluminescence imaging was used to monitor the tumor burden.26
Animal study approval
NOD/SCID/IL-2rγnull mice were purchased from The Jackson Laboratory. All animal work was done in accordance with a protocol approved by the institutional animal care and use committee at The University of Texas MD Anderson Cancer Center.
Statistical analysis
Results are shown as the mean ± standard error of the mean from 5 independent experiments. The Student paired t test was used for statistical comparisons between groups. P < .05 was considered statistically significant. All experiments were conducted at least in triplicate.
Results
CTGF regulates MSC development and proliferation
MSCs are a key component of the leukemia microenvironment, supporting leukemia cell survival by cell-to-cell contact and via paracrine mechanism. Among several growth factors secreted by MSCs, CTGF plays an important role in the regulation of MSC function. mRNA expression analysis of CTGF and its family of proteins revealed that MSCs express high levels of CTGF and its family members including Cyr61, Nov, Wisp1, Wisp2, and LRP1 compared with leukemia cells (supplemental Figure 1 on the Blood website). Recent evidence suggests that recombinant CTGF induces differentiation of MSCs into fibroblasts and thereby inhibits their characteristic differentiation into osteoblasts, adipocytes, and chondrocytes.17 Here we hypothesized that genetic KD of CTGF, which regulates MSC proliferation and differentiation, would modulate leukemic cell homing to BM.
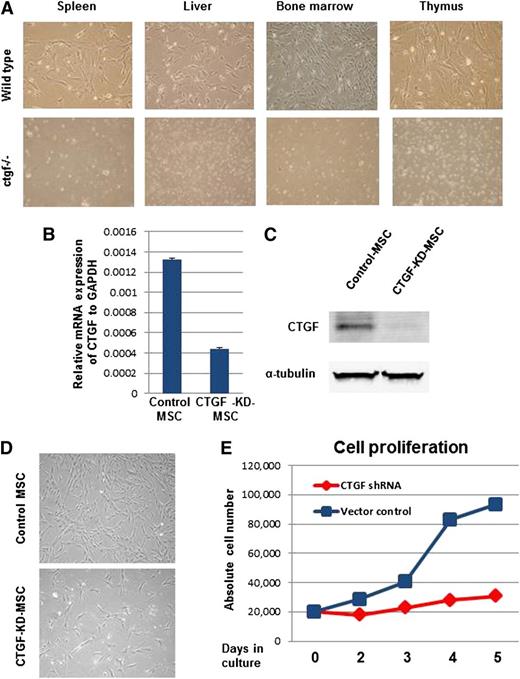
To test this hypothesis, we used the ctgf knockout mouse model developed by Ivkovic et al.15 These homozygous knockout mice die soon after birth. To generate MSCs, organs enriched for MSCs were dissected from both WT and homozygous knockout mice, and MSCs were isolated from these tissues. Suspensions of these MSCs were cultured in cell culture dishes. The Trypan blue dye exclusion method showed a >90% cell survival rate for all tissue types studied (data not shown). Interestingly, we were able to generate colony-forming unit fibroblast-like cells, which represent MSC colonies, only from tissues from WT animals and not from ctgf knockout mice (Figure 1A). To test whether the lack of ctgf knockout MSC colonies was due to their inability to adhere to plastic, the cell culture dishes were coated with 0.1% gelatin before plating the cell suspensions isolated from ctgf knockout pup tissues. Even after 2 weeks of culture, no colonies developed from ctgf knockout mouse tissue suspensions (data not shown), indicating a major disruption of MSC development in these mice.
KD of CTGF expression inhibits proliferation of MSCs isolated from BM. (A) CTGF knockout or control pups were killed, and their stroma-rich body organs, including liver, thymus, spleen, and BM, were surgically dissected. Cell suspensions of these organs were cultured in α-minimum essential medium containing 20% fetal bovine serum fibroblast-like colony-forming units and were observed 7 to 10 days after plating in controls but not in CTGF knockout cells. (B) Normal MSCs derived from human BM were transduced with a lentivirus expressing CTGF shRNA. Data represent relative expression of CTGF to GAPDH in control and CTGF KD MSCs. (C) CTGF protein expression was analyzed in cell lysates from control and CTGF KD MSCs by western blotting with anti-CTGF antibody. α-Tubulin served as a loading control. (D) Morphology of control and CTGF KD MSCs. (E) Cell proliferation was analyzed by counting absolute cell numbers with a Vi-Cell XR cell counter. Control or CTGF KD MSCs (2 × 10⁴) were cultured in 6-well dishes in triplicate and counted on days 2, 3, 4, and 5.
KD of CTGF expression inhibits proliferation of MSCs isolated from BM. (A) CTGF knockout or control pups were killed, and their stroma-rich body organs, including liver, thymus, spleen, and BM, were surgically dissected. Cell suspensions of these organs were cultured in α-minimum essential medium containing 20% fetal bovine serum fibroblast-like colony-forming units and were observed 7 to 10 days after plating in controls but not in CTGF knockout cells. (B) Normal MSCs derived from human BM were transduced with a lentivirus expressing CTGF shRNA. Data represent relative expression of CTGF to GAPDH in control and CTGF KD MSCs. (C) CTGF protein expression was analyzed in cell lysates from control and CTGF KD MSCs by western blotting with anti-CTGF antibody. α-Tubulin served as a loading control. (D) Morphology of control and CTGF KD MSCs. (E) Cell proliferation was analyzed by counting absolute cell numbers with a Vi-Cell XR cell counter. Control or CTGF KD MSCs (2 × 10⁴) were cultured in 6-well dishes in triplicate and counted on days 2, 3, 4, and 5.
As an alternative source of ctgf knockout MSCs, we stably KD CTGF in human MSCs by transducing the cells with a lentivirus expressing CTGF shRNA. mRNA expression analysis of CTGF revealed a reduction of 70 ± 5% compared with cells transduced with empty vector (Figure 1B). Protein expression analysis indicated that CTGF expression was down-regulated by >90% in cells transduced with CTGF shRNA, suggesting that CTGF expression was successfully inhibited in these cells (Figure 1C). Although no major changes in cell morphology, adhesion, or spontaneous cell death were observed between control and CTGF KD MSCs (Figure 1D), we did observe that CTGF KD MSCs’ growth was inhibited fivefold compared with control MSCs, suggesting that CTGF has a major role in cell proliferation (Figure 1E).
CTGF regulates cell cycle in MSCs
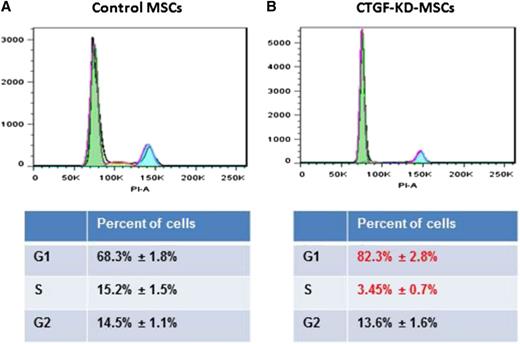
Because of the major decrease in cell growth in CTGF KD MSCs, we analyzed cell cycle progression using PI staining. CTGF KD MSCs displayed a significant decrease in the number of cells in S phase (from 14.7 ± 0.8% to 3.5 ± 0.4%) and a concomitant increase in the number of G0/1 cells (from 68.8 ± 1.8% to 82.4 ± 1.3%; Figure 2A). To investigate whether CTGF also affects expression of MSC surface proteins, we analyzed standard MSC markers, including CD105, CD90, CD73, CD44, CD140b, CD166, and CD45 (as a negative marker). Surprisingly, expression of these markers in CTGF KD MSCs and control MSCs did not differ significantly (supplemental Figure 2).
KD of CTGF inhibits cell cycle of MSCs. (A) Control or (B) CTGF KD MSCs (1 × 10⁶) were stained with PI. The cells were analyzed on an LSR-II flow cytometer. An accumulation of cell cycle in G0/G1 phase was observed in CTGF KD MSCs. The data were analyzed on FlowJo software.
KD of CTGF inhibits cell cycle of MSCs. (A) Control or (B) CTGF KD MSCs (1 × 10⁶) were stained with PI. The cells were analyzed on an LSR-II flow cytometer. An accumulation of cell cycle in G0/G1 phase was observed in CTGF KD MSCs. The data were analyzed on FlowJo software.
Cell cycle–related genes are down-regulated in CTGF KD MSCs
To investigate gene expression, we used microarray analysis using Illumina arrays (GEO accession no. GSE47575). Gene set enrichment analysis suggested that genes involved in cell cycle progression (supplemental Figure 3A), especially genes related to the M phase of the cell cycle (supplemental Figure 3B), were down-regulated in CTGF KD MSCs compared with control MSCs. Differentially expressed probes (DEPs) were determined using a Student t test and a false discovery rate–q statistic <0.1, with no fold change threshold. We imposed an arbitrary fold change threshold of 2, in which case 302 of 383 DEPs were higher and 261 of 272 DEPs were lower in CTGF KD MSCs (independent experiments 1 and 2, respectively). The top 20 Gene Ontology biological process categories most significantly enriched by the hypergeometric distribution test among genes down-regulated in CTGF KD MSCs are listed in supplemental Table 1. Cell proliferation–related genes such as CDC2, CDC20, HMGA2, and PRMT were down-regulated in CTGF KD MSCs compared with control MSCs (n = 2; supplemental Figure 3C), suggesting that CTGF-mediated signaling regulates the expression of a multitude of cell cycle–related genes (supplemental Table 2 lists cell proliferation related genes down-regulated in CTGF KD MSCs).
CTGF-KD-MSCs are primed to differentiate into adipocytes.
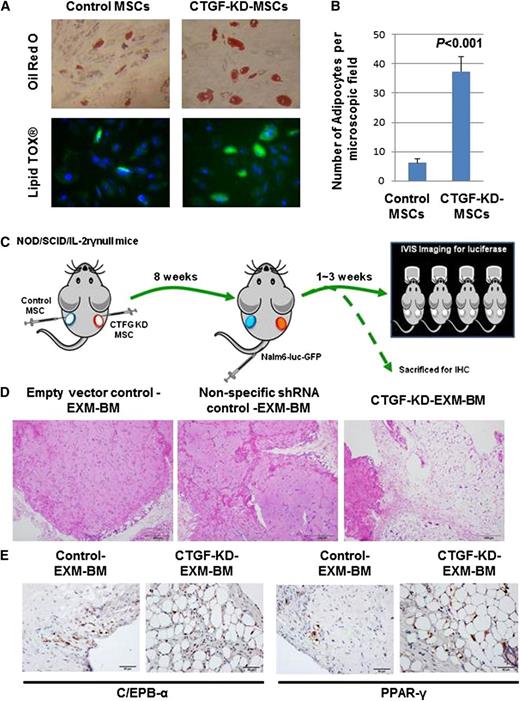
MSCs are known to differentiate into 3 mesodermal lineages: osteoblasts, adipocytes, and chondrocytes. To test the differentiation potential of CTGF KD MSCs, cells were cultured in 3 different media designed to promote differentiation to osteoblasts, adipocytes, or chondrocytes. Staining by alkaline phosphatase and Alizarin red S revealed that both control and CTGF KD MSCs displayed equal potential to differentiate into osteoblasts (supplemental Figure 4A). Similarly, Alcian blue staining revealed that controls and CTGF KD MSCs displayed equal potential to differentiate into chondrocytes (supplemental Figure 4B). Interestingly, however, CTGF KD MSCs differentiated into mature adipocytes at a sixfold higher rate than control cells, as revealed by Oil Red O staining, indicating that KD of CTGF primed MSCs to undergo adipocyte differentiation (Figure 3A-B; supplemental Figure 5).
CTGF KD MSCs differentiate into adipocytes in vitro and in vivo. (A) To examine the differentiation potential of control or CTGF KD MSCs, cells (5 × 10⁴) were cultured in adipocyte differentiation medium for 28 days. After incubation, the cells were stained by Oil Red O dye or LipidTox fluorescent dye to observe adipocyte differentiation. (B) Quantitative representation of data showed in supplemental Figure 4. (C) To examine the differentiation potential of CTGF KD MSCs in vivo, a model of EXM-BM was developed by injecting human MSCs (1.5 × 10⁶) mixed with human endothelial progenitor cells (1.5 × 10⁶) in 0.2 mL Matrigel subcutaneously into the flanks of NOD/SCID/IL-2rγnull mice. Control cells (empty vector and nonspecific shRNA controls) were transplanted on the left, and CTGF KD MSCs were transplanted on the right. (D) Eight weeks after transplantation, the bone pellets were dissected and fixed in 4% paraformaldehyde. Tissue sections were then stained with hematoxylin and eosin to observe tissue architecture. Scale bar represents 200 μm. (E) To investigate adipocyte differentiation, immunohistochemical analysis was performed on EXM-BM using a PPARγ or cEBPα antibody.
CTGF KD MSCs differentiate into adipocytes in vitro and in vivo. (A) To examine the differentiation potential of control or CTGF KD MSCs, cells (5 × 10⁴) were cultured in adipocyte differentiation medium for 28 days. After incubation, the cells were stained by Oil Red O dye or LipidTox fluorescent dye to observe adipocyte differentiation. (B) Quantitative representation of data showed in supplemental Figure 4. (C) To examine the differentiation potential of CTGF KD MSCs in vivo, a model of EXM-BM was developed by injecting human MSCs (1.5 × 10⁶) mixed with human endothelial progenitor cells (1.5 × 10⁶) in 0.2 mL Matrigel subcutaneously into the flanks of NOD/SCID/IL-2rγnull mice. Control cells (empty vector and nonspecific shRNA controls) were transplanted on the left, and CTGF KD MSCs were transplanted on the right. (D) Eight weeks after transplantation, the bone pellets were dissected and fixed in 4% paraformaldehyde. Tissue sections were then stained with hematoxylin and eosin to observe tissue architecture. Scale bar represents 200 μm. (E) To investigate adipocyte differentiation, immunohistochemical analysis was performed on EXM-BM using a PPARγ or cEBPα antibody.
CTGF KD MSCs differentiate into adipocytes in a humanized extramedullary BM model in vivo
To test the differentiation potential of CTGF KD MSCs in vivo, we used the EXM-BM model developed by our group.29 This model is represented schematically in Figure 5A. Briefly, MSC transduced with lentivirus expressing CTGF shRNA or nonspecific shRNA (GFP) or empty vector (EV) together with endothelial progenitor cells and Matrigel were transplanted subcutaneously into NOD/SCID/IL-2rγnull mice to generate extramedullary bone (Figure 3C). Eight weeks later, hematoxylin and eosin staining of EXM-BM sections revealed more cortical bone formation in control (EV and nonspecific) EXM-BM, whereas CTGF KD MSCs generated a completely different morphology comprised of less cortical bone and more adipose-like tissue (Figure 3D). As there was no significant difference between EV and nonspecific shRNA transduction controls (Figure 3D), we chose to use EV as control for the following experiments. To analyze the bone differentiation, the mice were injected with OsteoSense, which binds to newly formed bone and can be detected by fluorescence imaging. As expected, EXM-BM derived from control MSCs displayed bright fluorescence, indicating new bone formation. In contrast, EXM-BM derived from CTGF KD MSCs showed only weak fluorescence (supplemental Figure 6), suggesting that these cells differentiate poorly into the osteoblast lineage in vivo. This morphology of CTGF KD MSC–derived bones resembles the reported bone morphology of CTGF-deficient mice.15
To confirm morphological evidence of adipocyte differentiation of these cells, the sections were immunostained with adipocyte differentiation markers, including peroxisome proliferator-activated receptor (PPAR)γ and CCAAT-enhancer-binding protein (cEBP)α. We observed strong positive staining for these markers in the nuclear region of large cells, suggesting differentiation of CTGF KD MSCs into adipocytes in vivo (n = 4; Figure 3E). In contrast, PPARγ and cEBPα expression was significantly down-regulated in control cells (Figure 3E). No positive staining was observed in the stromal/endothelial compartment of CTGF KD MSC–derived EXM-BM or control EXM-BM. These findings suggest that inhibition of CTGF expression in MSCs is sufficient to induce adipocyte differentiation in vivo.
Leukemia cells specifically engraft into CTGF KD MSC–derived EXM-BM
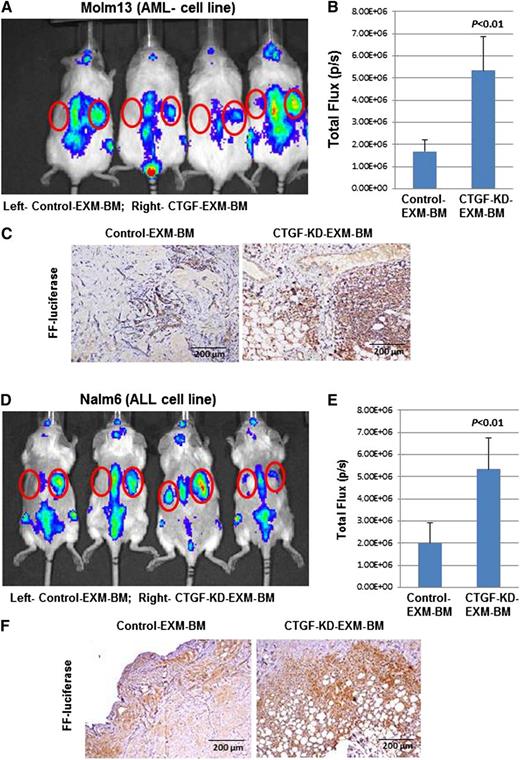
MSCs secrete several factors, including SDF-1α, which promotes leukemia cell homing to BM. Therefore, we tested engraftment of leukemia cells into EXM-BM derived from control MSCs or CTGF KD MSCs. Molm13 AML cells (Figure 4A-C) and Nalm6 ALL cells (Figure 4D-F) stably expressing the firefly luciferase gene were transplanted into NOD/SCID/IL-2rγnull mice harboring EXM-BM derived from control MSCs (left side) or CTGF KD MSCs (right side, n = 4). Two weeks later, the mice were imaged for leukemia engraftment in EXM-BM. Although there was identical engraftment in the sites of murine BM (spine), there were significantly higher luminescence signals in CTGF KD EXM-BM than in control EXM-BM, indicating preferential leukemia engraftment (Figure 4A,B,D,E) in CTGF KD bones. To confirm the engraftment of leukemia cells, sections derived from EXM-BM were stained with antibody against firefly luciferase and showed significantly higher numbers of luciferase-expressing cells in CTGF KD EXM-BM than in controls (n = 4; Figure 4C,F; P < .001). These findings suggested that CTGF KD EXM-BM favors leukemia cell engraftment.
Leukemia cells specifically engraft into EXM-BM derived from CTGF KD MSCs. To investigate leukemia engraftment in EXM-BM derived from (left) control or (right) CTGF KD MSCs, the corresponding cells, in combination with endothelial progenitor cells and Matrigel, were transplanted subcutaneously into NOD/SCID/IL-2rγnull mice. Eight weeks later, (A-C) Molm13 or (D-F) Nalm6 cells (2 × 10⁶) stably expressing firefly (FF) luciferase were transplanted intravenously into the mice harboring EXM-BM. (A,D) Two weeks after transplantation, the mice were imaged via the IVIS bioluminescence imager after injection of the luciferase substrate. The signal intensities were measured by the IVIS live imaging software package. (B,E) As an alternative, bone pellets were dissected and fixed in 4% paraformaldehyde, and the tissue sections were stained for immunohistochemical analysis with the anti-FF luciferase antibody. (C,F) The brown color indicates positive luciferase staining.
Leukemia cells specifically engraft into EXM-BM derived from CTGF KD MSCs. To investigate leukemia engraftment in EXM-BM derived from (left) control or (right) CTGF KD MSCs, the corresponding cells, in combination with endothelial progenitor cells and Matrigel, were transplanted subcutaneously into NOD/SCID/IL-2rγnull mice. Eight weeks later, (A-C) Molm13 or (D-F) Nalm6 cells (2 × 10⁶) stably expressing firefly (FF) luciferase were transplanted intravenously into the mice harboring EXM-BM. (A,D) Two weeks after transplantation, the mice were imaged via the IVIS bioluminescence imager after injection of the luciferase substrate. The signal intensities were measured by the IVIS live imaging software package. (B,E) As an alternative, bone pellets were dissected and fixed in 4% paraformaldehyde, and the tissue sections were stained for immunohistochemical analysis with the anti-FF luciferase antibody. (C,F) The brown color indicates positive luciferase staining.
Higher levels of SDF1α and adipocyte growth factor leptin may favor leukemia cell engraftment in CTGF KD MSC–derived EXM-BM
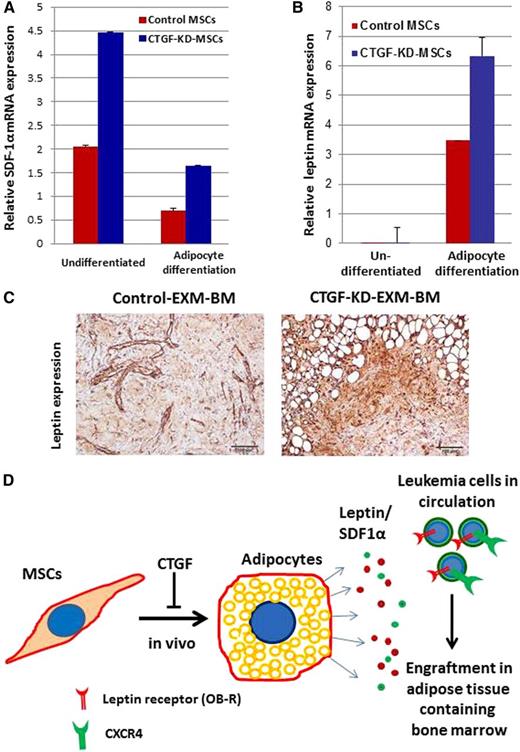
To understand the mechanisms behind leukemia homing, CTGF KD and control MSCs were tested for mRNA expression of SDF-1α and leptin before and after adipocyte differentiation. Interestingly, KD of CTGF induced SDF1α mRNA expression by approximately twofold in MSCs before and after adipocyte differentiation compared with control MSCs (Figure 5A-B). In addition, leptin mRNA expression was >100-fold higher after adipocyte differentiation of CTGF KD MSCs compared with undifferentiated cells (Figure 5B). Immunohistochemical analysis of extramedullary BM niches revealed that expression of leptin was significantly higher in CTGF KD MSC–derived EXM-BM than in control EXM-BM (Figure 5C). These findings suggest that KD of CTGF in MSCs facilitated adipocyte differentiation in vivo, resulting in increased expression of leptin growth factor (Figure 5D). Consequently, leukemia cells that express CXCR4 and leptin receptor (OB-R) engrafted into BM niches rich in SDF-1 and leptin (Figure 5D).
Adipocyte growth factor leptin may be involved in leukemia cell engraftment in EXM-BM derived from CTGF KD MSCs. (A-B) mRNA was isolated from control and CTGF KD MSCs before and after differentiation into adipocytes, and expression of (A) SDF1α and (B) leptin was analyzed by quantitative reverse transcriptase-polymerase chain reaction. (C) Immunohistochemical analysis was performed on EXM-BM generated by control or CTGF KD MSCs. The sections were stained with antileptin antibody and later developed with diaminobenzidine. (D) Schematic representation of a possible mechanism behind leukemia engraftment into CTGF KD EXM-BM.
Adipocyte growth factor leptin may be involved in leukemia cell engraftment in EXM-BM derived from CTGF KD MSCs. (A-B) mRNA was isolated from control and CTGF KD MSCs before and after differentiation into adipocytes, and expression of (A) SDF1α and (B) leptin was analyzed by quantitative reverse transcriptase-polymerase chain reaction. (C) Immunohistochemical analysis was performed on EXM-BM generated by control or CTGF KD MSCs. The sections were stained with antileptin antibody and later developed with diaminobenzidine. (D) Schematic representation of a possible mechanism behind leukemia engraftment into CTGF KD EXM-BM.
Human AML and ALL BM cells express significantly higher leptin levels compared with normal BM
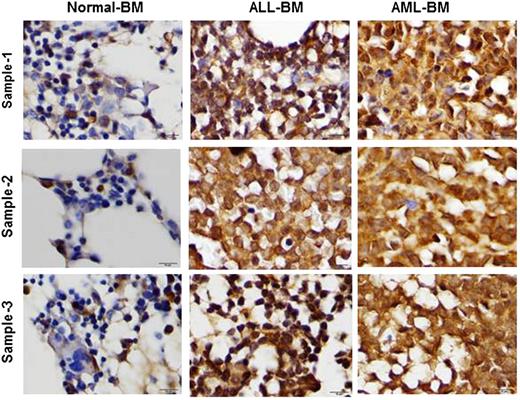
To investigate leptin expression in human BM, we examined leptin expression by immunohistochemistry. The selected cases included 3 normal BM specimens (these samples were obtained from adult patients with breast cancer as a part of staging procedure and did not show any metastatic involvement), 5 adult patients with AML, and 5 adult patients with B-cell acute lymphocytic leukemia (B-ALL). Leptin expression was detected in all AML and all ALL cases. Leptin was strongly expressed in all AML cases and in 4 of 5 ALL cases; 1 ALL case showed a moderate expression of leptin (Figure 6). In contrast, all 3 normal BM specimens were negative for leptin, showing only moderate leptin expression in ∼5% to 10% of all hematopoietic cells (Figure 6). These findings indicate that leptin is highly expressed in human AML and ALL BMs and may facilitate expansion of the leukemia clone.
Leptin is highly expressed in AML and ALL BM. To analyze leptin expression on leukemia BM, paraffin-embedded BM biopsy specimens were formalin fixed and formic acid decalcified. Leptin expression was assessed using a rabbit anti-human leptin polyclonal antibody (Cone Ab16227) by immunohistochemistry.
Leptin is highly expressed in AML and ALL BM. To analyze leptin expression on leukemia BM, paraffin-embedded BM biopsy specimens were formalin fixed and formic acid decalcified. Leptin expression was assessed using a rabbit anti-human leptin polyclonal antibody (Cone Ab16227) by immunohistochemistry.
Recent findings suggest that acute leukemia cells express higher CTGF levels compared with their normal counterparts.30 Therefore, to test the paracrine effect of CTGF, MSCs derived from BMs of leukemia patients and normal donors were compared for their ability to differentiate into adipocytes. Leukemia BM-derived MSCs generated 15- to 18-fold fewer adipocytes compared with normal BM-derived MSCs (supplemental Figure 7), once again indicating the regulatory role of CTGF in MSC differentiation into adipocytes.
Discussion
In this report, we show that CTGF knockout mice were not able to generate MSCs in vitro and that KD of CTGF by stable shRNA expression inhibited MSC proliferation. The CTGF KD MSC cell cycle was inhibited at the G0/G1 phase. Knockdown of CTGF induced adipocyte differentiation in vitro and in vivo. In the humanized extramedullary BM model, CTGF KD MSCs generated less cortical bone but more adipose-like tissue than controls. Positive staining for adipocyte-specific markers, including PPARγ and cEBPα, indicated adipocyte differentiation of CTGF KD MSCs in EXM-BM. When transplanted, luciferase-labeled leukemia cells engrafted preferentially into CTGF KD MSC–derived EXM-BM. Analysis of the mechanisms behind this engraftment revealed higher leptin expression in CTGF KD MSCs than in control MSCs.
CTGF (CCN2) belongs to the CCN family of proteins and is involved in embryonic development and extracellular matrix production. CTGF knockout mice die soon after birth of respiratory failure due to abnormal skeletal growth. In our attempt to isolate MSCs from CTGF knockout mice, none of the stroma-rich organs, including liver, spleen, thymus, or BM, gave rise to MSCs in our in vitro cultures. In addition, gene expression data indicate that genes involved in cell proliferation are down-regulated in CTGF KD MSCs, suggesting that CTGF is an important factor during MSC development. Other members of the CCN family, including cysteine-rich protein 61 (CCN1) and neuroblastoma-overexpressing protein (CCN3), were also highly expressed in the MSC compartment (supplemental Figure 1), suggesting a role in MSC biology. CCN3 expression was shown to regulate differentiation of early myeloid cells into more committed progenitors, whereby CCN3 levels increase with myeloid cell commitment and loss of “stemness.”31 In MSCs, CCN3 promotes differentiation into chondrocytes,32 suggesting that CCN family members regulate differentiation of stem or progenitor cells.
The expression of CTGF is regulated mainly by TGF-β.33 Recent reports suggest that overexpression of constitutively active TGF-β receptor-1 induces CTGF expression in fibroblasts and postnatally recapitulates major clinical, biochemical, and histologic features of fibrotic pathology in the skin and small blood vessels.33 Selective overexpression of CTGF in fibroblasts promotes systemic fibrosis in vivo, suggesting that both TGF-β and CTGF may have important roles in a sustained chronic fibrotic outcome.34 CTGF expression is also known to be elevated in certain types of cancers. In colon cancer, high CTGF expression confers poor prognosis and is associated with inferior survival.35 Moreover, overexpression of CTGF was observed in B-cell ALL and correlated with poor prognosis and survival.30,36 AML BM-derived MSCs demonstrate reduced ability to differentiate into adipocytes. This may be due to CTGF overexpression in leukemia cells. Therefore, CTGF may act on MSCs in a paracrine fashion and inhibit their ability to differentiate into adipocytes. These reports suggest that autocrine CTGF production induces cancer growth and that targeting this growth factor might be useful in therapy of several cancer types. In most cancer types, including solid tumors and leukemias, impaired differentiation of the cancer cell is a key defect. Our data suggest that KD of CTGF in MSCs not only inhibits cell proliferation but also induces differentiation in vivo. These findings suggest that inhibition of CTGF could decrease cancer cell proliferation and induce differentiation.
Our finding of high CTGF production by BM MSCs prompted us to investigate the role of paracrine MSC-secreted CTGF in leukemia homing and survival. Surprisingly, KD of CTGF in MSCs resulted in consistently higher leukemia cell engraftment in our humanized extramedullary bone model. The composition of this extramedullary environment was strikingly different in that it displayed features of fat-abundant BM. We have further confirmed that CTGF KD results in adipogenic differentiation of MSCs in this BM. Adipose tissue content and factors secreted by adipocytes including leptin and SDF-1α may result in higher leukemia engraftment into CTGF KD EXM-BM compared with control EXM-BM. The facts that leukemia frequency is increased in older individuals37 and adipose content of BM increases with age38,39 suggest that factors associated with adipocytes including leptin and SDF-1α could play an important role in leukemogenesis and actively promote leukemia progression. Leptin overexpression in AML and ALL BM also supports the notion of increased adipose tissue content in leukemic BM. We have previously shown that the leptin receptor (OB-R) is overexpressed in leukemia cells, which supports engraftment of leukemia cells to adipocyte-rich BM. Although not tested in this study, increased adipocyte content of BM and age are likely associated with overall obesity.19,20 In a recent report, rate of relapse after monotherapy with vincristine was higher in obese mice than in mice of normal weight injected with syngeneic ALL cells.40 Coculture of the leukemia cells with 3T3-L1 adipocytes significantly impaired the antileukemia efficacy of vincristine and of 3 other chemotherapeutic agents.40 Interestingly, this protection was independent of cell-cell contact, and it extended to human leukemia cell lines as well. In another report, diet-induced obesity accelerated ALL progression in 2 murine models.41 Obesity is known to associate with increased risk for numerous types of cancers in adults.42 Moreover, obese cancer patients have poorer outcomes than their leaner counterparts.43
It has been demonstrated that growth factors, including leptin, insulin, and interleukin-6, are highly expressed in the serum of obese compared with lean mice.41 In another report, leptin was shown to revert the proapoptotic and antiproliferative effects of α-linoleic acids in breakpoint cluster region-abelson–positive leukemic cells, suggesting a role for the phosphatidylinositide 3-kinase pathway in this process.44 In this report, we demonstrated leptin overexpression in AML and ALL BM. We have previously shown that the adipocyte growth factor leptin is essential for leukemia growth21,22 and that blocking the leptin receptor could help prevent leukemia growth.21 Our findings suggest that CTGF regulates MSC differentiation into adipocytes that in turn produce leptin in BM and promote leukemia cell engraftment and growth within BM niches. Therefore, leptin could be one of the key mediators of leukemia progression within the adipocyte-enriched BM microenvironment and targeted therapy against leptin may interfere with leukemia progression.
Taken together, findings reported here suggest a previously unrecognized role of BM adipogenesis in leukemia progression. Our data indicate that CTGF is a key negative regulator of adipocytic differentiation of BM-derived MSCs. Hence, targeting CTGF in hematologic malignancies should be considered with caution and possibly be directed at diseases with high pathologic fibrotic stromal component, such as myeloproliferative disorders. Furthermore, future strategies targeting leptin-producing adipocytes may prove beneficial in generating a BM microenvironment inhospitable for leukemic cells. Although adipocytes are not readily detectable at the stage of full leukemia-infiltrating marrow, they may play an important role in the setting of aplastic anemias or hypoplastic myelodysplastic syndromes, nurturing preleukemic malignant clones and hence facilitating leukemia development. Future studies aimed at characterization of the adipocyte component of the preleukemic BM microenvironment are warranted.
The online version of this article contains a data supplement.
The publication costs of this article were defrayed in part by page charge payment. Therefore, and solely to indicate this fact, this article is hereby marked “advertisement” in accordance with 18 USC section 1734.
Acknowledgments
The authors thank Dr Juliana Benito, Dr Peter Ruvolo, and Dr Rodrigo Jacamo for invaluable help and discussion and Teresa McQueen for technical assistance. We also thank Dr Shonali Majumdar, Kathryn Hale, and Dr Numsen Hail Jr for critical review of the manuscript.
This work was supported in part by the National Institutes of Health/National Cancer Institute grants CA044164, CA016672, CA100632, R01 FD003733, R21 CA143805, CA049639, and CA153019 (to M.A.).
Authorship
Contribution: V.L.B. performed experiments, analyzed data, wrote the paper, and conceived the study; Y.C., M.d.G.C., Z.W., V.R., S.K., and W.M. performed experiments; E.S., K.L., and D.S. designed research and provided reagents; C.B.-R. and R.E.D. designed research, performed experiments, and analyzed data; M.K. designed research, analyzed data, wrote the paper, and conceived the study; and M.A. designed research, analyzed data, wrote the paper, conceived the study, and provided final approval of the manuscript.
Conflict-of-interest disclosure: The authors declare no competing financial interests.
Correspondence: Michael Andreeff, The University of Texas MD Anderson Cancer Center, 1515 Holcombe Blvd, Unit 448, Houston, TX 77030; e-mail: mandreef@mdanderson.org.

This feature is available to Subscribers Only
Sign In or Create an Account Close Modal