Abstract
STAT3 regulates cell growth by up-regulating downstream targets, such as Myc. The frequency of phosphorylated STAT3 (pSTAT3) and Myc expression and their prognostic relevance is unknown within diffuse large B-cell lymphoma (DLBCL) germinal center B-cell (GCB) and non-GCB subtypes. pSTAT3 and Myc were studied by immunohistochemistry (IHC) on tumors from 40 DLBCL patients uniformly treated on a clinical trial of epratuzumab/rituximab-CHOP. A total of 35% of cases were pSTAT3-positive, and pSTAT3 positivity was more frequent in the non-GCB (P = .06) type but did not correlate with event-free survival (EFS). Myc expression was observed in 50% of cases and was more frequent in non-GCB type (P = .07). Myc-positive cases had inferior EFS in all patients, including the GCB and pSTAT3-positive cases, were more likely to express Myc (P = .06). Myc translocations involving the major breakpoint regions were found in 10% (3 of 29) of cases, and all 3 cases were GCB and had an inferior EFS (P = .09). pSTAT3, but not Myc expression, was correlated with elevated pretreatment serum cytokines, such as IL-10 (P = .05), G-CSF (P = .03), and TNF-α (P = .04). pSTAT3 IHC in DLBCL tumors has the potential to identify patients for STAT3 pathway–directed therapy; Myc IHC is a potential marker for inferior EFS in GCB patients.
Introduction
The most significant advance in the treatment of diffuse large B-cell lymphoma (DLBCL) over the past 15 years has been the addition of rituximab to standard CHOP chemotherapy (R-CHOP).1-3 We recently demonstrated in a phase 2 study (N0489; www.clinicaltrials.gov, #NCT00301821) that the anti-CD22 monoclonal antibody epratuzumab can be successfully added to R-CHOP (ER-CHOP) without additional toxicity and with potentially improved survival parameters.4 Despite these advances, 30%-40% of patients still relapse and die of disease. Current pathology practice classifies DLBCL into at least 3 distinct subtypes: germinal center B cell–like (GCB), activated B cell-like (ABC), and primary mediastinal B-cell lymphoma by gene expression profiling or immunohistochemistry (IHC).5,6 These classifications are being evaluated in new DLBCL trials, and there have been some reports suggesting that agents, such as bortezomib and lenalidomide, are more effective in non-GCB type DLBCL.7,8 To improve outcomes for DLBCL patients, it is necessary to identify additional novel targets within GCB and non-GCB classifications to further stratify patients for prognosis and assist in choosing therapy for the individual patient.
Signal transducer and activator of transcription 3 (STAT3) is a latent cytoplasmic transcription factor that resides in the cytoplasm.9 Phosphorylation of STAT3 (pSTAT3) at its Tyr-705 residue (pSTAT3Tyr705) leads to activation and translocation to the nucleus where pSTAT3 regulates several target genes, such as MYC.10,11 Constitutively active STATs (particularly STAT3 and STAT5) contribute to the malignant phenotype in both human cancer cell lines and primary tumors.12,13 Recently, it has been reported that STAT3 is overexpressed in ABC-type DLBCL human cell lines.14,15 The role of pSTAT3 as a prognostic factor in DLBCL patients treated with R-CHOP–based therapies is unknown.
Translocations involving the MYC gene at 8q24 are associated with Burkitt lymphoma.16 Moreover, MYC translocations have been reported to occur in DLBCL with a frequency of 5%-10%.17-19 Myc protein can be expressed in DLBCL cells without the presence of a MYC translocation. The frequency of Myc protein as detected by IHC on paraffin-embedded DLBCL is not known, nor is the relationship of Myc tumor cell expression to outcome. This study explores the tumor cell expression of pSTAT3 and Myc as detected by IHC paired with serum cytokine levels in a DLBCL patient population uniformly treated on a recently reported phase 2 clinical trial.20
Methods
Patients and biopsies
Paraffin-embedded tumors from 40 patients participating in N0489 were used.4 Tissue microarrays were constructed using triplicate 0.6-mm cores from paraffin-embedded tissue blocks and included 10 nonmalignant tonsil controls. In some cases, only unstained slides were available. This resulted in not all studies being performed on all 40 cases. For Western blotting studies, frozen DLBCL tumor cells (n = 7) and normal tonsils (n = 10) were obtained through the University of Iowa/Mayo Lymphoma SPORE Biospecimens Core. Normal B cells were isolated using CD19 microbeads (Miltenyi Biotec) from peripheral blood mononuclear cells. All patients who participated in the clinical trial or the SPORE Biobank provided written informed consent for use of their samples and review of their medical record.
DLBCL molecular subtyping
DLBCL cases (n = 38) were classified into GCB or non-GCB molecular type based on the Hans algorithm applied to paraffin-embedded tumor samples.20
IHC for pSTAT3/tSTAT3 and Myc expression
The tissue microarray from DLBCL tumors was stained with antibodies to Myc, tSTAT3, or pSTAT3. Paraffin-embedded sections from the human DLBCL cell lines DHL2 and DHL6 were used to validate the pSTAT3 stain. Furthermore, paraffin-embedded sections from DHL2, Ly3, Ly10, Ly1, Ly19, and DHL6 were used to validate Myc stain. IgG antibody was used as a negative control for pSTAT3 and Myc IHC staining. Briefly, slides were dried, deparaffinized, and endogenous peroxidase activity was quenched by incubation of sections in a 50%/50% solution of 3% hydrogen peroxide and absolute methanol. Antigen retrieval was performed in a steamer for 30 minutes using 1mM EDTA and pH 8.0 for Myc and citrate at pH 6.1 for pSTAT3 (Cell Signaling Technologies; 9145). The slides were placed on a DakoCytomation autostainer with the following autostainer protocol: antibodies to pSTAT3 or tSTAT3 (Cell Signaling Technologies) or Myc (Epitomics; 1472-1); Dako advance detection system, and substrate. The slides were removed from the autostainer, rinsed, and counterstained with hematoxylin. The slides were reviewed and scored by the study hematopathologist (A.D.) without knowledge of patient outcome. The expression of Myc and pSTAT3 was assessed semiquantitatively as follows; negative < 10%, 10%-30% (+, low), 30%-80% (++, intermediate), and > 80% (+++, high). A 30% cut off was chosen for pSTAT3 and Myc positivity based on this cut-point being commonly used in clinical practice and in studies such as Hans et al.20
Western blotting for pSTAT3 and tSTAT3
A total of 5 × 10⁶ cells from tumor cells were washed, lysed in RIPA buffer, and blotted with tyrosine-phosphorylated and unphosphorylated STAT3 antibody (Cell Signaling Technologies; 9138 and 9139). Lysates from DHL2, Ly3, Ly10, Ly1, Ly19, and DHL6 cell lines were blotted with Myc specific antibody (Cell Signaling Technologies; 9402). Levels of pSTAT3/t STAT3 and Myc were measured by immunoblotting as previously described.21 For cytokine experiments, DHL2 cell line was serum-starved overnight with 0.5% BSA and then treated with 50 ng/mL of IL-10 or G-CSF or TNF-α (PeproTech). Cells were then collected and lysates were subjected to Western blot analysis for pSTAT3.
FISH for MYC translocations
Serum cytokine analysis
Multiplex ELISA (30-plex) was performed as previously described24 on available pretreatment patient serum (n = 32) and correlated with Myc and pSTAT3 results from paired tumor biopsies.
Statistical analysis
Event-free survival (EFS) was defined as the time from diagnosis until progression, re-treatment, or death of any cause. Patients without an event were censored at last known follow-up. Cox proportional hazard models and Kaplan-Meier curves25,26 were used to assess the association of EFS with pSTAT3 and Myc. Associations between cytokines and pSTAT3 status were assessed individually using nonparametric Wilcoxon rank-sum tests.
Results
Constitutive STAT3 activity in untreated DLBCL tumors
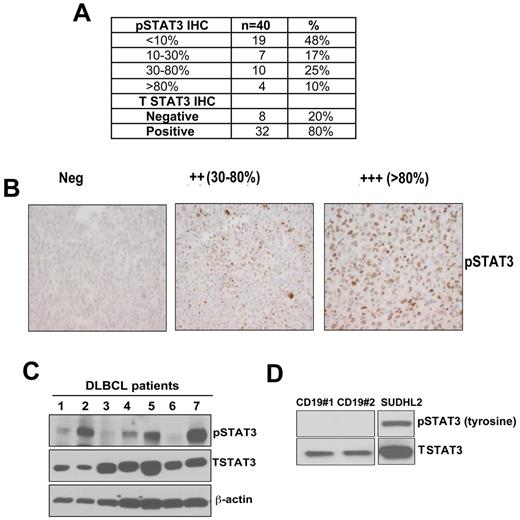
DLBCL tumor samples were stained for detection of nuclear pSTAT3 expression (Figure 1A). Using a threshold of ≥ 30% of tumor nuclei staining positive, 35% (14 of 40) of patient tumors were pSTAT3+ (Figure 1A-B). An additional 17% (7 of 40) had between 10%-30% pSTAT3+ cells. The pSTAT3 staining was verified in paraffin-embedded sections from DLBCL cell lines previously demonstrated to be pSTAT3 positive or negative27 (supplemental Figure 1A, available on the Blood Web site; see the Supplemental Materials link at the top of the online article). We also assessed the total STAT3 (tSTAT3) expression and found that 80% (32 of 40) of the patients were tSTAT3+ (Figure 1A). Nonmalignant tonsil tissues (n = 10) were positive for tSTAT3 in all cases; all but 1case were pSTAT3 negative (data not shown).
Detection of pSTAT3/STAT3 expression on untreated DLBCL tumors. (A) By immunohistochemistry (IHC). (B) Representative pSTAT3 staining in paraffin-embedded tissues from DLBCL tumors (original magnification ×400). (C-D) Western blotting was performed to assess pSTAT3 and tSTAT3 expression in DLBCL patients (n = 7; C); CD19+ normal B cells (n = 2); and DHL2 (DLBCL cell line; D).
Detection of pSTAT3/STAT3 expression on untreated DLBCL tumors. (A) By immunohistochemistry (IHC). (B) Representative pSTAT3 staining in paraffin-embedded tissues from DLBCL tumors (original magnification ×400). (C-D) Western blotting was performed to assess pSTAT3 and tSTAT3 expression in DLBCL patients (n = 7; C); CD19+ normal B cells (n = 2); and DHL2 (DLBCL cell line; D).
We also analyzed the STAT3 phosphorylation by Western blot in DLBCL samples (n = 7). Three patient samples were strongly pSTAT3 positive, 2 were weakly positive, and the other 2 were negative. All 7 tumors were positive for tSTAT3 (Figure 1C). Normal CD19 B cell controls were positive for tSTAT3 but negative for pSTAT3. DHL2 was used as a positive control for pSTAT3 expression (Figure 1D). Overall, these data demonstrate that pSTAT3 is frequently expressed in a subset of DLBCL tumors.
Expression of Myc protein by IHC in untreated DLBCL
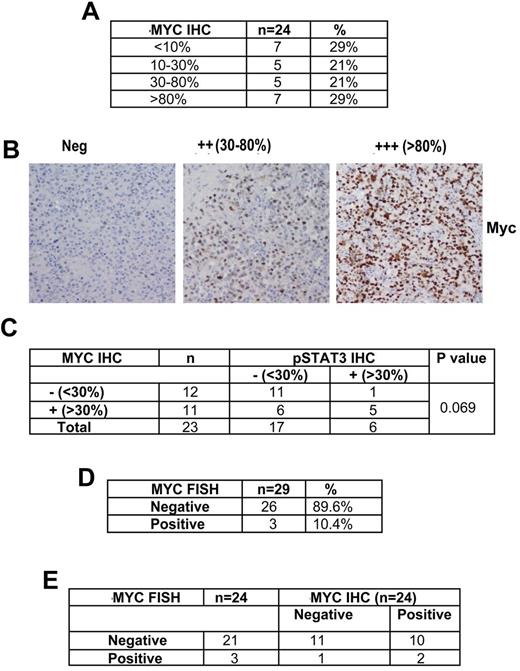
We have shown that JAK2 inhibition through the JAK2 specific inhibitor TG101348 inhibits Myc expression without affecting expression of other STAT3 downstream genes.24 Because Myc is downstream of STAT3 in the signal pathway, we next examined Myc protein expression by IHC. Twenty-four of the same DLBCL tumors used for pSTAT3 expression were stained and 50% (12 of 24) were Myc positive (all nuclear) as defined by the criteria of ≥ 30% of cells staining positive (Figure 2A-B). In cases (n = 23) where both Myc and pSTAT3 IHC were performed, a positive pSTAT3 was more likely to have Myc expression, whereas a positive Myc stain did not inform pSTAT3 status (Figure 2C). The Myc antibody was validated in paraffin-embedded sections from several DLBCL cell lines (DHL2, Ly3, Ly10, Ly19, Ly1, and DHL6). As expected, all these aggressive lymphoma cell lines were positive for Myc protein by IHC (supplemental Figure 1B). Myc protein expression was also evaluated in these cell lines by Western blotting, and all cell lines were strongly positive for Myc; normal B cells were negative for Myc protein (supplemental Figure 1C).
Detection of Myc expression and Myc translocations on DLBCL tumors from patients participating in N0489 ER-CHOP protocol for untreated DLBCL. (A) Expression of Myc by IHC in DLBCL tumors. (B) Representative cases of MYC IHC staining (original magnification ×400). (C) IHC staining of both Myc and pSTAT3 in DLBCL tumors (n = 23). (D) Myc translocations in DLBCL tumors by FISH (n = 29). (E) Comparison of Myc IHC and Myc FISH in DLBCL tumors (n = 24).
Detection of Myc expression and Myc translocations on DLBCL tumors from patients participating in N0489 ER-CHOP protocol for untreated DLBCL. (A) Expression of Myc by IHC in DLBCL tumors. (B) Representative cases of MYC IHC staining (original magnification ×400). (C) IHC staining of both Myc and pSTAT3 in DLBCL tumors (n = 23). (D) Myc translocations in DLBCL tumors by FISH (n = 29). (E) Comparison of Myc IHC and Myc FISH in DLBCL tumors (n = 24).
Myc translocations in untreated DLBCL patients
Using a break-apart probe for the Myc gene, MYC translocations in the major breakpoint regions were found in 10% (3 of 29) of cases (Figure 2D). When Myc FISH was correlated with Myc IHC in the 24 DLBCL cases that had both techniques performed, all 3 Myc translocation cases were GCB by IHC, 2 were strongly positive for Myc, and 1 was negative (Figure 2E). Among the 21 MYC FISH negative cases, 10 were Myc positive by IHC (Figure 2E). These data suggest that Myc expression in lymphoma is not only controlled by genetic events, such as translocations, but also by other signaling pathways, such as STAT3. Overall, these data confirm the Yoon et al findings that MYC translocation predicts poor prognosis, especially in GCB DLBCL.28
Prognostic impact of Myc, pSTAT3 and Myc translocations in DLBCL treated with ER-CHOP
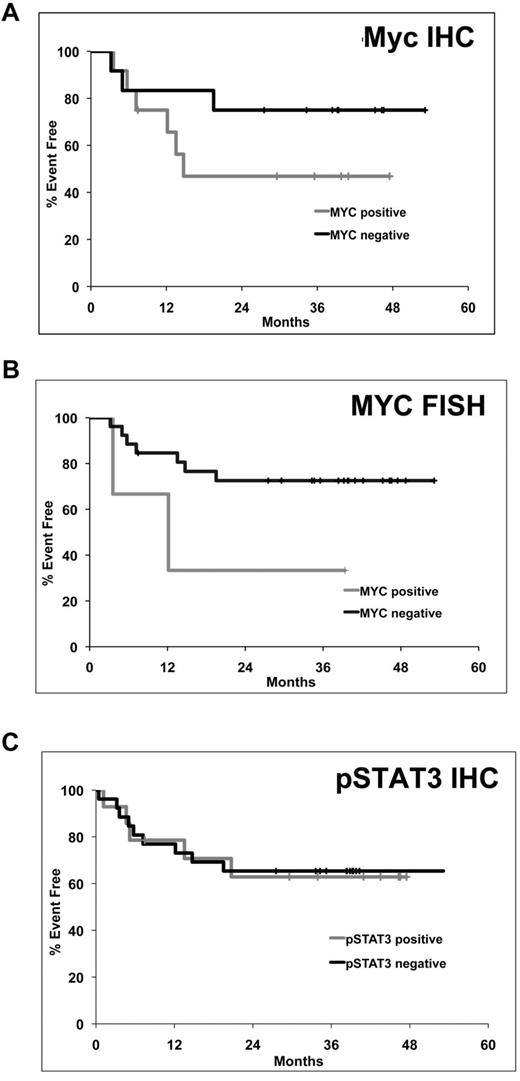
Although the dataset was small, the fact that this was a uniformly treated group of patients treated on a clinical trial using R-CHOP–based treatment, we explored whether there was a correlation between tumor pSTAT3 or Myc expression and patient characteristics and outcome. pSTAT3 expression was correlated with an elevated serum LDH (P = .0007; Table 1). Neither Myc nor pSTAT3 tumor expression correlated with other clinical or pathologic features (Table 1). Survival analysis revealed a trend toward shorter EFS for DLBCL patients whose tumors expressed Myc protein by IHC (P = .2) or had a Myc translocation (P = .09) by FISH (Figure 3A-B); pSTAT3 expression status did not predict EFS (P = .9; Figure 3C).
Correlation of pSTAT3 and Myc expression by IHC with clinicopathologic characteristics of DLBCL patients treated on the N0489 ER-CHOP clinical trial
| Parameter . | pSTAT3 IHC . | c-Myc IHC . | ||||||
|---|---|---|---|---|---|---|---|---|
| DLBCL (n = 40) . | STAT3− (n = 26), n (%) . | STAT3+ (n = 14), n (%) . | P . | DLBCL (n = 24), n (%) . | cMyc− (n = 12), n (%) . | cMyc+ (n = 12), n (%) . | P . | |
| Age ≥ 60 y | 17 (43) | 12 (46) | 5 (36) | .52 | 10 (42) | 5 (42) | 5 (42) | 1.00 |
| B symptoms present | 20 (50) | 14 (54) | 6 (43) | .51 | 14 (58) | 7 (58) | 7 (58) | 1.00 |
| Elevated LDH | 30 (75) | 23 (88) | 7 (50) | .007 | 18 (75) | 10 (83) | 8 (67) | .35 |
| Performance status ≥ 2 | 5 (13) | 3 (12) | 2 (14) | .80 | 4 (17) | 2 (17) | 2 (17) | 1.00 |
| EN sites ≥ 2 | 7 (18) | 5 (19) | 2 (14) | .69 | 4 (17) | 3 (25) | 1 (8) | |
| Stage III/IV | 31 (78) | 20 (77) | 11 (79) | .91 | 18 (75) | 9 (75) | 9 (75) | 1.00 |
| Bulky disease ≥ 10 cm | 6 (15) | 5 (19) | 1 (7) | .31 | 5 (21) | 4 (33) | 1 (8) | .13 |
| IPI 0-2 | 24 (60) | 15 (58) | 9 (64) | .68 | 14 (58) | 7 (58) | 7 (58) | 1.00 |
| IPI 3-5 | 16 (40) | 11 (42) | 5 (36) | 10 (42) | 5 (42) | 5 (42) | ||
Kaplan-Meier plots of event free survival in DLBCL patients treated with ER-CHOP. (A) Myc by IHC (N = 24, B) MYC translocation by FISH (n = 29, C) pSTAT3 by IHC (n = 38).
Kaplan-Meier plots of event free survival in DLBCL patients treated with ER-CHOP. (A) Myc by IHC (N = 24, B) MYC translocation by FISH (n = 29, C) pSTAT3 by IHC (n = 38).
Expression of Myc in GCB and non-GCB DLBCL
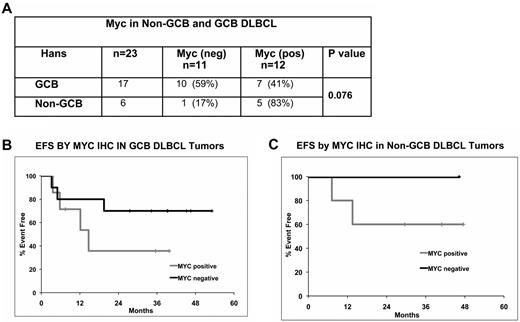
By use of the Hans method, we classified DLBCL tumors (n = 23) into GCB (n = 17) and non-GCB (n = 6). Within the GCB group, 10 cases were Myc negative (10 of 17; 59%) and 7 cases were Myc positive (7 of 17; 41%). Among the non-GCB group, 83% (5/6) were Myc positive (Figure 4A). These data clearly suggest a trend of higher Myc positivity in the non-GCB DLBCL group (P = .07). Myc-positive cases had a clear trend of inferior EFS in both GCB (P = .2) and in non-GCB (P = .5) groups (Figure 4B-C).
Myc expression and prognosis within DLBCL molecular subtypes. (A) Myc expression by IHC in GCB and non-GCB subtypes. (B-C) EFS by Myc positivity in ER-CHOP–treated GCB (n = 17; B) and non-GCB (n = 6; C) DLBCL patients.
Myc expression and prognosis within DLBCL molecular subtypes. (A) Myc expression by IHC in GCB and non-GCB subtypes. (B-C) EFS by Myc positivity in ER-CHOP–treated GCB (n = 17; B) and non-GCB (n = 6; C) DLBCL patients.
Distribution of pSTAT3 in GCB and non-GCB DLBCL
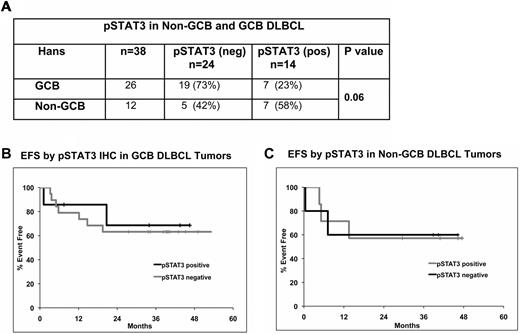
The distribution of pSTAT3 (n = 38) expression was also evaluated in the GCB (n = 26) and non-GCB (n = 12) DLBCL. In the GCB group, 27% (7 of 26) were pSTAT3 positive compared with 58% (7 of 12) in the non-GCB group (Figure 5A). Thus, there was a clear trend toward higher pSTAT3 positivity in non-GCB DLBCL tumors (P = .06); however, pSTAT3 status did not correlate with EFS in either GCB or non-GCB DLBCL patients (Figure 5B-C).
pSTAT3 expression and prognosis within DLBCL molecular subtypes. (A) Correlation of pSTAT3 with GCB and non-GCB DLBCL (n = 38) subtypes. (B-C) EFS analysis by pSTAT3 positivity in ER-CHOP–treated GCB (n = 26; B) and non-GCB (n = 12; C) DLBCL patients.
pSTAT3 expression and prognosis within DLBCL molecular subtypes. (A) Correlation of pSTAT3 with GCB and non-GCB DLBCL (n = 38) subtypes. (B-C) EFS analysis by pSTAT3 positivity in ER-CHOP–treated GCB (n = 26; B) and non-GCB (n = 12; C) DLBCL patients.
Correlation of pSTAT3 and Myc expression with serum cytokines in ER-CHOP–treated DLBCL
Previous data from our laboratory demonstrated that IL-10 can activate STAT3 phosphorylation in vitro in DLBCL lines and that patients with high serum IL-10 had an inferior EFS.24 In the present study, we correlated pretreatment serum cytokines levels of these patients with pSTAT3 and Myc tumor cell expression. Of the 30 cytokines tested (Figure 6A), the only pretreatment cytokines that were significantly correlated with pSTAT3 expression were IL-10 (P = .05), G-CSF (P = .03), and TNF-α (P = .04); none was correlated with Myc expression (Figure 6A). In vitro experiments demonstrated that IL-10 (but not G-CSF and TNF-α) was able to activate STAT3 tyrosine phosphorylation in the lymphoma cell line (Figure 6B).
Correlation of tumor pSTAT3 and Myc expression with pretreatment serum cytokines in the same patients treated on N0489. (A) Correlation of serum cytokine levels with pSTAT3 and Myc detection by IHC. (B) The serum-starved DHL2 cell line was treated with recombinant human IL-10, G-CSF, or TNF-α (R&D Systems) for various time intervals and subjected to Western blotting for pSTAT3 (tyrosine) antibody.
Correlation of tumor pSTAT3 and Myc expression with pretreatment serum cytokines in the same patients treated on N0489. (A) Correlation of serum cytokine levels with pSTAT3 and Myc detection by IHC. (B) The serum-starved DHL2 cell line was treated with recombinant human IL-10, G-CSF, or TNF-α (R&D Systems) for various time intervals and subjected to Western blotting for pSTAT3 (tyrosine) antibody.
Discussion
Constitutively activated STAT3 regulates tumor growth and invasion by affecting the expression of genes related to tumor cell survival.12,29 Studies in renal, squamous, and gastric cancers have found that the expression of pSTAT3 in these tumors was associated with an inferior prognosis.30,31 In lymphoma, it has been reported that ABC DLBCL lines are positive for pSTAT3, whereas GCB DLCBL lines are pSTAT3 negative.14,15 To date, there have been no studies relating pSTAT3 to survival parameters in DLBCL. We investigated pSTAT3 expression by IHC in primary tumor samples from 40 patients with DLBCL all treated on the same ER-CHOP clinical trial and found that 35% of tumors were pSTAT3 positive. Non-GCB tumors by IHC were more likely to be positive for pSTAT3. ABC-DLBCL lymphomas treated with R-CHOP typically have an inferior EFS and OS compared with GCB-type tumors.6,32,33 In this study, pSTAT3, although more frequent in non-GCB tumors, did not correlate with EFS possibly because of the small numbers of patients in this study or the fact that ER-CHOP has potentially improved the EFS of the non-GCB type DLBCL.
A number of studies have evaluated translocations of MYC with immunoglobulin genes in Burkitt lymphoma and DLBCL.16 Although the incidence of MYC translocation in DLBCL is only 5%-10%, these cases have an unfavorable prognosis.17,34 To date, there have been no DLBCL studies evaluating the prognostic importance of the expression of Myc protein by IHC because of the lack of a good antibody for Myc IHC. We showed that Myc protein expression by IHC is observed in 50% of DLBCL cases by IHC methodology; that Myc expression was frequent in the non-GCB group; and that Myc positive cases had an inferior prognosis, even if they were GCB tumors. Genetic translocations involving MYC defines a small group of DLBCL patients with a poor prognosis.18 MYC translocation by FISH was observed in 10.4% of cases in this study, and all of them were in the GCB group and all were Myc-positive by IHC. A total of 45% of the pSTAT3+ patients were also Myc-positive by IHC, suggesting the involvement of STAT3 signaling in these cases of Myc expression. Our study suggests that Myc by IHC is also a poor prognostic factor, even in patients treated with R-CHOP–based regimens, such as ER-CHOP. Potentially more important, our results suggest that Myc expression is an adverse prognostic factor within the GCB-group, a group that traditionally is thought of as having a good prognosis. The mechanisms of high Myc expression in DLBCL tumors without MYC translocation are not entirely cleat at this time. One potential mechanism is that STAT3 signaling may be involved in the Myc expression. Indeed, about half of the Myc-positive tumors were pSTAT3+ by IHC using our criteria. A second potential mechanism is regulation of Myc protein stability. This has been shown to be important in breast cancer cells where Myc protein stability is regulated by phosphorylation at threonine 58 (T58) and serine 62 (S62), which coordinates with the scaffold protein Axin 1.35 Whether this mechanism exists in the lymphoma cells will require further studies.
Cytokines are low-molecular weight proteins that regulate several signaling pathways. The STAT3 pathway is activated with a variety of cytokines, which may or may not be secreted by tumors. We have seen significant elevation of certain serum cytokines in the DLBCL patients compared with normal controls.24 Among several elevated cytokines, only IL-10, G-CSF, and TNF-α were significantly correlated with pSTAT3 expression. These cytokines have the potential to be important serum biomarkers for DLBCL. The strengths of this study are the use of a well-characterized and uniformly treated patient population, the patients were all untreated, the regimen was R-CHOP–based, and all tissues were reviewed by the same hematopathologist. Overall, our data provide evidence that overexpression of pSTAT3 and Myc is common in DLBCL. These biomarkers have potential as prognostic factors in the case of Myc and as a tool for selecting therapy for pSTAT3. Myc may be especially useful to further identify an adverse group of DLBCL patients within the otherwise favorable GCB tumor group. The availability of JAK/STAT and STAT-specific inhibitors provides the rationale to incorporate pSTAT3 staining in tumors from patients who are participating in these trials to learn if this biomarker can predict response. The primary limitation of our study was that the number of cases studied was small, limiting the statistical correlations with Myc FISH and clinical outcome. The study does provide rationale to study Myc and pSTAT3 by FISH and IHC in large prospective trials of DLBCL to confirm and extend our initial findings.
The online version of this article contains a data supplement.
The publication costs of this article were defrayed in part by page charge payment. Therefore, and solely to indicate this fact, this article is hereby marked “advertisement” in accordance with 18 USC section 1734.
Acknowledgments
This work was supported in part by the University of Iowa/Mayo Clinic Lymphoma Specialized Program of Research Excellence (Career Development Award P50 CA097274; M.G.), Goodwin Foundation Pilot award (M.G.), the North Central Cancer Treatment Group (CA25224; and Biospecimen Resource Grant CA114740), and the Predolin Foundation Award. This work is supported in part by R01-CA127433 to T.E.W.
National Institutes of Health
Authorship
Contribution: M.G. designed the research, analyzed and interpreted data, made the figures, and wrote the paper; M.J.M. performed all the statistical analysis; M.E.L. performed the FISH assay; L.E.W. performed pSTAT3 and Myc IHC staining in DLBCL tumors and in DLBCL cell lines; J.J.H. performed Western blot experiments; N.O. performed IHC for DLBCL molecular subtyping; I.N.M. led the clinical trial from which the clinical samples were obtained; A.D. scored and reviewed IHC and FISH slides; and T.E.W. designed the original clinical trial, interpreted data, and wrote the paper.
Conflict-of-interest disclosure: The authors declare no competing financial interests.
Correspondence: Mamta Gupta, PhD, Division of Hematology, Mayo Clinic, College of Medicine, 200 First St SW, Rochester, MN 55905; e-mail: gupta.mamta@mayo.edu.


This feature is available to Subscribers Only
Sign In or Create an Account Close Modal